The Internet of Things on AWS – Official Blog
Data ingestion using AWS Step Functions, AWS IoT Events, and AWS IoT Analytics
A key trend we observe with industrial IoT projects is that new industrial equipment come with out-of-the-box cloud connectivity and allow near real-time processing of sensor data. This makes it possible to immediately generate KPIs allowing to monitor those equipment closely and to optimize their performance. However, a lot of industrial IoT data is still stored in legacy systems (e.g. SCADA systems, messaging systems, on-premises databases) with different formats (e.g. CSV, XML, MIME). This raises multiple challenges concerning the real-time management of that sensor data, such as:
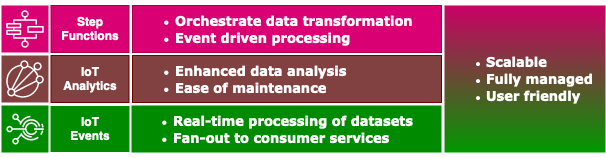
- Data transformation orchestration: On-premises industrial data comes from different sources each having their own format and their own communication protocol. It is therefore necessary to find a means to orchestrate the management of all that incoming data, with a view to structure it before analysis.
- Event driven processing: Batch jobs can introduce latencies in the data management pipeline, which motivates the need for an event-driven architecture to ingest industrial data.
- Data enrichment with external sources: Data enrichment is sometimes a mandatory step in order to allow efficient analysis.
- Enhanced data analysis: Complex queries are sometimes needed to generate KPIs.
- Ease of maintenance: Companies do not always have the time or the internal resources to deploy and manage complex tools.
- Real-time processing of datasets: Some metrics needs to be constantly monitored, which implies immediate processing of datasets to take actions.
- Data integration with other services or applications: Finally, it will be necessary to automate the output of the analysis results to other services which need to process them in real time.

In this blog post we show how customers can use AWS Step Functions, AWS IoT Analytics, and AWS IoT Events as the basis of a lightweight architecture to address the aforementioned challenges in a scalable way.
Solution overview
In the use case we discuss in this blog post, we assume that a company is receiving sensor data from its industrial sites through CSV files that are stored in an Amazon S3 bucket. The company has to dynamically process those files to generate key performance indicators (KPIs) every five minutes. We assume the sensor data must be enriched with additional information, such as upper and lower threshold limits, before being stored in Amazon DynamoDB. The flow of data will be constantly monitored so that alarms can be raised if there are missing data records.
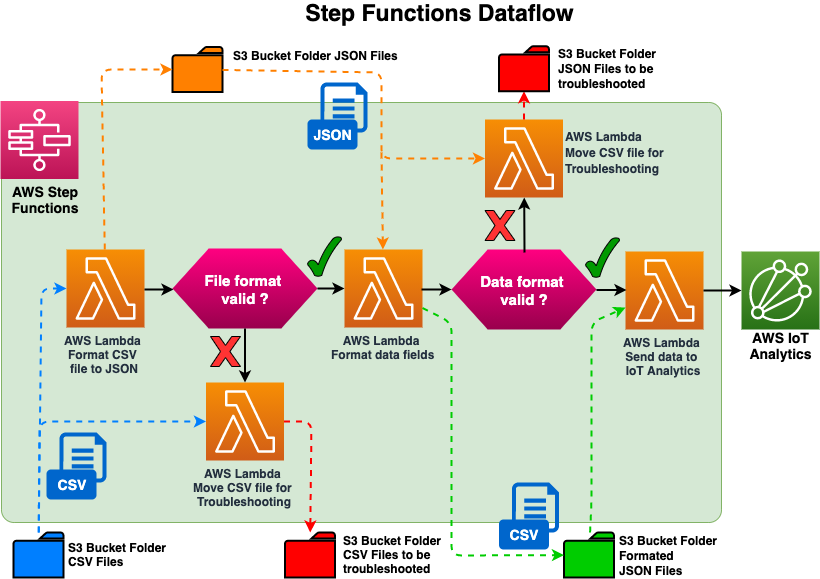
The AWS CloudFormation template provided with this blog provisions the resources needed to simulate this use case. It includes a built-in data simulator which feeds a Step Functions workflow with CSV files containing sensor data having four fields: 1/ timestamp, 2/ production order id, 3/ asset id, 4/ value. This data is then converted to JSON objects using AWS Lambda functions, which are then forwarded to AWS IoT Analytics to enrich the data (with upper and lower limits) and retrieve it every five minutes by creating a dataset. Finally, this AWS IoT Analytics dataset is sent automatically to AWS IoT Events to be monitored and stored in DynamoDB.

Refer to the CloudFormation template: iot-data-ingestion.json
Prerequisites
For this walkthrough, you should have the following prerequisites:
- An AWS account.
- Basic programming knowledge in Python3.8 and SQL.
- Basic knowledge of AWS CloudFormation, Amazon S3, Amazon DynamoDB, AWS Step Functions, AWS IoT Events, and AWS IoT Analytics.
Data simulation
The data simulator is coded in Python3.8 and runs in a Lambda function which is invoked every minute via a scheduled Amazon CloudWatch event. The data simulator stores five metrics in a CSV file in an Amazon S3 bucket, as shown in the following image. Those five metrics represent measurements from a production line.
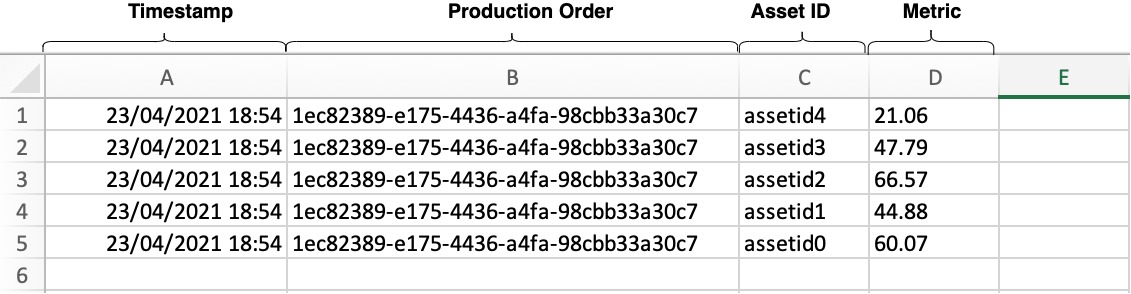
A production order ID is associated with each metric. This production order ID is changed every 100 invocations of the Lambda function, and for each change, upper and lower limits of the metrics are saved in DynamoDB. These limits will be used to enrich the metrics when processed by AWS IoT Analytics. For example, let’s consider that one of the five metrics represents a revolutions per minute (RPM) measurement on a machine within a production line. Depending on the production order being fulfilled by the production line, the machine may need to be set to run at a specific RPM. Therefore, the upper and lower limits that represent the boundaries of normal operation for the machine will need to be different for each production order. The data simulator will store these upper and lower limits in DynamoDB to represent information from an external data source that will be used to enrich the data generated from the production line (the data stored in the CSV file).
Data preparation
The simulated data that represents the data coming from an industrial site is stored in a CSV file. This data must then be converted into a JSON format in order to be ingested by AWS IoT Analytics. Step Functions offer a flexible service to prepare data. So, instead of building a custom monolithic application, we spread the complexity of the data transformation across three Lambda functions, which are sequenced via a JSON canvas. The first Lambda function will format the CSV file into JSON, the second Lambda function will format the data field and append a timestamp, and the third Lambda function will send the data to AWS IoT Analytics. In addition, we have implemented checks to redirect invalid files to an Amazon S3 bucket if there is an error during the execution of the first two Lambda functions to be troubleshooted and reprocessed later.
By proceeding in the same way, formats of different file types like MIME or XML could be handled within the same data flow. Getting started with Step Functions is easy because the sequencing is done with a simple JSON file that can be created directly via the Step Functions console which has a graphical interface that clearly identifies the sequencing of each step (see screenshot below). Passing parameters from one Lambda function to another is as easy has manipulating JSON objects.

The data preparation architecture uses an event-driven approach, where the saving of the CSV file to Amazon S3 will generate a CloudWatch event that triggers a Step Function to process the CSV file immediately. Let’s consider a scenario where instead we used a batch processing approach, where we have a CSV file containing production line data being stored to Amazon S3 every one minute. In this example we run a batch job every hour to process the CSV files, which will introduce a maximum data processing latency of up to 1 hour to ingest and process the data. However, with an event driven architecture, each CSV file will be processed as soon as it is saved to an Amazon S3 bucket, and eliminate any latency.
Data enrichment and analysis
We use AWS IoT Analytics to perform data enrichment and analysis. Four of its components are needed:
- Channels: Collect raw or unprocessed data from external sources, and feed AWS IoT Analytics pipelines.
- Pipelines: Clean, filter, transform, and enrich data from AWS IoT Analytics channels.
- Data Stores: Store processed data from the AWS IoT Analytics pipeline .
- Datasets: Analyze data with ad-hoc SQL queries on the AWS IoT Analytics data store.
In this use case, we used a single AWS IoT Analytics channel. Given the data preparation done by the Step Functions, we assume that all the incoming data are valid and ready to be analyzed. That data will flow through to an AWS IoT Analytics pipeline,which will enrich the metrics with the upper and lower limits sourced from the DynamoDB table, and then routes the data to an AWS IoT Analytics data store. As described earlier, these limits are stored in a DynamoDB table by the data simulator and then queried in AWS IoT Analytics based on the asset id and the production order id.
We could have decided to append production line data with the upper and lower limits before sending the record to AWS IoT Analytics, but once the upper and lower limits are stored together with the production measurement data in the AWS IoT Analytics channel, it can’t be updated. However, appending the upper and lower limits through the AWS IoT Analytics pipeline gives the flexibility to replay the records with different limits. For example, if the upper and lower limits associated with the production line data have changed for the previous month, you then just need to reprocess the data using an AWS IoT Analytics pipeline and enrich with the latest limits. Refer to the following diagram for more information.

Once the enriched data is stored in the AWS IoT Analytics data store the data is ready to be queried. You retrieve data from a data store by creating an AWS IoT Analytics dataset. Datasets are generated using SQL expressions on the data in a data store, and in our use case, the dataset repeats the query every five minutes.

Data Processing
To record and monitor the incoming flow of data from AWS IoT Analytics, use AWS IoT Events, which can automatically send the dataset contents to an AWS IoT Events input. In our use case we are sending datasets every five minutes. We use the asset ID as a key by an event detector created in AWS IoT Events for each asset, which then runs custom, pre-defined conditional logic that is triggered by the incoming data and an internal timer.
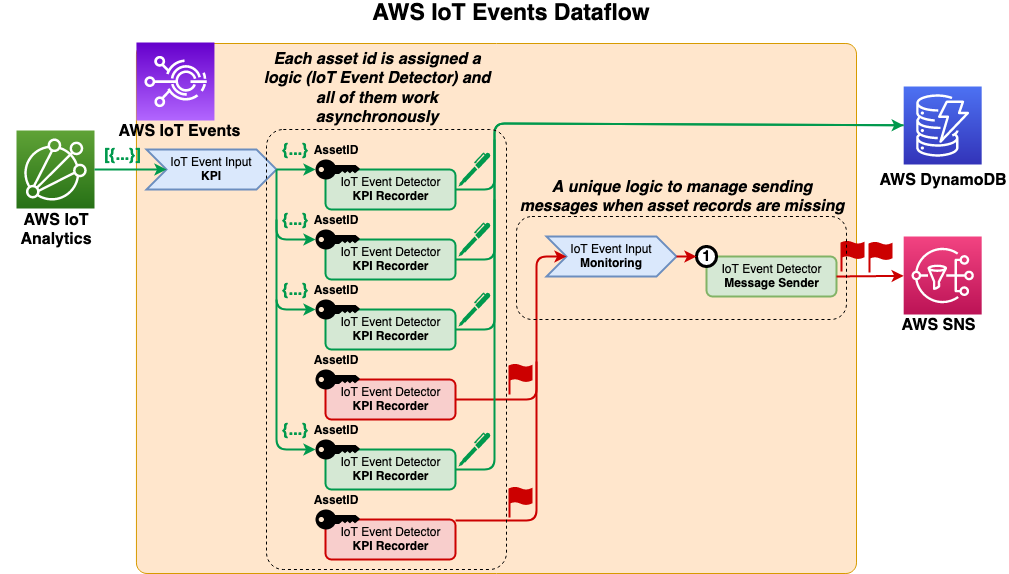
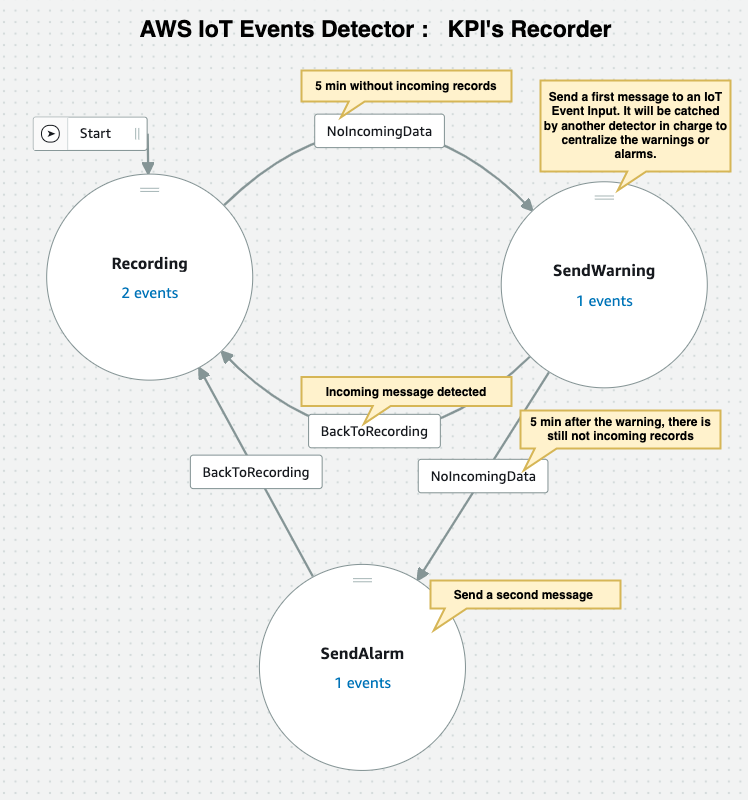
The event detector saves the input data to a DynamoDB table and resets a five minute timer. After this time period, the event detector triggers a message as an input to a second event detector which is used to merge all the incoming messages to send a single consolidated message. Let’s consider a scenario where we are monitoring 100 assets in a manufacturing plant, and every asset is sending an alarm. Without this second event detector identified to output a single alarm on behalf of all those assets, each asset event detector would send its own alarm message that may inundate the target mailbox. This would require additional and time consuming analysis of many email notifications, thereby further delaying any response needed to address the alarms. Because this specific event detector is be able to monitor alarms across the whole site, it can escalate the alarms accordingly.

Cleaning up
To avoid incurring future charges, delete the CloudFormation stack.
Conclusion
This post has presented a simple architecture built around three services: AWS IoT Events, AWS IoT Analytics, and Step Functions. The architecture addresses challenges often encountered when it comes to ingesting data from disparate systems. This architecture can also be used for collecting and processing data to be used for training machine learning models.
To get started and deploy the architecture described in this article, use this CloudFormation template.