The Internet of Things on AWS – Official Blog
Strengthening Operational Insights for Industrial Assets with AWS IoT AIML Solution (part 2)
In this two-part blog post, we propose an AWS IoT AI/ML solution to help our industrial customers for efficiently monitoring industrial assets in a scalable manner. Part 1 of the blog shows:
- How to create an asset simulator with AWS IoT SiteWise;
- How to create data pipeline to integrate Amazon Lookout for Equipment with AWS IoT SiteWise.
In this post, you will continue building the solution started in part 1 of this series. You will need to have AWS IoT SiteWise and SiteWise Monitor configured with the industrial assets and prepared the data pipeline to send data to Amazon Lookout for Equipment. If you haven’t completed these steps, review Part 1, Steps 1 and 2 before proceeding.
The following Steps 3 and 4 will guide you through how to:
- Train Amazon Lookout for Equipment model with historical training data, and evaluate model performance;
- Use Amazon Lookout for Equipment to establish inference scheduler to provide anomaly prediction for assets;
- Augment the dashboard built in Part 1 with Amazon Lookout for Equipment service for anomaly alerts and remote monitoring.
Step 3: Train Lookout for Equipment Model
Before we proceed to building our model, let’s refresh what Amazon Lookout for Equipment is and how it works. Amazon Lookout for Equipment uses ML to detect abnormal behavior in your equipment and identify potential failures. Each piece of industrial equipment is referred to as an industrial asset, or asset. To use Lookout for Equipment to monitor your asset, you do the following:
- Provide Lookout for Equipment with your asset’s data. The data come from sensors that measure different features of your asset. For example, you could have one sensor that measures temperature and another that measures pressure.
- Start a training job in Amazon Lookout for Equipment to train a custom ML model.
- Set up an inference scheduler to monitor the asset nearly continuously for anomalies.
Asset failures are rare and even the same failure type might have its own unique data pattern. Nonetheless, all detectable failures are preceded by behavior or conditions that fall out of the normal behavior of the equipment. Lookout for Equipment is designed to look for those patterns by training a model that uses the sensor data to establish the baseline or normal behavior of an asset. In other words, it’s trained to know what constitutes normal behavior and detects deviations from normal behavior as it monitors your equipment. To highlight abnormal equipment behavior, Lookout for Equipment uses labeled data in model training. Labeled data is a list of historical date ranges that corresponded to the times when your asset was behaving abnormally. Providing this labeled data is optional, but if it’s available, it can help train your model more accurately and efficiently.
The following screenshot from Amazon Lookout for Equipment service shows an example of labeled data with periods of abnormal asset behavior.
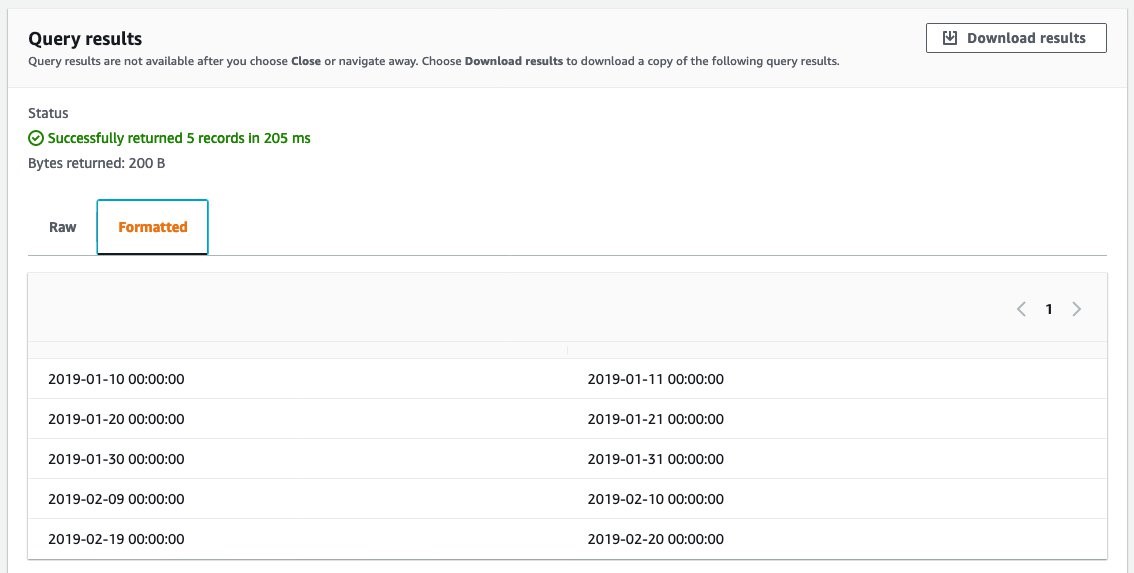
Figure 1: Format of label data used for Amazon Lookout for Equipment
After you train your model, you can visualize the evaluation of the trained Lookout for Equipment model on the evaluation window, as shown in Figure 2.
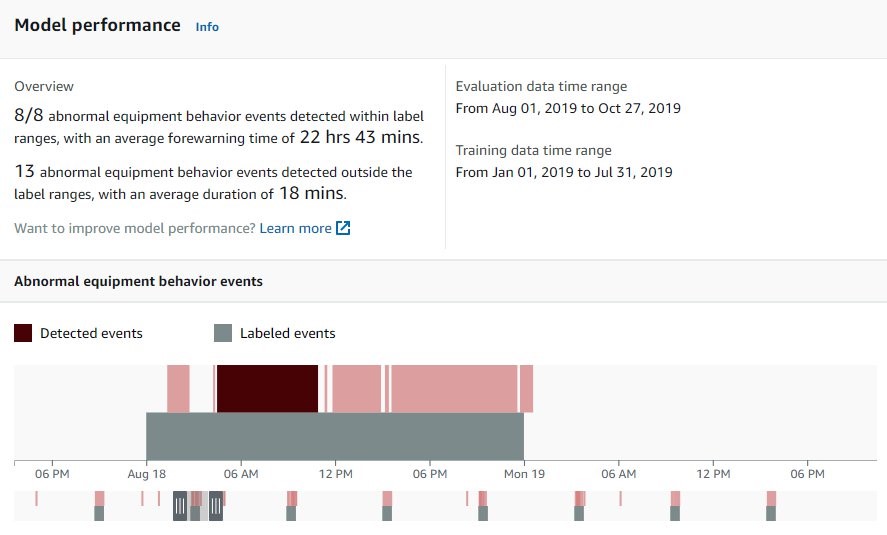
Figure 2: Summary of model training in Amazon Lookout for Equipment console
And you can also select each event and Lookout for Equipment unpacks the sensor ranking and displays the top sensors contributing to the detected events. The following screenshot from the Lookout for Equipment console shows the top 15 sensors that contribute to this anomaly event. This anomaly score ranking can help the OT team to perform component checks or repairs more efficiently by starting from sensors with high anomaly scores.
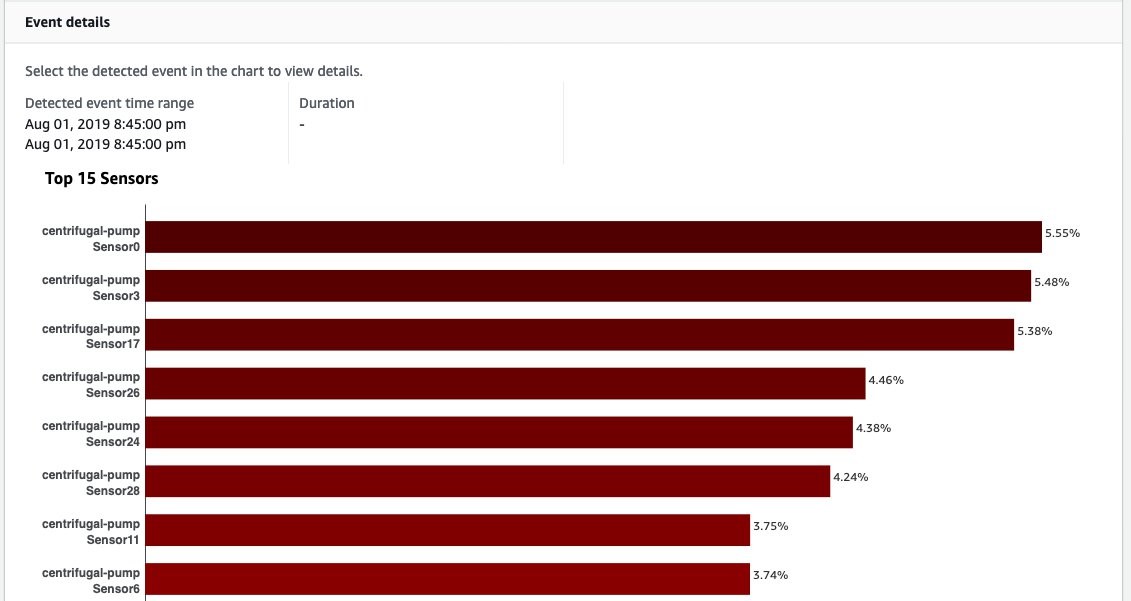
Figure 3: Analysis of top 15 sensors that contribute to anomaly behavior
Finally, we can use the model to monitor your asset by scheduling the frequency with which Lookout for Equipment processes new sensor data through batch inference every 5 minutes. The following screenshot of Lookout for Equipment inference scheduler shows the inference history of such batch inferences at a frequency of once per 5 minutes.
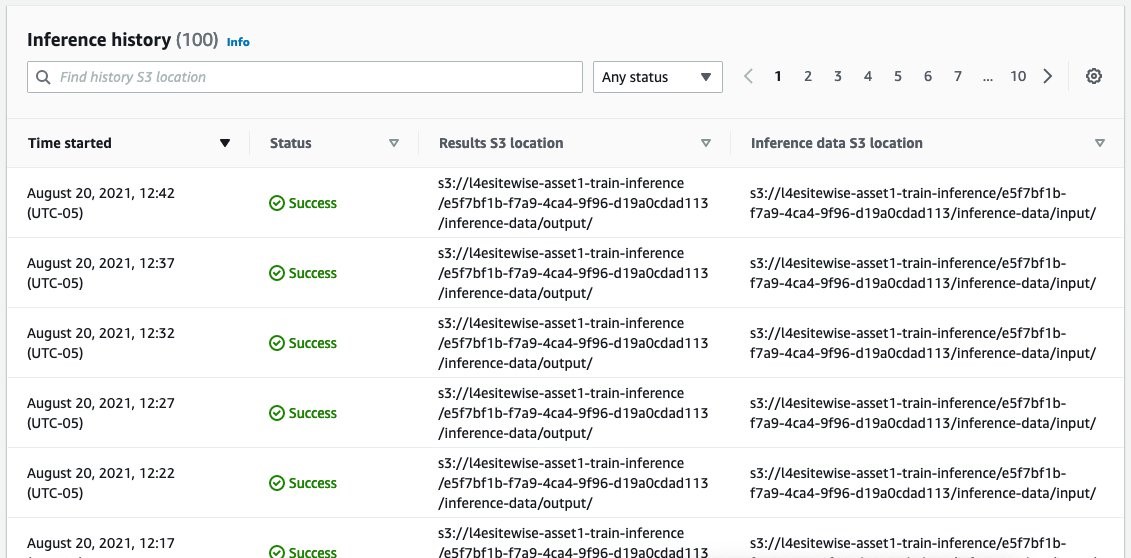
Figure 4: Inference scheduler status with Amazon Lookout for Equipment
Now that we have a firm grasp on what Amazon Lookout for Equipment does and how it works, let’s proceed to build our model.
- In part 1 of this blog series, step 1 set up an AWS IoT SiteWise simulator with a CloudFormation template, and UUIDs of two pump assets are listed as outputs. Navigate to the Outputs section and copy AssetID values.

Figure 5: Output section of the AWS CloudFormation stack from step 1
- Navigate to the SageMaker console and locate the notebook instance created by the template. Select Open JupyterLab.

Figure 6: Amazon SageMaker notebook instance
- In JupyterLab, navigate to l4e_notebooks folder, (1) add the for the first pump asset (FirstAssetId) in AssetID in the config.py; (2) add BUCKET (as it is shown in Figure 7) with the Amazon Simple Storage Service (Amazon S3) bucket created in Step 2 for pump asset 1.

Figure 7: Screenshot showing S3 bucket name created within part 1 step 2 of this blog

Figure 8: Config file used for Amazon SageMaker notebook
Note: Amazon Lookout for Equipment will train a unique model for each industrial asset, and derive tailored insights while the asset has been operated within its own environment. In order to train a model for asset 2, you will need to update the config.py with the new S3 path and UUID for asset 2 and rerun all the notebooks. You can also train only one model at this stage. However, we will discuss how to get value from monitoring multiple similar assets later in this post.
Run each notebook in the l4e_notebooks subdirectory in series. Although they contain detailed explanations for every step, here, we explain at a high level what is happening in each notebook.
- In 1_data_preparation.ipynb, the notebook will perform the following tasks:(1) Downloads the provided sample dataset from the original S3 bucket; (2) Uncompresses the contents into a local directory; (3) Loads the data into the training bucket for Lookout for Equipment.
- After all steps in 1_data_preparation.ipynb are successfully completed, we can continue to 2_dataset_creation.ipynb. Here we will create a data_schema for our data and load the data into Lookout for Equipment by invoking the CreateDataset and StartDataIngestionJob APIs in this notebook.
- In 3_model_training.ipynb, this notebook will train an ML model in Lookout for Equipment. First, this notebook defines the train and evaluation date ranges. Then it passes in the S3 path to the labels.csv, which contains date ranges for known historical anomalies. Finally, we start a training job by invoking the CreateModel API.
- In 4_model_evaluation.ipynb, you can evaluate the trained model by extracting metrics associated with it with the DescribeModel API. Note that this step is optional and it doesn’t commit any changes. It is purely for the user to analyze the training results manually.
- Finally, in 5_inference_scheduling.ipynb, the notebook launches a model into production with the call to the CreateInferenceScheduler API.
Step 4: Build an AWS IoT SiteWise Monitor dashboard
Once the Lookout for Equipment inference schedule is created, the data pipeline that you set up in part 1, step 2 will integrate the Lookout for Equipment inference results with AWS IoT SiteWise. The OT team can use AWS IoT SiteWise Monitor as managed web applications to inspect and manage operational data and alarms over time. In step 1, a SiteWise Monitor portal and dashboard were set up to visualize data from 30 sensors over time. In this step, predictions and anomaly scores from Lookout for Equipment will be visualized within the same dashboard. For detailed instructions of building each visualization, refer to the project’s GitHub link. Note that the appearance of visualizations built by you may look different from the visualizations displayed in part 1 of this series. This is because the inference results on real-time AWS IoT SiteWise data were determined by sensor data at that particular timestamp when these screenshots were taken.
First, AWS IoT SiteWise alarm functions for each AWS IoT SiteWise asset are shown in Figure 9. You can see that the Demo Pump 1 displays the asset with an alarm status (in red) while the Demo Pump 2 alarm shows a normal status (in green). For the Pump Station, the alarm status is also normal. This is because the Pump Station anomaly score (Total L4EScore metric) is a sum of all Asset L4EScore from all associated assets. Since the threshold of Pump Station Total L4EScore—set at both pump assets being abnormal—has not been reached, the Pump Station alarm is shown as normal. In real applications, the OT team can define a suitable threshold to manage assets with multiple hierarchies.

Figure 9: AWS IoT SiteWise alarm for the Demo Pump Station
Second, Lookout for Equipment diagnostics for each sensor of Demo Pump 1 will be evaluated in detail to understand possible the reasons for an anomaly. Since 30 sensors belong to five different components as explained previously, we only show L4EScore for one sensor associated with each component for representative purposes. In the second visualization, the SensorX L4EScore for sensors 0, 6, 12, 18, and 24 are visualized with a grid widget. Sensor 6 from the impeller component shows an anomaly score90 times higher than sensor 24. This high anomaly score indicates a possible root cause of the asset’s abnormal behavior, and the behavior of the sensors associated with the impeller needs to be examined in details as a triage action.

Figure 10: SensorX L4E Score for different components in Demo Pump asset
Third, anomaly scores for sensors associated with the impeller are visualized. This visualization will help the OT team to understand if the high anomaly score only corresponds to a single sensor or corresponds to every sensor associated with the impeller. If the latter is true, this may indicate a component level failure. In figure 11, all sensors show high anomaly scores (>0.1) in the past 5 minutes. Notice that the minimum anomaly score for sensors with the impeller (Sensor 7) is 46 times higher than sensors from other components. Such high anomaly score indicates impeller component failure.
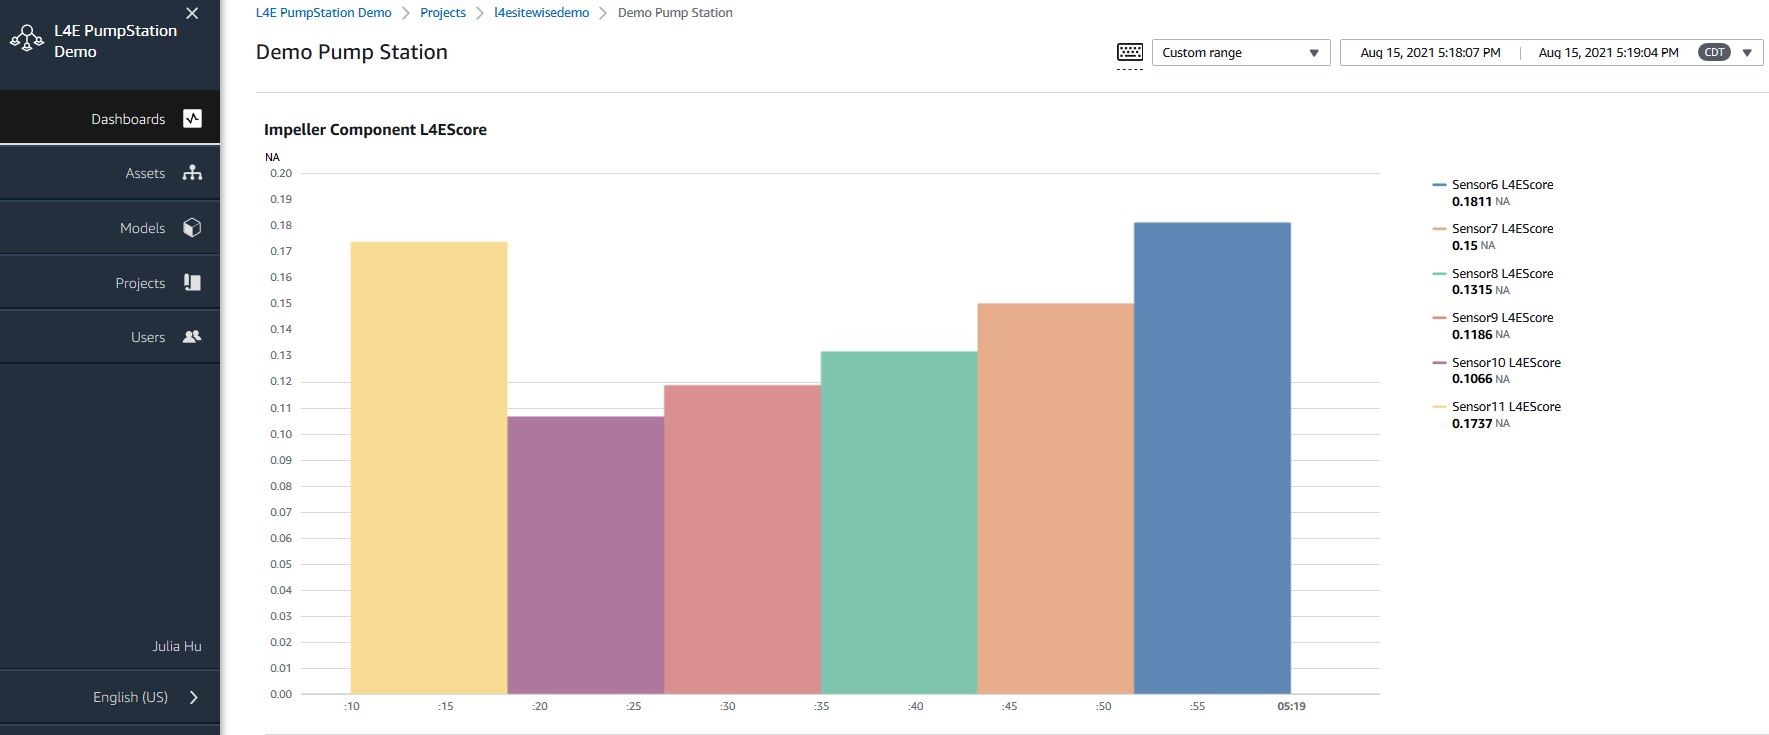
Figure 11: SensorX L4EScore for sensors within Impeller component
Finally, a detailed sensor signal comparison between Demo Pump Asset 1 and Demo Pump Asset 2 is performed. After inspecting the sensor signals within the past one day in Figure 12, it seems that Sensor 6 from Asset 1 shows a 30% higher amplitude compared with that from Asset 2. However, Sensor 0 from Asset 1 and Asset 2 show random signal patterns, but their amplitudes do not show a significant difference during the same time period. The close correlation between the Sensor 6 signal anomaly and l4eAlarm of Demo Pump Asset 1 indicates that the possible root cause for this alarm warning is due to sensors from the impeller component.
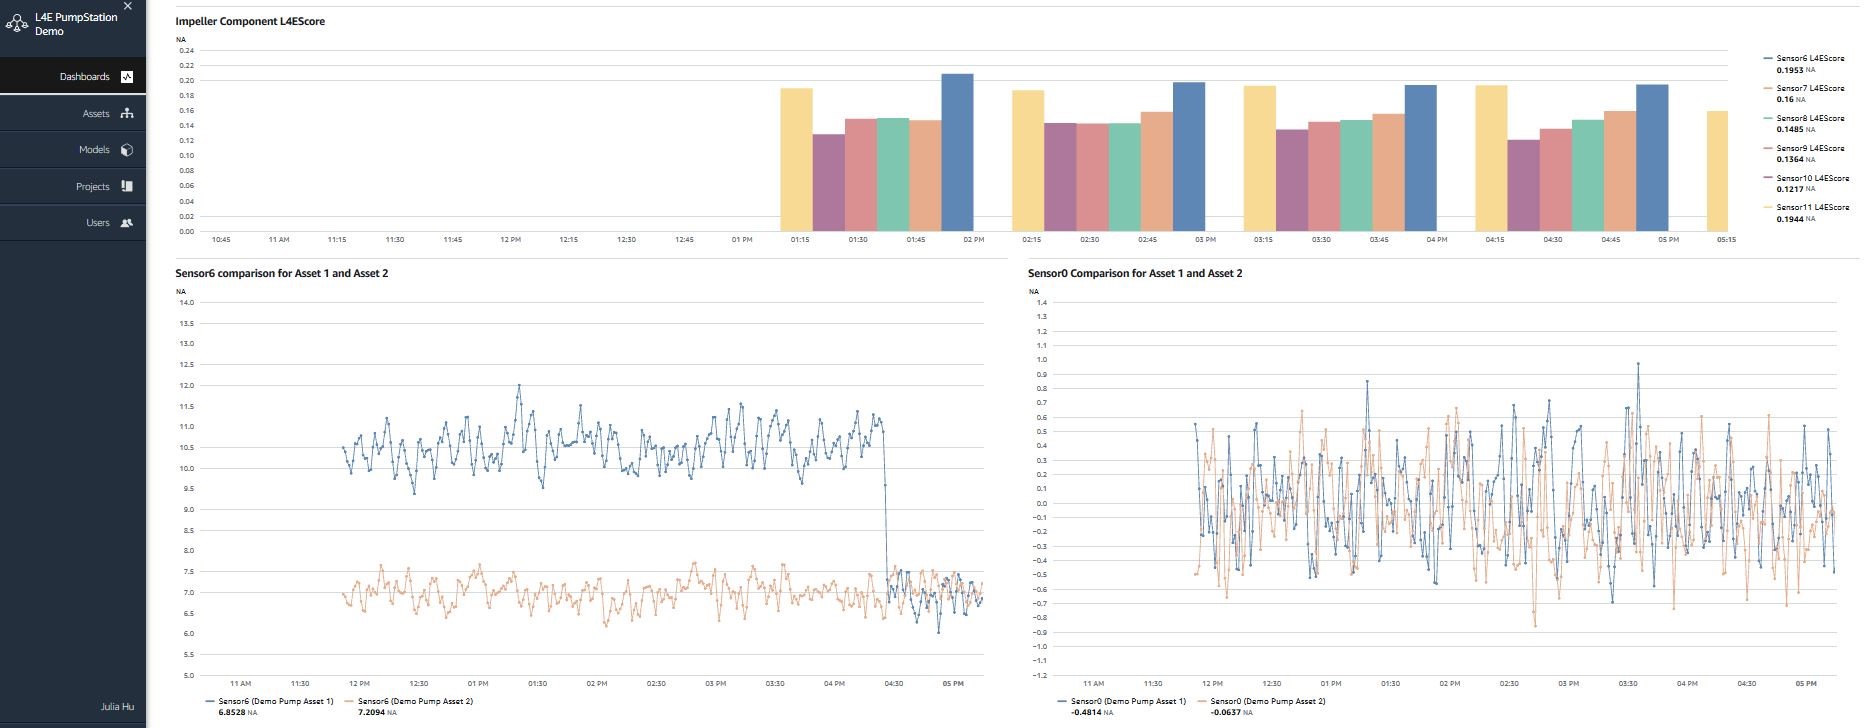
Figure 12: Sensor signal comparison between two pump assets
In summary, the processes of (1) monitoring multiple assets for alarms, and (2) diagnosing anomalies with particular sensors within a complex asset can be achieved with SiteWise Monitor. The advantage of adopting SiteWise Monitor is that the whole dashboard development does not require any web development or hosting efforts. The OT team can fully use their domain expertise to get insights quickly into their operational data, and can manage their assets with alarms when devices and equipment perform suboptimally. With the Amazon Lookout for Equipment multivariate ML model, the OT team can use component diagnostics scores from the AI service to find out root causes of underperforming assets.
Conclusion
In Part 2 of this two-part series, you trained ML models for pump assets, and evaluated the model with a historical dataset. You created an inference scheduler with Amazon Lookout for Equipment to monitor your assets nearly continuously with this applied AI service. Finally, the data pipeline you created in part 1 enables ML-driven asset performance monitoring to augment AWS IoT SiteWise functionality.
In this two-part series, we reviewed the benefits and challenges of deploying condition-based monitoring for industrial assets. To address such challenges, we proposed a solution using Amazon Lookout for Equipment and AWS IoT SiteWise. Both managed services allow the OT team to focus on business problems related to asset optimization and management. AWS IoT SiteWise and Lookout for Equipment are OT enablers that reduce dependency on IT and data science functions. The OT team can apply IoT and AI proactively to meet asset optimization goals. They can also forecast when and why assets will underperform, and take quick actions to prevent losses related with operational inefficiencies.
About the authors
 Julia Hu is a ML&IoT Architect with Amazon Web Services. She has extensive experience in IoT architecture and Applied Data Science, and is part of both the Machine Learning and IoT Technical Field Community. She works with customers, ranging from start-ups to enterprises, to develop AWSome IoT machine learning (ML) solutions, at the Edge and in the Cloud. She enjoys leveraging latest IoT technology to scale up her ML solution, reduce latency, and accelerate industry adoption. Julia Hu is a ML&IoT Architect with Amazon Web Services. She has extensive experience in IoT architecture and Applied Data Science, and is part of both the Machine Learning and IoT Technical Field Community. She works with customers, ranging from start-ups to enterprises, to develop AWSome IoT machine learning (ML) solutions, at the Edge and in the Cloud. She enjoys leveraging latest IoT technology to scale up her ML solution, reduce latency, and accelerate industry adoption. |
 Dastan Aitzhanov is a Specialist Solutions Architect in Applied AI with Amazon Web Services. He specializes in architecting and building scalable cloud-based platforms with an emphasis on machine learning, internet of things, and big data-driven applications. When not working, he enjoys going camping, skiing, and spending time in the great outdoors with his family. Dastan Aitzhanov is a Specialist Solutions Architect in Applied AI with Amazon Web Services. He specializes in architecting and building scalable cloud-based platforms with an emphasis on machine learning, internet of things, and big data-driven applications. When not working, he enjoys going camping, skiing, and spending time in the great outdoors with his family. |
 Michaël Hoarau is an AI/ML specialist solution architect at AWS who alternates between a data scientist and machine learning architect, depending on the moment. He is passionate about bringing the power of AI/ML to the shop floors of his industrial customers and has worked on a wide range of ML use cases, ranging from anomaly detection to predictive product quality or manufacturing optimization. When not helping customers develop the next best machine learning experiences, he enjoys observing the stars, traveling, or playing the piano Michaël Hoarau is an AI/ML specialist solution architect at AWS who alternates between a data scientist and machine learning architect, depending on the moment. He is passionate about bringing the power of AI/ML to the shop floors of his industrial customers and has worked on a wide range of ML use cases, ranging from anomaly detection to predictive product quality or manufacturing optimization. When not helping customers develop the next best machine learning experiences, he enjoys observing the stars, traveling, or playing the piano |
 Theodore Bakanas is a Machine Learning and IoT Architect working for AWS Proserve. He focuses on helping companies deploy Predictive Maintenance solutions in the Industrial IoT space. He especially enjoys projects that focus on time-series data and end-to-end architecture. In his free time he likes to travel and meet new people. Theodore Bakanas is a Machine Learning and IoT Architect working for AWS Proserve. He focuses on helping companies deploy Predictive Maintenance solutions in the Industrial IoT space. He especially enjoys projects that focus on time-series data and end-to-end architecture. In his free time he likes to travel and meet new people. |