Artificial Intelligence
Build an air quality anomaly detector using Amazon Lookout for Metrics
Today, air pollution is a familiar environmental issue that creates severe respiratory and heart conditions, which pose serious health threats. Acid rain, depletion of the ozone layer, and global warming are also adverse consequences of air pollution. There is a need for intelligent monitoring and automation in order to prevent severe health issues and in extreme cases life-threatening situations. Air quality is measured using the concentration of pollutants in the air. Identifying symptoms early and controlling the pollutant level before it’s dangerous is crucial. The process of identifying the air quality and the anomaly in the weight of pollutants, and quickly diagnosing the root cause, is difficult, costly, and error-prone.
The process of applying AI and machine learning (ML)-based solutions to find data anomalies involves a lot of complexity in ingesting, curating, and preparing data in the right format and then optimizing and maintaining the effectiveness of these ML models over long periods of time. This has been one of the barriers to quickly implementing and scaling the adoption of ML capabilities.
This post shows you how to use an integrated solution with Amazon Lookout for Metrics and Amazon Kinesis Data Firehose to break these barriers by quickly and easily ingesting streaming data, and subsequently detecting anomalies in the key performance indicators of your interest.
Lookout for Metrics automatically detects and diagnoses anomalies (outliers from the norm) in business and operational data. It’s a fully managed ML service that uses specialized ML models to detect anomalies based on the characteristics of your data. For example, trends and seasonality are two characteristics of time series metrics in which threshold-based anomaly detection doesn’t work. Trends are continuous variations (increases or decreases) in a metric’s value. On the other hand, seasonality is periodic patterns that occur in a system, usually rising above a baseline and then decreasing again. You don’t need ML experience to use Lookout for Metrics.
We demonstrate a common air quality monitoring scenario, in which we detect anomalies in the pollutant concentration in the air. By the end of this post, you’ll learn how to use these managed services from AWS to help prevent health issues and global warming. You can apply this solution to other use cases for better environment management, such as detecting anomalies in water quality, land quality, and power consumption patterns, to name a few.
Solution overview
The architecture consists of three functional blocks:
- Wireless sensors placed at strategic locations to sense the concentration level of carbon monoxide (CO), sulfur dioxide (SO2), and nitrogen dioxide(NO2) in the air
- Streaming data ingestion and storage
- Anomaly detection and notification
The solution provides a fully automated data path from the sensors all the way to a notification being raised to the user. You can also interact with the solution using the Lookout for Metrics UI in order to analyze the identified anomalies.
The following diagram illustrates our solution architecture.
Prerequisites
You need the following prerequisites before you can proceed with solution. For this post, we use the us-east-1 Region.
- Download the Python script (publish.py) and data file from the GitHub repo.
- Open the
live_data.csvfile in your preferred editor and replace the dates to be today’s and tomorrow’s date. For example, if today’s date is July 8, 2022, then replace2022-03-25with2022-07-08. Keep the format the same. This is required to simulate sensor data for the current date using the IoT simulator script. - Create an Amazon Simple Storage Service (Amazon S3) bucket and a folder named
air-quality. Create a subfolder insideair-qualitynamedhistorical. For instructions, see Creating a folder. - Upload the
live_data.csvfile in the root S3 bucket andhistorical_data.jsonin the historical folder. - Create an AWS Cloud9 development environment, which we use to run the Python simulator program to create sensor data for this solution.
Ingest and transform data using AWS IoT Core and Kinesis Data Firehose
We use a Kinesis Data Firehose delivery stream to ingest the streaming data from AWS IoT Core and deliver it to Amazon S3. Complete the following steps:
- On the Kinesis Data Firehose console, choose Create delivery stream.
- For Source, choose Direct PUT.
- For Destination, choose Amazon S3.
- For Delivery stream name, enter a name for your delivery stream.

- For S3 bucket, enter the bucket you created as a prerequisite.
- Enter values for S3 bucket prefix and S3 bucket error output prefix.One of the key points to note is the configuration of the custom prefix that is configured for the Amazon S3 destination. This prefix pattern makes sure that the data is created in the S3 bucket as per the prefix hierarchy expected by Lookout for Metrics. (More on this later in this post.) For more information about custom prefixes, see Custom Prefixes for Amazon S3 Objects.

- For Buffer interval, enter
60.

- Choose Create or update IAM role.
- Choose Create delivery stream.

Now we configure AWS IoT Core and run the air quality simulator program. - On the AWS IoT Core console, create an AWS IoT policy called admin.
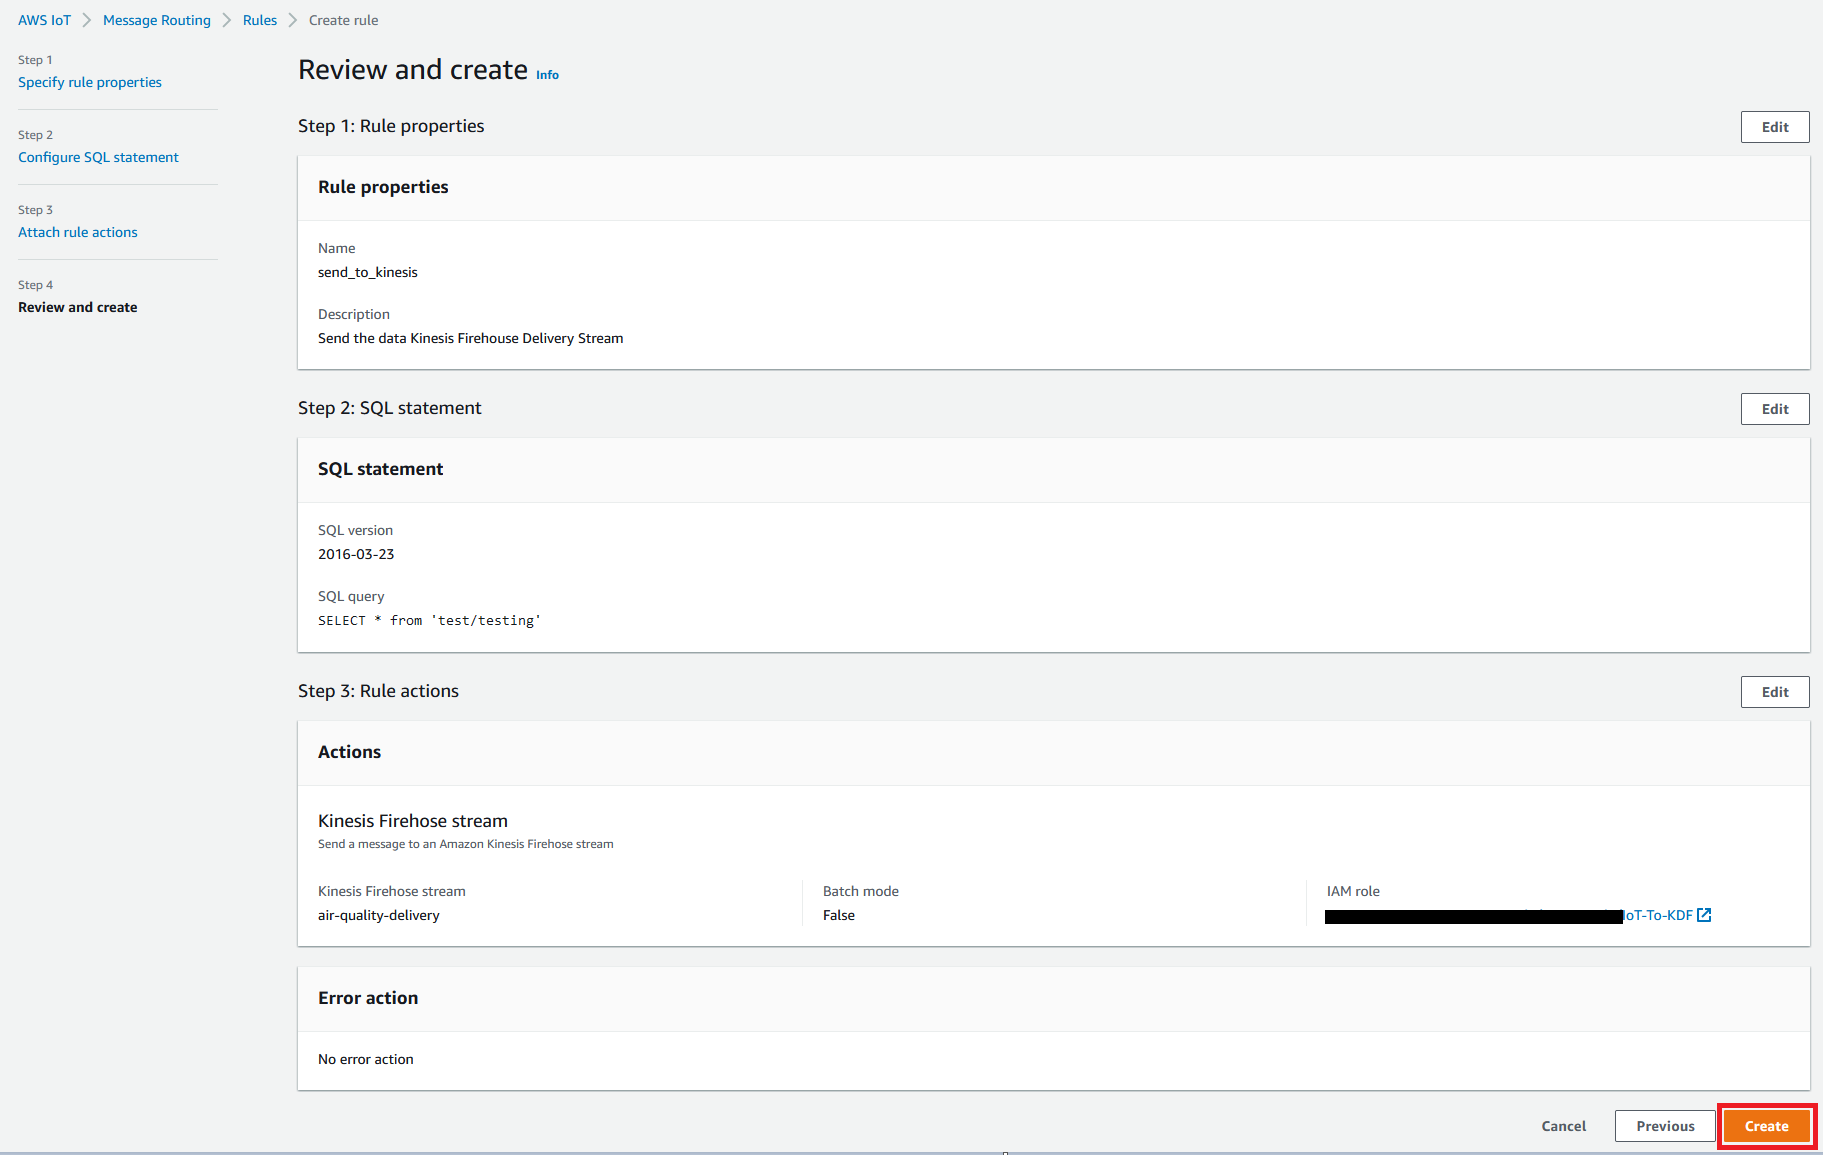
- In the navigation pane under Message Routing, choose Rules.
- Choose Create rule.
- Create a rule with the Kinesis Data Firehose(firehose) action.
This sends data from an MQTT message to a Kinesis Data Firehose delivery stream. - Choose Create.
- Create an AWS IoT thing with name
Test-Thingand attach the policy you created. - Download the certificate, public key, private key, device certificate, and root CA for AWS IoT Core.
- Save each of the downloaded files to the
certificatessubdirectory that you created earlier.

- Upload publish.py to the
iot-test-publishfolder. - On the AWS IoT Core console, in the navigation pane, choose Settings.
- Under Custom endpoint, copy the endpoint.
This AWS IoT Core custom endpoint URL is personal to your AWS account and Region. - Replace
customEndpointUrlwith your AWS IoT Core custom endpoint URL, certificates with the name of certificate, andYour_S3_Bucket_Namewith your S3 bucket name.
Next, you install pip and the AWS IoT SDK for Python. - Log in to AWS Cloud9 and create a working directory in your development environment. For example:
aq-iot-publish. - Create a subdirectory for certificates in your new working directory. For example:
certificates. - Install the AWS IoT SDK for Python v2 by running the following from the command line.
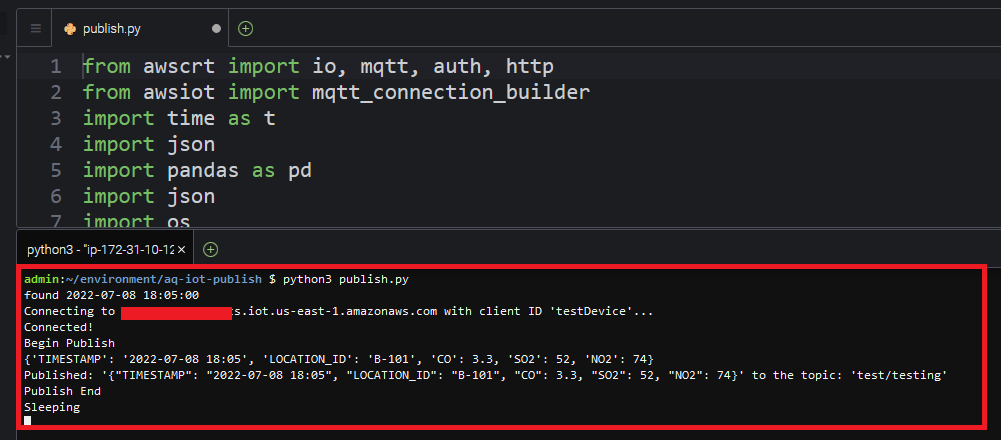
- To test the data pipeline, run the following command:
You can see the payload in the following screenshot.
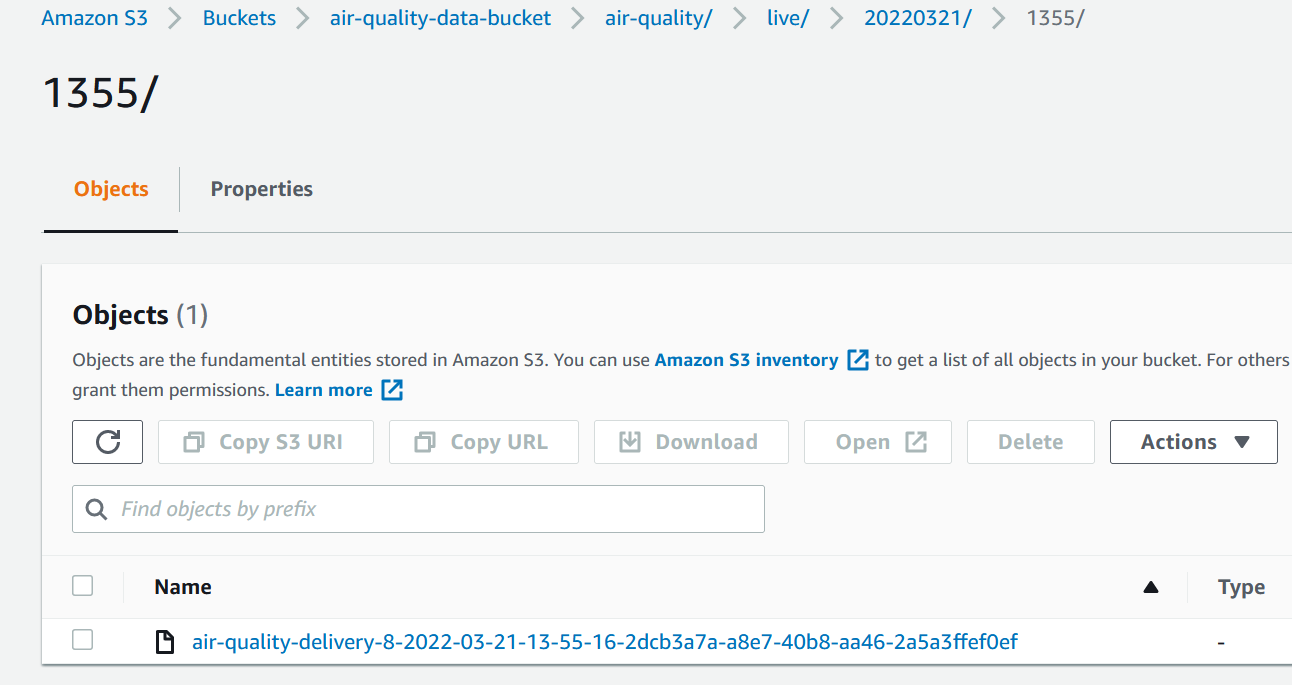
Finally, the data is delivered to the specified S3 bucket in the prefix structure.
The data of the files is as follows:
{"TIMESTAMP":"2022-03-20 00:00","LOCATION_ID":"B-101","CO":2.6,"SO2":62,"NO2":57}{"TIMESTAMP":"2022-03-20 00:05","LOCATION_ID":"B-101","CO":3.9,"SO2":60,"NO2":73}
The timestamps show that each file contains data for 5-minute intervals.
With minimal code, we have now ingested the sensor data, created an input stream from the ingested data, and stored the data in an S3 bucket based on the requirements for Lookout for Metrics.
In the following sections, we take a deeper look at the constructs within Lookout for Metrics, and how easy it is to configure these concepts using the Lookout for Metrics console.
Create a detector
A detector is a Lookout for Metrics resource that monitors a dataset and identifies anomalies at a predefined frequency. Detectors use ML to find patterns in data and distinguish between expected variations in data and legitimate anomalies. To improve its performance, a detector learns more about your data over time.
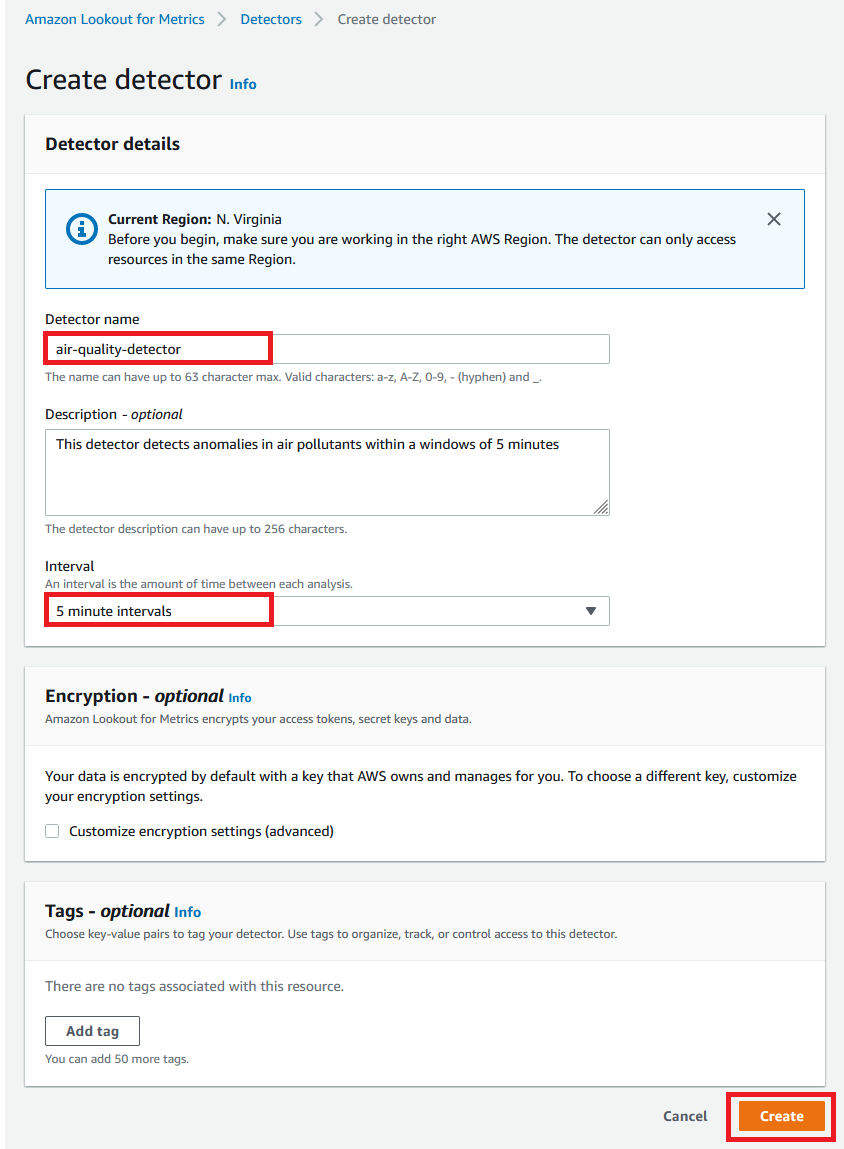
In our use case, the detector analyzes data from the sensor every 5 minutes.
To create the detector, navigate to the Lookout for Metrics console and choose Create detector. Provide the name and description (optional) for the detector, along with the interval of 5 minutes.
Your data is encrypted by default with a key that AWS owns and manages for you. You can also configure if you want to use a different encryption key from the one that is used by default.
Now let’s point this detector to the data that you want it to run anomaly detection on.
Create a dataset
A dataset tells the detector where to find your data and which metrics to analyze for anomalies. To create a dataset, complete the following steps:
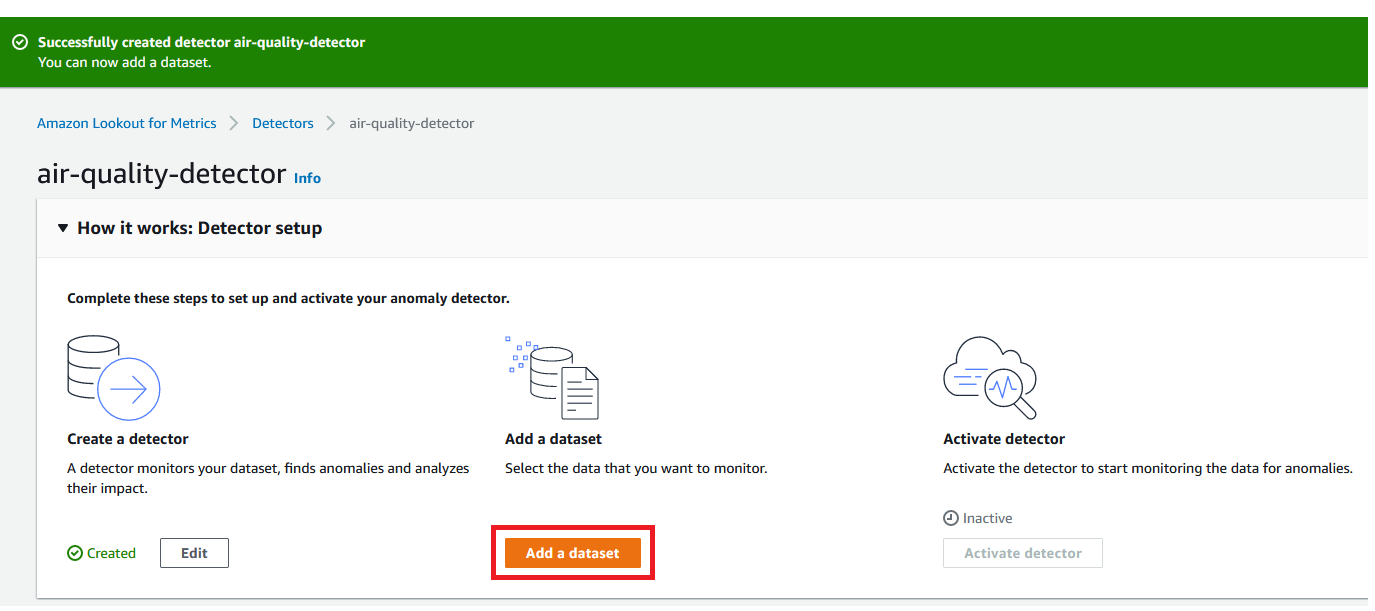
- On the Amazon Lookout for Metrics console, navigate to your detector.
- Choose Add a dataset.
- For Name, enter a name (for example,
air-quality-dataset). - For Datasource, choose your data source (for this post, Amazon S3).

- For Detector mode, select your mode (for this post, Continuous).
With Amazon S3, you can create a detector in two modes:
-
- Backtest – This mode is used to find anomalies in historical data. It needs all records to be consolidated in a single file.
- Continuous – This mode is used to detect anomalies in live data. We use this mode with our use case because we want to detect anomalies as we receive air pollutant data from the air monitoring sensor.
- Enter the S3 path for the live S3 folder and path pattern.
- For Datasource interval, choose 5 minute intervals.If you have historical data from which the detector can learn patterns, you can provide it during this configuration. The data is expected to be in the same format that you use to perform a backtest. Providing historical data speeds up the ML model training process. If this isn’t available, the continuous detector waits for sufficient data to be available before making inferences.
- For this post, we already have historical data, so select Use historical data.
- Enter the S3 path of
historical_data.json. - For File format, select JSON lines.

At this point, Lookout for Metrics accesses the data source and validates whether it can parse the data. If the parsing is successful, it gives you a “Validation successful” message and takes you to the next page, where you configure measures, dimensions, and timestamps.
Configure measures, dimensions, and timestamps
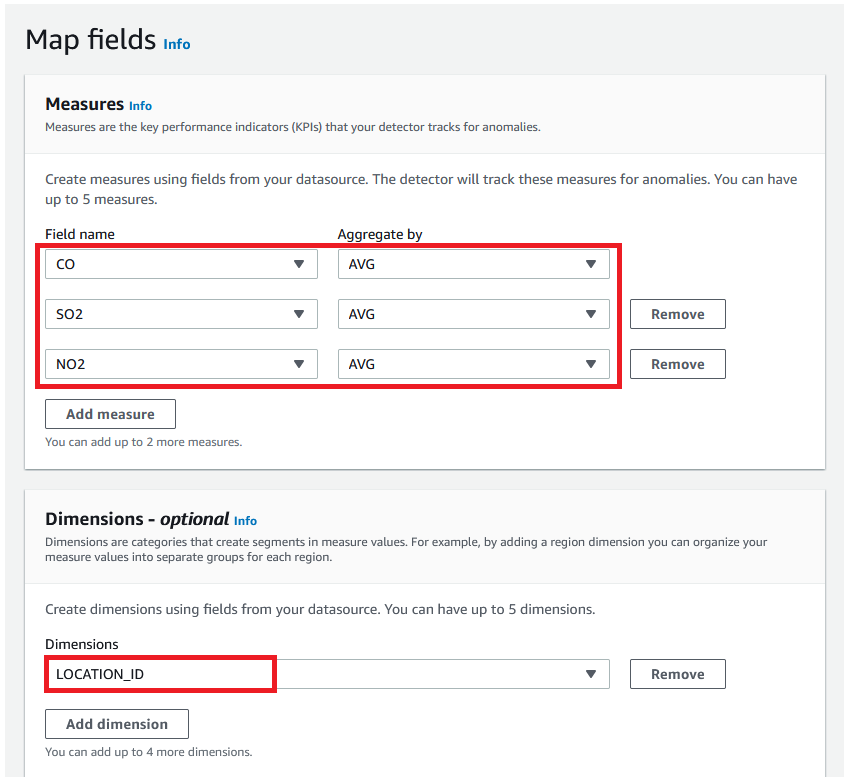
Measures define KPIs that you want to track anomalies for. You can add up to five measures per detector. The fields that are used to create KPIs from your source data must be of numeric format. The KPIs can be currently defined by aggregating records within the time interval by doing a SUM or AVERAGE.
Dimensions give you the ability to slice and dice your data by defining categories or segments. This allows you to track anomalies for a subset of the whole set of data for which a particular measure is applicable.
In our use case, we add three measures, which calculate the AVG of the objects seen in the 5-minute interval, and have only one dimension, for which pollutants concentration is measured.
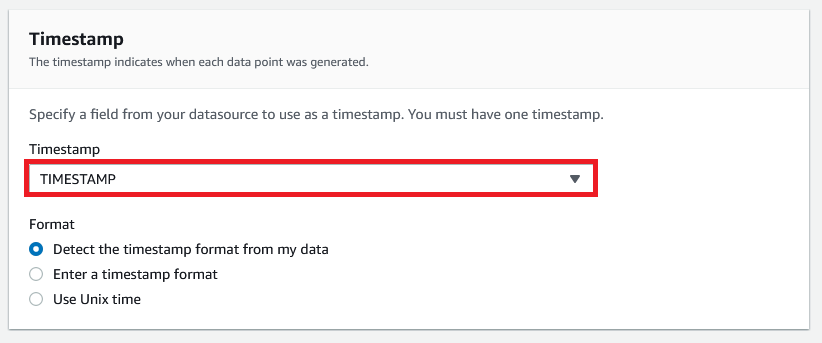
Every record in the dataset must have a timestamp. The following configuration allows you to choose the field that represents the timestamp value and also the format of the timestamp.
The next page allows you to review all the details you added and then save and activate the detector.
The detector then begins learning the data streaming into the data source. At this stage, the status of the detector changes to Initializing.
It’s important to note the minimum amount of data that is required before Lookout for Metrics can start detecting anomalies. For more information about requirements and limits, see Lookout for Metrics quotas.
With minimal configuration, you have created your detector, pointed it at a dataset, and defined the metrics that you want Lookout for Metrics to find anomalies in.
Visualize anomalies
Lookout for Metrics provides a rich UI experience for users who want to use the AWS Management Console to analyze the anomalies being detected. It also provides the capability to query the anomalies via APIs.
Let’s look at an example anomaly detected from our air quality data use case. The following screenshot shows an anomaly detected in CO concentration in the air at the designated time and date with a severity score of 93. It also shows the percentage contribution of the dimension towards the anomaly. In this case, 100% contribution comes from the location ID B-101 dimension.
Create alerts
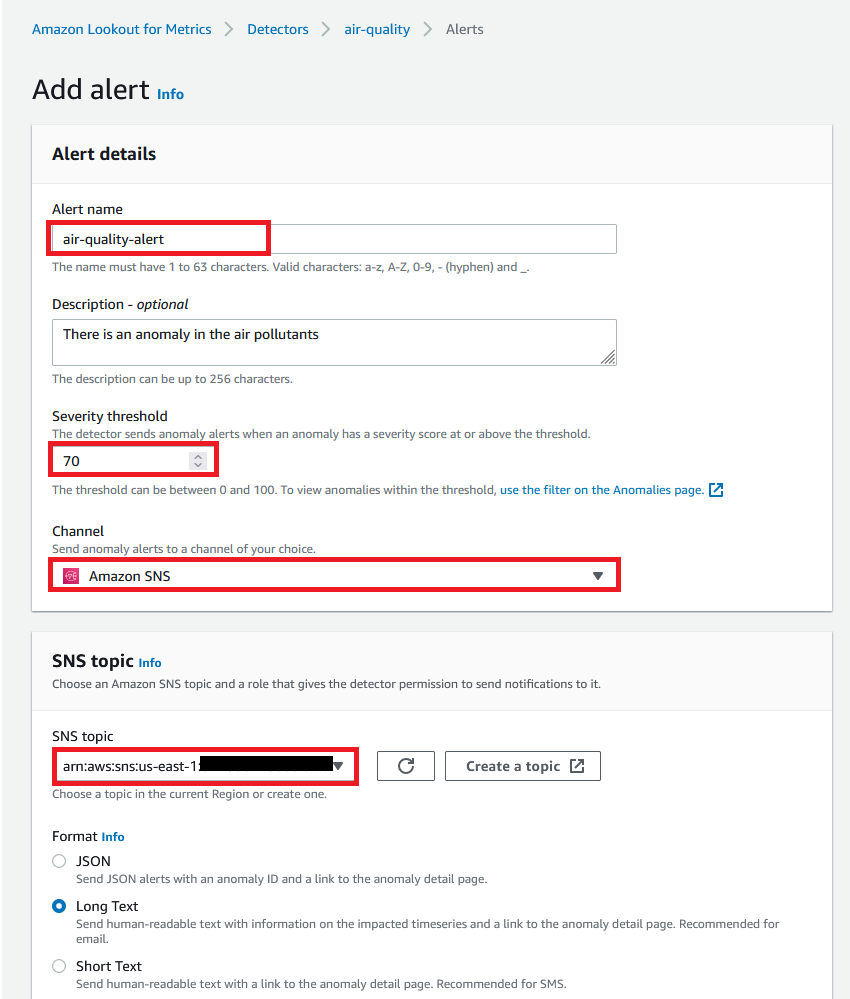
Lookout for Metrics allows you to send alerts using a variety of channels. You can configure the anomaly severity score threshold at which the alerts must be triggered.
In our use case, we configure alerts to be sent to an Amazon Simple Notification Service (Amazon SNS) channel, which in turn sends an SMS. The following screenshots show the configuration details.
You can also use an alert to trigger automations using AWS Lambda functions in order to drive API-driven operations on AWS IoT Core.
Conclusion
In this post, we showed you how easy to use Lookout for Metrics and Kinesis Data Firehose to remove the undifferentiated heavy lifting involved in managing the end-to-end lifecycle of building ML-powered anomaly detection applications. This solution can help you accelerate your ability to find anomalies in key business metrics and allow you focus your efforts on growing and improving your business.
We encourage you to learn more by visiting the Amazon Lookout for Metrics Developer Guide and try out the end-to-end solution enabled by these services with a dataset relevant to your business KPIs.
About the author
 Dhiraj Thakur is a Solutions Architect with Amazon Web Services. He works with AWS customers and partners to provide guidance on enterprise cloud adoption, migration, and strategy. He is passionate about technology and enjoys building and experimenting in the analytics and AI/ML space.

