AWS News Blog
Route 53 Improvements – Calculated Health Checks and Latency Checks
Amazon Route 53 is a highly available and scalable Domain Name System (DNS) web service. Route 53 connects user requests to infrastructure running in AWS (EC2 instances, load balancers, and S3 buckets), and can also be used to route users to infrastructure outside of AWS. You can configure Route 53 to perform periodic health checks, and to fail over to alternate endpoints should a check fail. You can also create a monitoring & alerting system for your websites and applications using the health checks.
Today we are adding two new types of health checks: calculated and latency measurement.
Calculated Health Checks
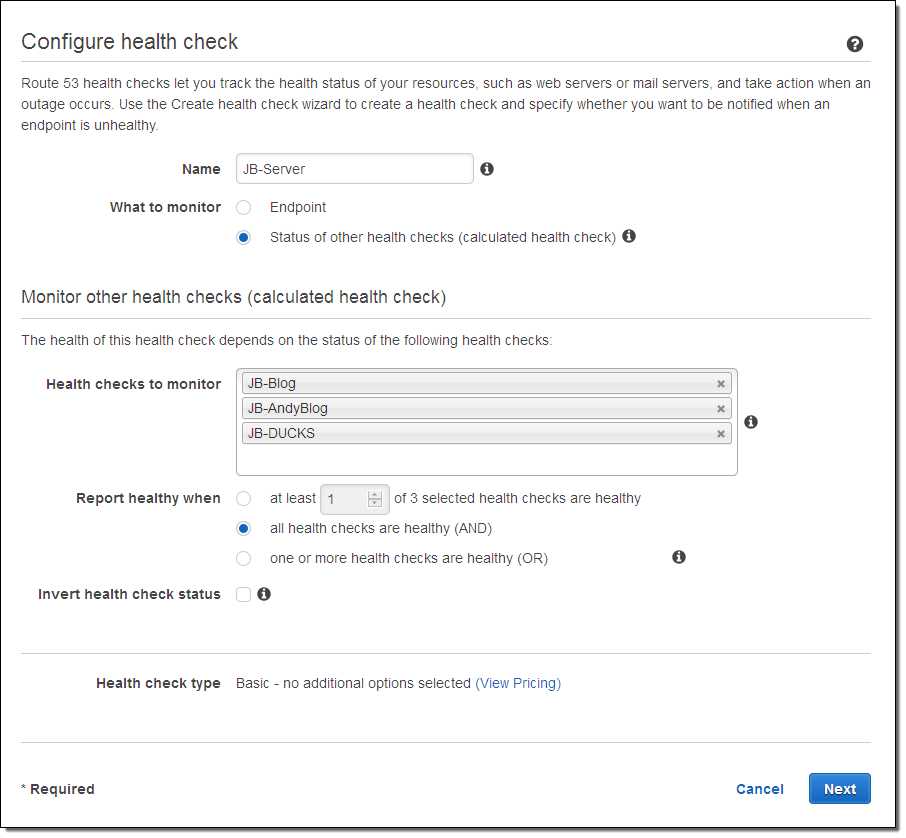
You can now combine the results of multiple Route 53 health checks into a single value using Boolean operations (AND, OR, and NOT). This allows you to create a single health check that combines the results of other checks in a useful way. For example, I have three web sites on the same EC2 instance. I’ll start by creating health checks for each one:

Next I’ll create a calculated health check that represents the overall health of the instance:

As you can see from the screen shot, I could also choose to create a health check that would report as healthy as long as a certain number (perhaps 2 out of 3) of the other health checks were also healthy. This would avoid false alarms and would allow me to take one site down for maintenance without causing this health check to fail.
While my example checked three different domains that happened to be running on the same instance, this is not a constraint. You could check multiple website components that happened to be on the same domain but managed by different administrative groups within your organization. Or, you could check multiple domains that supply web services to your app, and then roll up the results into a single check that represents the state of your dependencies.
Latency Measurement Health Checks
You can also configure Route 53 to measure and report on metrics that affect latency: TCP connection time, time to first byte, and (for SSL connections) the time to complete the SSL handshake. The first one indicates how long it takes Route 53 to establish a connection to the endpoint; the second one indicates the overall time until the first byte of data is returned. The third measures the time it takes to set up an SSL connection, an operation which involves 2 round-trips.
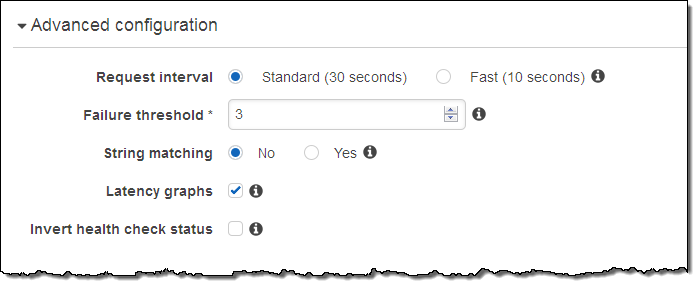
The latency measurement is performed as a part of the health check, and (if you check on Latency graphs) reported to CloudWatch.
Here’s how you configure latency measurement when you are setting up a health check:

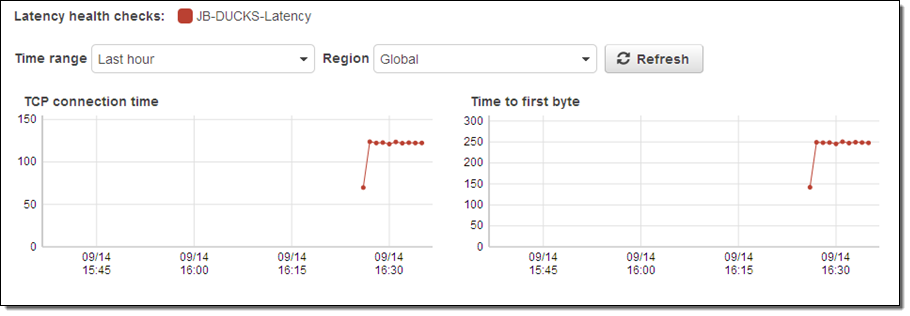
The results are visible in the Console:

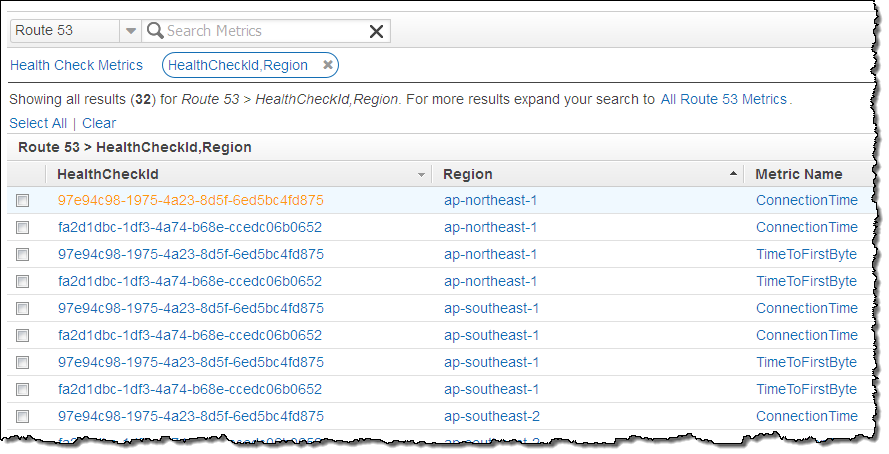
You can view the results with respect a single AWS region by selecting it from menu (a blended result is shown by default). You can also see the individual metrics (currently 32 per endpoint) in the CloudWatch console:

Available Now
The new health checks are available now and you can start using them today. Take a look at the Route 53 Pricing page to learn more about pricing for health checks.
— Jeff;