AWS News Blog
Additional CloudWatch Metrics for Amazon SQS and Amazon SNS
 I spent yesterday morning working in a coffee shop while waiting to have an informal discussion with a candidate for an open position. From my vantage point in the corner I was able to watch the shop’s “processing pipeline” in action. There were three queues and three types of processing!
The customers were waiting to place an order, waiting to pay, or waiting for their coffee.
The employees functioned as order takers, cashiers, or baristas.
It was fascinating to watch this dynamically scaled system in action. Traffic ebbed and flowed over the course of the three hours that I spent in my cozy little corner. The line of people waiting to place an order grew from one person to twenty people in just a few minutes. When things got busy, the order taker advanced through the line, taking orders so that the barista(s) could get a head start. The number of baristas varied from one to three. I’m not sure what was happening behind the scenes, but it was clear that they could scale up, scale down, and reallocate processing resources (employees) in response to changing conditions.
You could implement a system like this using the Amazon Simple Queue Service. However, until now, there was no way to scale the amount of processing power up and down as the number of items in the queue varied.
We’ve added some additional Amazon CloudWatch metrics to make it easier to handle this particular case. The following metrics are now available for each SQS queue (all at 5 minute intervals):
- NumberOfMessagesSent
- SentMessageSize
- NumberOfMessagesReceived
- NumberOfEmptyReceives
- NumberOfMessagesDeleted
- ApproximateNumberOfMessagesVisible
- ApproximateNumberOfMessagesNotVisible
We have also added the following metrics for each Amazon SNS topic, also at 5 minute intervals:
- NumberOfMessagesPublished
- NumberOfNotificationsDelivered
- NumberOfNotificationsFailed
- PublishSize
You can create alarms on any of these metrics using the AWS Management Console and you can use them to drive Auto Scaling actions. You can scale up when ApproximateNumberOfMessagesVisible starts to grow too large for one of your SQS queues, and scale down once it returns to a more reasonable value. You can also watch NumberOfEmptyReceives to make sure that your application isn’t spending too much of its time polling for new messages. A rapid increase in the value of ApproximateNumberOfMessagesNotVisible could indicate possible bug in your code. Depending on your application, you could also watch NumberOfMessagesSent (SQS) or NumberOfMessagesPublished (SNS) to make sure that the application is still healthy. Here is how all of the pieces (An SQS queue, its metrics, CloudWatch, Auto Scaling, and so forth) fit together:
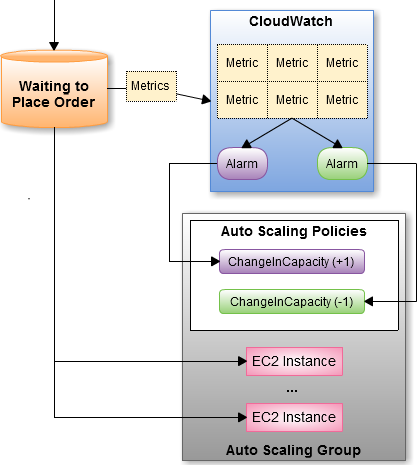
You can read more about these features in the newest version of the CloudWatch Developer Guide.
— Jeff;