AWS Cloud Financial Management
Launch: Usage-Based Forecasting now Available in AWS Cost Explorer
Forecasting is an essential part of staying on top of your cloud costs and usage, and becomes even more important as your business scales. AWS Cost Explorer now gives you the ability to create custom usage forecasts to gain a line of sight into your expected future costs. Learn more about getting started with AWS Cost Explorer here.
Usage forecasting uses a machine learning algorithm that learns your usage trends and uses that information to provide a forecast of your future use needs. Using these forecasts, you can better understand your expected cost trends. You can even define usage budgets (using AWS Budgets) to monitor your key usage patterns (for example, storage, data transfer, or running hours).
In this post, I walk you through the process of creating custom usage forecasts in Cost Explorer. This functionality is also available through the Cost Explorer API.
Example 1: Building a monthly Amazon EC2 running hours cost and usage forecast
To test the new forecasting capabilities, I show you how to forecast your EC2 running hours for the next three months. This can be especially helpful if you are considering Reserved Instances to cover your future compute needs. If you do not use EC2, you can follow this process for other services.
In the AWS Cost Management console, in the left navigation pane, choose the magnifying glass icon for Cost Explorer, and then choose Cost & Usage.
The menu on the right side of the screen lets you filter by the Usage Type or Usage Type Group value used for your forecast. In this case, choose Usage Type Group and filter by EC2: Running Hours. With this filter selected, you should now see a time series of your Cost ($) and Usage (Hrs) trends.

This shows the historical cost and usage data. To create a forecast, in the top left of the dashboard, modify the duration value. In this example, I select +3M to include a forecast for the next three months. The following image provides an example of the forecast.
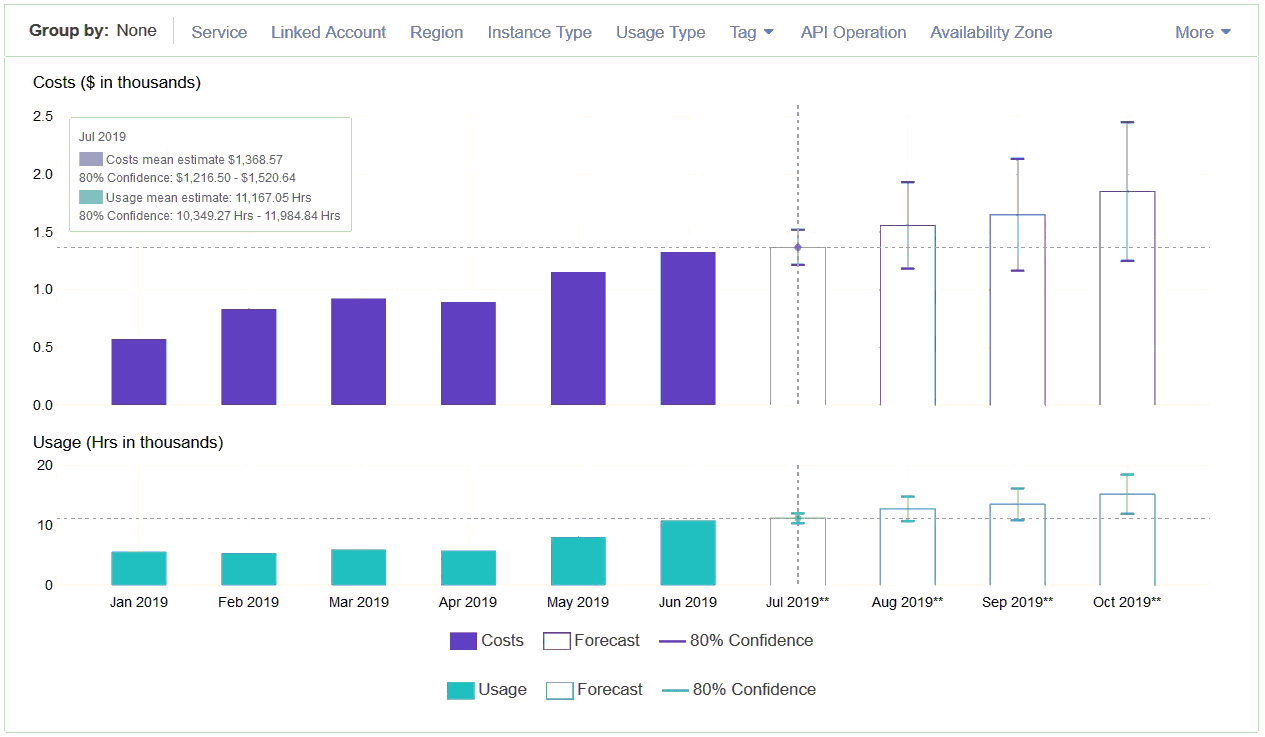
This example shows a monthly level total. You can adjust the specificity down to single days with the options on the front end and API. The Cost Explorer web application defaults to highlighting an 80% confidence window. You can install forecasts with custom confidence bands using the AWS Cost Explorer API.
Example 2: Building a daily EC2 Running Hours cost and usage forecast
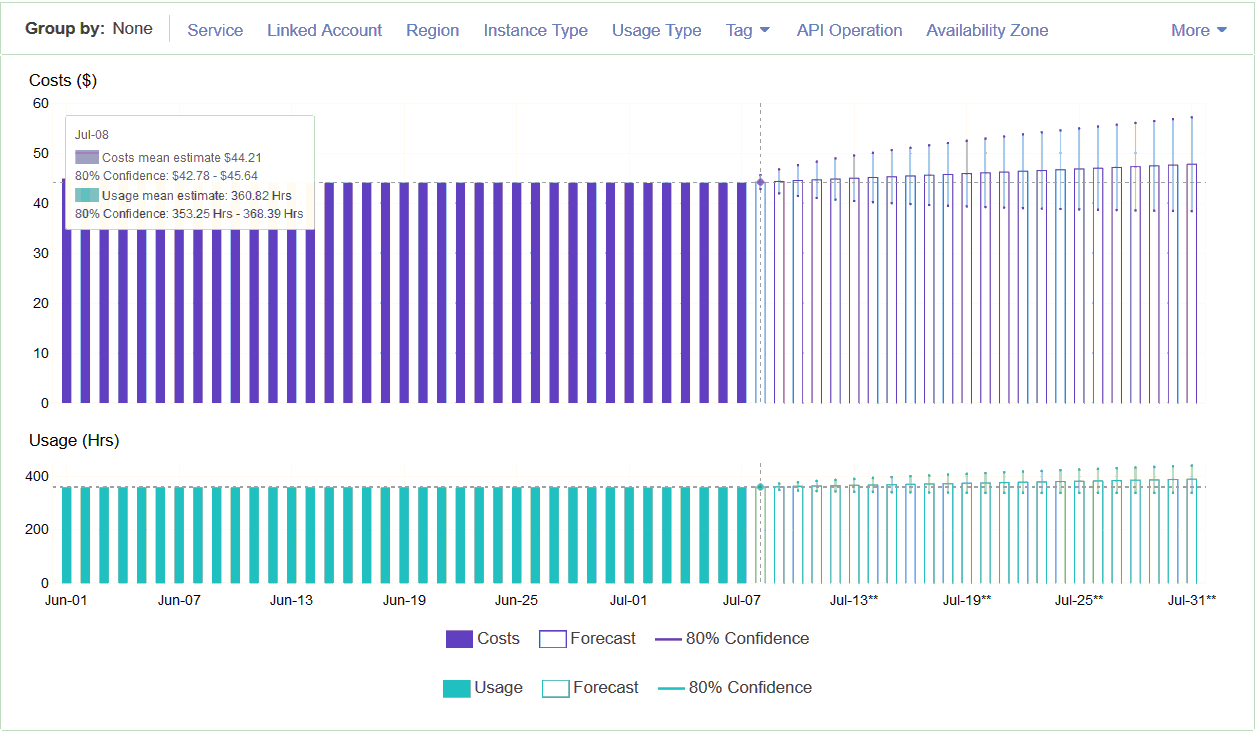
Building on the above example, I will walk you through creating a Running Hours cost and usage forecast at the Daily level of granularity. In this case, I will limit the time period to a more narrow range by indicating that I would like to see data for the current month (1M) and use your historical usage information to forecast forward through the current month (EOM).

AWS stores historical cost and usage for 12 months in the past and supports forecasting at the daily level for up to 3 months in the future.
Conclusion
This feature launch empowers you to understand your daily or monthly usage forecasts. You can use this information to dive deeper into your cost and usage information, as well as generate more precise budgets. To learn more about these new forecasting capacities, see the What’s New post and the AWS Cost Explorer webpage.