AWS News Blog
New — Create and Share Operational Reports at Scale with Amazon QuickSight Paginated Reports

|
There are various ways to report on data insights, and paginated reports is one of them. Paginated reports are essential documents that contain critical business information for end-users. For decades, paginated reports have been the standard business reporting format. The following are examples of paginated reports. On the left shows the report for income statement and on the right is the yearly summary corporate statement:
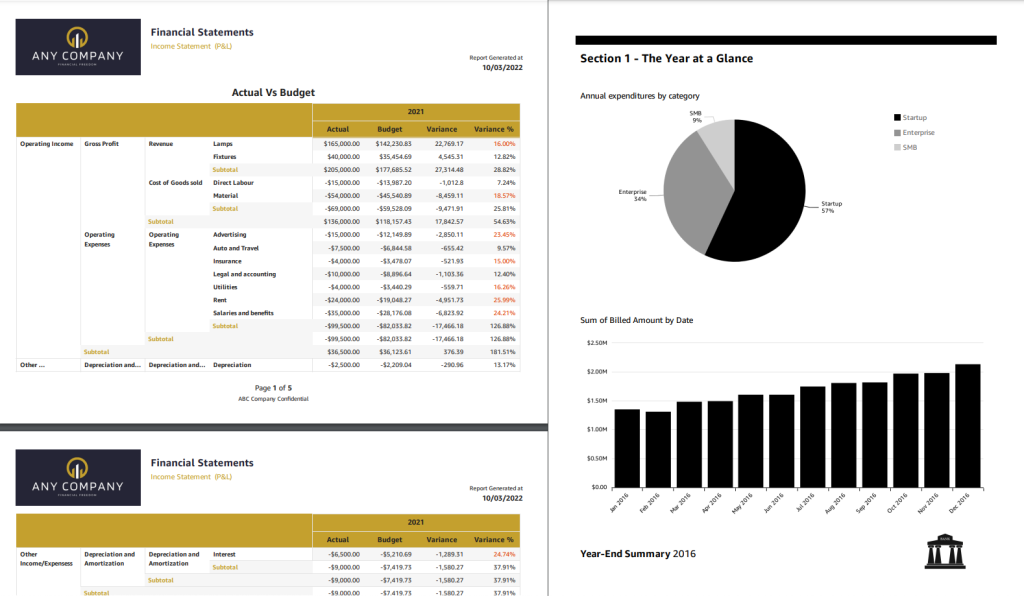
As the example shows, paginated reports contain various highly formatted insights and are designed to be printable, in landscape or portrait orientation, so they can be consumed easily by readers. It’s called paginated because it often spans tens of hundreds of pages of data.
Although it may appear to be a simple task, generating paginated reports is heavily dependent on legacy data warehouses and legacy business intelligence tools, especially because modern business intelligence tools do not offer this capability. As a result, organizations typically have to maintain multiple business intelligence systems to have separate solutions for building critical operational reports and summarized dashboards. Each solution presents its set of challenges with data governance, security, and access management. This caused a disjointed experience for both authors and end users. Legacy BI systems also run on-premises infrastructure, which is expensive to maintain and upgrade.
Introducing Amazon QuickSight Paginated Reports
Today, I’m pleased to announce Amazon QuickSight Paginated Reports. This feature allows customers to create and share highly formatted, personalized reports containing business-critical data to hundreds of thousands of end-users without any infrastructure setup or maintenance, up-front licensing, or long-term commitments.
Here’s a quick look on how Amazon QuickSight Paginated Reports works:
With Amazon QuickSight Paginated Reports, customers can now create and share paginated reports to their users from the same familiar QuickSight interface that they use to create and consume interactive dashboards. They can use one single BI service to create and deliver interactive analytics in dashboards, format reports with paginated reports, or embed analytics in apps while also allowing end users to ask questions of the underlying data using machine learning (ML) powered natural language query with QuickSight Q. From ML powered interactive dashboard to generating and distributing operational reports, these benefits impact different stakeholder groups in an organization
For Readers – Amazon QuickSight Paginated Reports makes it easy for readers to consume reports in a familiar and scheduled fashion, in highly formatted models in .pdf or .csv formats. Readers can access these reports via email, Amazon QuickSight web and mobile interfaces, mobile applications, or embedded portals.
For Authors – This feature gives report authors the flexibility to create highly formatted reports with images, texts, charts, tables, and exact page sizes. They can create reports from the same data models as dashboards, reusing data models built up, using access permissions (RLS/CLS) setup, and publishing in the same dashboards where their users look for data. These dashboards are also available via API, allowing migration between accounts or programmatic creation and migration of these assets as needed.
The Amazon QuickSight Paginated Reports makes it easy to build reports without the need for separate training or investment in a dedicated application. With an easy-to-use web-based authoring interface, this feature allows report authors to create complex data models in the form of operational reports for hundreds of thousands of report readers and enables data-driven decision-making.
For IT Leaders – This feature also provides IT leaders with benefits such as fully managed reporting capabilities consolidated within Amazon QuickSight. This reduces the time and resources required to set up and maintain reporting solutions, helping IT leaders to start looking at the cloud for their BI needs and transitioning legacy reporting to the cloud to save time and resources.
Amazon QuickSight Paginated Reports also leverages existing QuickSight capabilities, such as user management, data preparation, advanced scheduling and audit logging. By inheriting the capabilities from QuickSight, it removes the need to manage any infrastructure or provisioning setup to deliver reports to hundreds of thousands of users.
Get Started with Amazon QuickSight Paginated Reports
Let’s see how to get started with Amazon QuickSight Paginated Reports. I will focus more on how authors can create, publish and deliver reports to readers.
For Authors: Creating a Report
First, I open the QuickSight console. Then, in the navigation section, I select the dataset that I will use for reporting purposes.

After I check and confirm the dataset, I select Use in Analysis.

On the next page, I have the option to select the sheet type, Interactive sheet, or Paginated report. I select Paginated report, and here I can configure the report for Paper size and either Portrait or Landscape orientation.

Now I’m starting my report creation. The sheet area I can use is adjusted to the paper size option I defined in the previous step. In this reporting sheet, QuickSight provides me with Header and Footer areas.

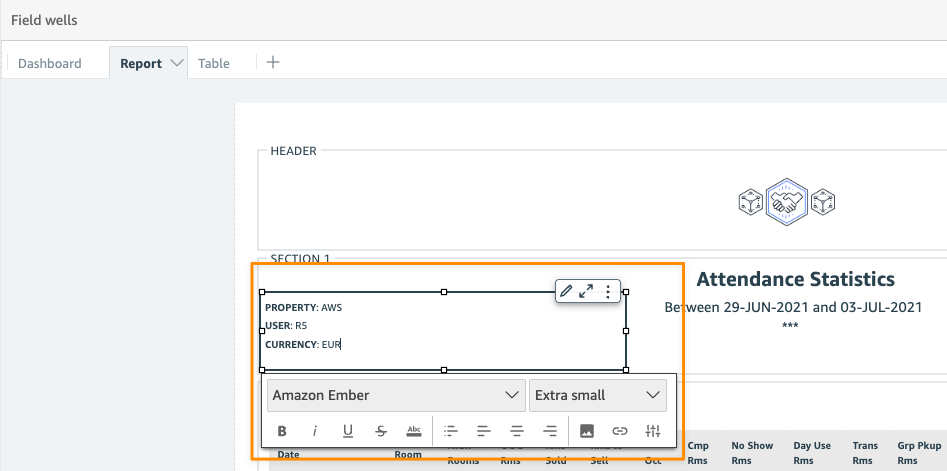
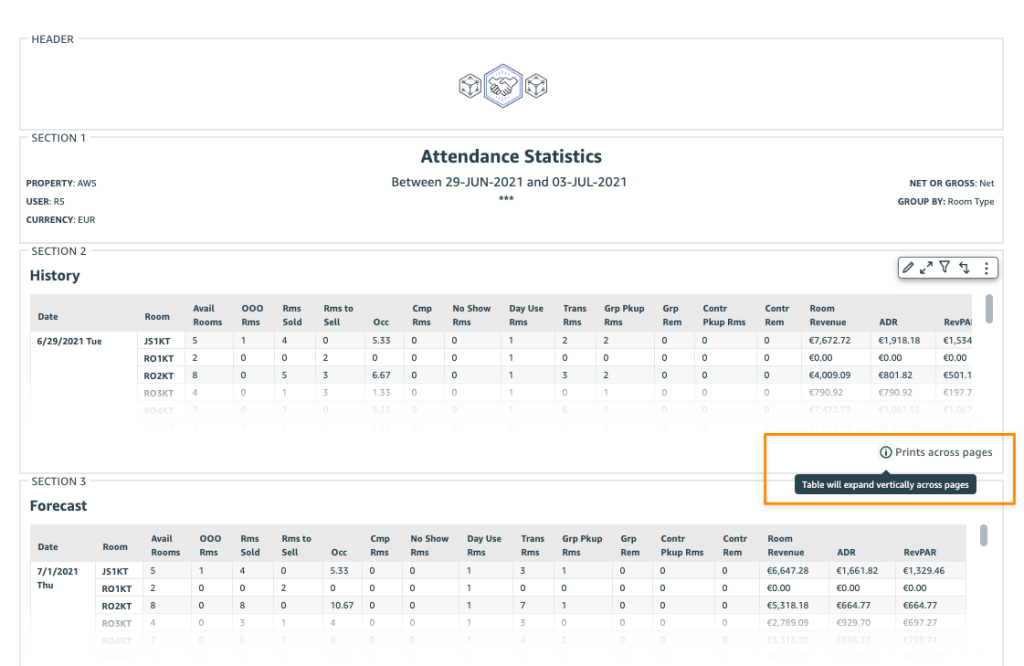
First, I want to add the title of this report in the header section. I select the Header area, and in the menu section, I select Add text.

Now, I can start entering the title of the report. I name this report “Attendance Statistics” and customize the header using the company logo. I can also use the text toolbar to format the text and add page numbers. For any changes I’ve made, I can also see the preview directly on this page.
I can also add other visuals in any section by selecting Add visual.

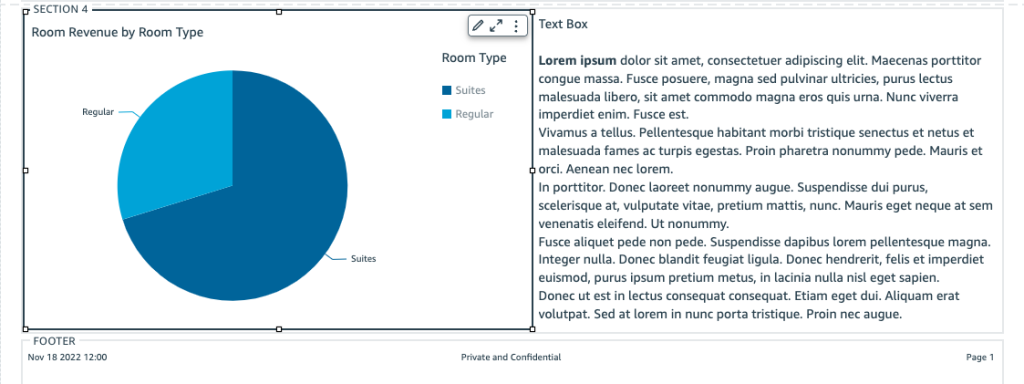
From here, I can start building reports with the available visuals, just like I normally do on the Amazon QuickSight dashboard. For example, if I need to add a summary to the pie chart, I can add another text box and drag and drop to set the layout and resize the visuals as needed.
If I need to add another section, from the menu, I select Add section, and I can add other visuals or insights into this new section. As for visual tabular data, the visual will be generated across pages.
For Author: Publish and Schedule Report
Once the analysis is completed, I need to publish this analysis as a dashboard by selecting Share and then Publish dashboard. Then I can choose to create a new dashboard by selecting Publish new dashboard or Replace an existing dashboard. I can also select the sheet(s) I want to publish.

At this stage, I’m ready to set a schedule to deliver my reports to readers. To do that, I need to open the dashboard and define a schedule by selecting Add schedule.

In this menu, I can specify the schedule name and also the content format. In the Content section, I can choose either PDF or CSV format. For PDF format, I can select the sheet I want to use. For CSV format, I can select multiple visuals.

As for the delivery report schedule, I can define the schedule as Daily, Weekly, Monthly, or one-time delivery with Do not repeat. I can also specify the date and time of delivery, including the time zone.

Then, I specify the configuration of the email message. In the final section, I can also specify how readers access this report, by using Download link or File attachment. Once I’m done setting up the schedule, I can Save it or send this report according to the schedule by selecting Save and run now.

For Readers: Receiving and Accessing Reports
Here is an example email from the schedule that QuickSight has sent to me as a reader. I can download this report from the email attachment or from the dashboard.

I can also use the provided link in the email to view recent snapshots. The Recent Snapshots feature allows me to review previously generated reports.
Things to Know
Programmatic API Access – In addition to using the Amazon QuickSight console, customers can also use the AWS API and SDK to interact programmatically with Amazon QuickSight Paginated Reports.
AWS Partners – To make it easier for customers to migrate their legacy BI solutions to Amazon QuickSight, customers can work with AWS partners, Ironside Consulting and Data Terrain. Ironside and Data Terrain offerings are available in the AWS Marketplace, with more details at Amazon QuickSight Partners page.
Availability and Pricing – Amazon QuickSight Paginated Reports is available as an add-on to the existing Amazon QuickSight Enterprise or Enterprise enabled with Q in all supported AWS Regions.
Visit the Amazon QuickSight Paginated Reports page to learn more details on how to use this feature, learn how to get started, and understand the pricing.
Happy building!
— Donnie