AWS News Blog
Route 53 Health Checks, DNS Failover, and CloudWatch
Earlier this year we introduced a new DNS failover feature for Amazon Route 53. If you enable this feature and create one or more health checks, Route 53 will periodically run the checks and switch to a secondary address (possibly a static website hosted on Amazon S3) if several consecutive checks fail.
Today we are extending that feature by publishing the results of each health check to Amazon CloudWatch.
Like all metrics stored in CloudWatch, you can view them from the AWS Management Console, set alarms, and fire notifications. Here’s how to use the console:
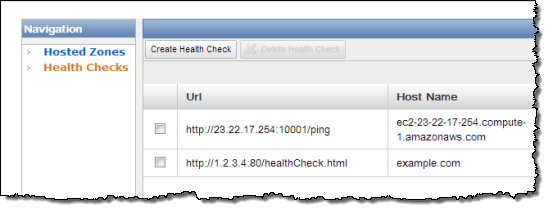
Navigate to the Route 53 console and click Health Checks in the left hand nav to view your health checks:

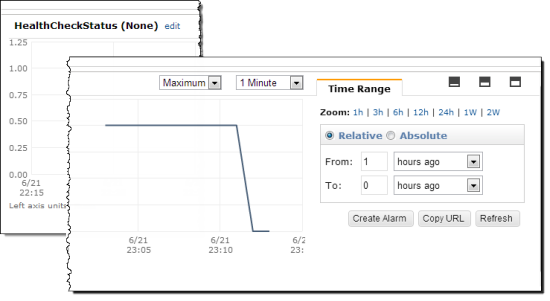
Click View Graph next to your health check. This takes you to the CloudWatch console. Note that for newly created health checks, it takes about five minutes for metrics to start appearing in CloudWatch:

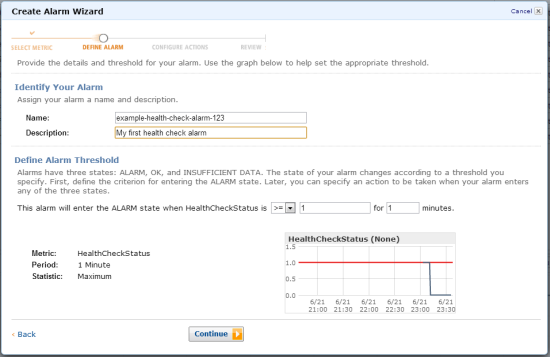
From here, you can create an alarm just like for any other CloudWatch metric, and you can use the alarm to trigger SNS notifications (for example, to send an email to yourself) if your endpoint goes down:

You can use Route 53’s DNS failover and health checking features in conjunction with CloudWatch to monitor the status and health of your website and to build systems that are highly available and fault-tolerant. If this is of interest to you, please sign up for the Route 53 Webinar on July 9th to learn more about DNS failover and the high-availability architecture options that it enables.
To get started with DNS failover for Route 53, visit the Route 53 page or follow the walkthrough in the Route 53 Developer Guide.
— Jeff;