AWS Compute Blog
Integrating AWS X-Ray with AWS App Mesh
This post is contributed by Lulu Zhao | Software Development Engineer II, AWS
AWS X-Ray helps developers and DevOps engineers quickly understand how an application and its underlying services are performing. When it’s integrated with AWS App Mesh, the combination makes for a powerful analytical tool.
X-Ray helps to identify and troubleshoot the root causes of errors and performance issues. It’s capable of analyzing and debugging distributed applications, including those based on a microservices architecture. It offers insights into the impact and reach of errors and performance problems.
In this post, I demonstrate how to integrate it with App Mesh.
Overview
App Mesh is a service mesh based on the Envoy proxy that makes it easy to monitor and control microservices. App Mesh standardizes how your microservices communicate, giving you end-to-end visibility and helping to ensure high application availability.
With App Mesh, it’s easy to maintain consistent visibility and network traffic control for services built across multiple types of compute infrastructure. App Mesh configures each service to export monitoring data and implements consistent communications control logic across your application.
A service mesh is like a communication layer for microservices. All communication between services happens through the mesh. Customers use App Mesh to configure a service mesh that contains virtual services, virtual nodes, virtual routes, and corresponding routes.
However, it’s challenging to visualize the way that request traffic flows through the service mesh while attempting to identify latency and other types of performance issues. This is particularly true as the number of microservices increases.
It’s in exactly this area where X-Ray excels. To show a detailed workflow inside a service mesh, I implemented a tracing extension called X-Ray tracer inside Envoy. With it, I ensure that I’m tracing all inbound and outbound calls that are routed through Envoy.
Traffic routing with color app
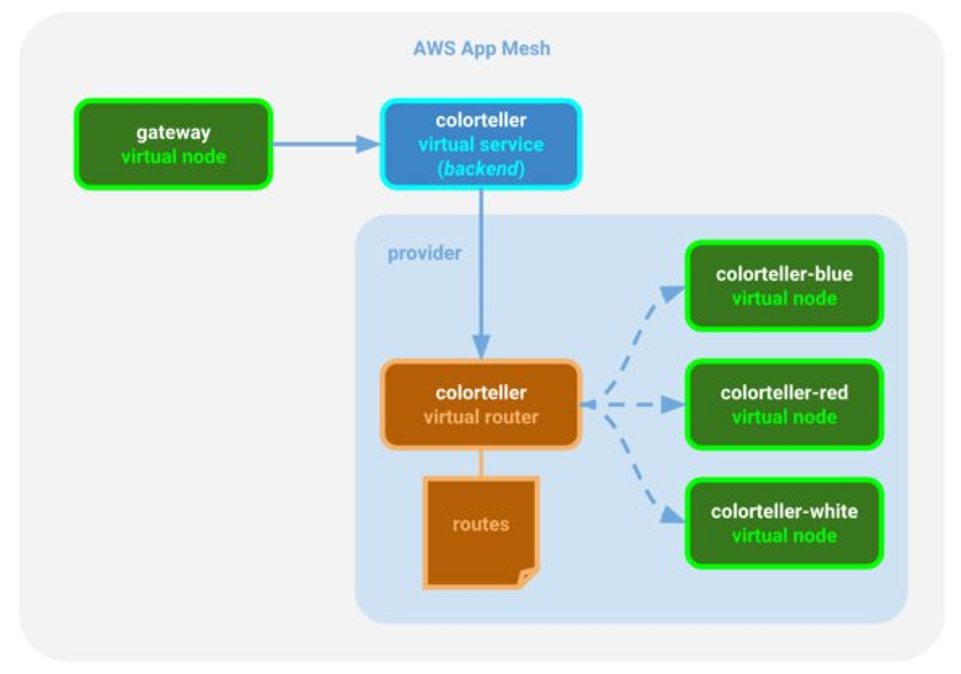
The following example shows how X-Ray works with App Mesh. I used the Color App, a simple demo application, to showcase traffic routing.
This app has two Go applications that are included in the AWS X-Ray Go SDK: color-gateway and color-teller. The color-gateway application is exposed to external clients and responds to http://service-name:port/color, which retrieves color from color-teller. I deployed color-app using Amazon ECS. This image illustrates how color-gateway routes traffic into a virtual router and then into separate nodes using color-teller.
The following image shows client interactions with App Mesh in an X-Ray service map after requests have been made to the color-gateway and to color-teller.

Integration
There are two types of service nodes:
- AWS::AppMesh::Proxy is generated by the X-Ray tracing extension inside Envoy.
- AWS::ECS::Container is generated by the AWS X-Ray Go SDK.
The service graph arrows show the request workflow, which you may find helpful as you try to understand the relationships between services.
To send Envoy-generated segments into X-Ray, install the X-Ray daemon. The following code example shows the ECS task definition used to install the daemon into the container.
After the Color app successfully launched, I made a request to color-gateway to fetch a color.
- First, the Envoy proxy
appmesh/colorgateway-vnin front ofdefault-gatewayreceived the request and routed it to the serverdefault-gateway. - Then,
default-gatewaymade a request to serverdefault-colorteller-whiteto retrieve the color. - Instead of directly calling the
color-tellerserver, the request went to thedefault-gatewayEnvoy proxy and the proxy routed the call tocolor-teller.
That’s the advantage of using the Envoy proxy. Envoy is a self-contained process that is designed to run in parallel with all application servers. All of the Envoy proxies form a transparent communication mesh through which each application sends and receives messages to and from localhost while remaining unaware of the broader network topology.
For App Mesh integration, the X-Ray tracer records the mesh name and virtual node name values and injects them into the segment JSON document. Here is an example:
To enable X-Ray tracing through App Mesh inside Envoy, you must set two environment variable configurations:
ENABLE_ENVOY_XRAY_TRACINGXRAY_DAEMON_PORT
The first one enables X-Ray tracing using 127.0.0.1:2000 as the default daemon endpoint to which generated segments are sent. If the daemon you installed listens on a different port, you can specify a port value to override the default X-Ray daemon port by using the second configuration.
Conclusion
Currently, AWS X-Ray supports SDKs written in multiple languages (including Java, Python, Go, .NET, and .NET Core, Node.js, and Ruby) to help you implement your services. For more information, see Getting Started with AWS X-Ray.