Containers
Autoscaling Amazon ECS services based on custom CloudWatch and Prometheus metrics
Introduction
Horizontal scalability is a critical aspect of cloud native applications. Microservices deployed to Amazon ECS leverage the Application Auto Scaling service to automatically scale based on observed metrics data. Amazon ECS measures service utilization based on CPU and memory resources consumed by the tasks that belong to a service and publishes CloudWatch metrics, namely, ECSServiceAverageCPUUtilization and ECSServiceAverageMemoryUtilization, with this data. Application Auto Scaling can then use these predefined metrics in conjunction with scaling policies to proportionally scale the number of tasks in a service. There are several use cases where a service’s average CPU and memory usage alone are not reliable indicators of when and to what degree to execute a scaling action. Custom metrics that track other application aspects such as number of HTTP requests received, number of messages retrieved from a queue/topic, and number of database transactions executed, may, in some scenarios, be better suited to trigger scaling actions.
Application Auto Scaling also supports scaling a service based on a custom metric specification that represents a CloudWatch metric of our choosing. Customers have had the ability to publish custom metric data from their applications to CloudWatch using one of the AWS SDKs best suited to their programming language or platform. With the recent announcement of the general availability of Container Insights Prometheus Metrics Monitoring for Amazon ECS, customers can now automate the discovery and collection of custom Prometheus metrics from their containerized applications.
In this post, we will discuss the details of how either one of these metrics collection strategies can be used in conjunction with Application Auto Scaling to scale services deployed to Amazon ECS based on custom metrics data.
Architecture
The autoscaling solution is demonstrated using the application stack shown in the figure below. Streaming data is received via an Application Load Balancer by the service, Kafka Producer Service, deployed to an Amazon ECS cluster. The service publishes the data to a topic in Amazon MSK. Another service, Kafka Consumer Service, retrieves these messages from the Kafka topic and performs downstream processing. The services use AWS SDK to publish custom metric data into a CloudWatch namespace. The services have also been instrumented with Prometheus client library. The CloudWatch agent with Prometheus support is deployed as a service in the Amazon ECS cluster and is configured to collect Prometheus metrics from these services and send them to CloudWatch. An AWS Lambda function that is scheduled to run periodically converts the custom metric data collected from the applications into a service utilization metric that is then used by Application Auto Scaling to proportionally scale the target.
The objective is to scale out/in the number of tasks in the Kafka Consumer Service so that
- The rate of messages processed by all the tasks that belong to that the service stays abreast of the rate of messages produced by the Kafka Producer Service
- The average rate of messages processed by each task in the Kafka Consumer Service stays below a set threshold.

Publishing custom metrics with the CloudWatch SDK
Applications can publish custom metric data to CloudWatch namespace as long as it doesn’t begin with “AWS/”. The producer and consumer applications have been instrumented with AWS SDK for Java as shown below so that they can capture metric data pertaining to the number of messages produced/consumed.
package com.octank.kafka.metrics;

import java.util.ArrayList;
import java.util.Collection;

import org.apache.log4j.Logger;

import com.amazonaws.auth.DefaultAWSCredentialsProviderChain;
import com.amazonaws.services.cloudwatch.AmazonCloudWatch;
import com.amazonaws.services.cloudwatch.AmazonCloudWatchClientBuilder;
import com.amazonaws.services.cloudwatch.model.Dimension;
import com.amazonaws.services.cloudwatch.model.MetricDatum;
import com.amazonaws.services.cloudwatch.model.PutMetricDataRequest;
import com.amazonaws.services.cloudwatch.model.StandardUnit;
import com.octank.kafka.config.AWSConfig;
import com.octank.kafka.config.ECSConfig;

public class ECSCloudWatchCounter {

    private static final Logger logger = Logger.getLogger(ECSCloudWatchCounter.class);

    private final static String PUBLISH_COUNTER = "messages_produced_total";
    private final static String CONSUME_COUNTER = "messages_consumed_total";

    private final static String CLOUDWATCH_NAMESPACE = "ECS/CloudWatch/Custom";

    private static double messagesPublished = 0.0;
    private static double messagesConsumed = 0.0;

    private static AmazonCloudWatch cloudwatch;
    private static Collection<Dimension> dimensions;
    private static boolean isConsumer;

    public static void init (boolean mode)
    {
        try {
            isConsumer = mode;
            cloudwatch = AmazonCloudWatchClientBuilder
                    .standard()
                    .withCredentials(DefaultAWSCredentialsProviderChain.getInstance())
                    .withRegion(AWSConfig.getRegion()).build();

            Dimension taskGroupDimension = new Dimension()
                    .withName("TaskGroup")
                    .withValue(ECSConfig.getTaskGroup());

            Dimension clusterDimension = new Dimension()
                    .withName("ClusterName")
                    .withValue(ECSConfig.getClusterName());

            dimensions = new ArrayList<Dimension>();
            dimensions.add(taskGroupDimension);
            dimensions.add(clusterDimension);
        } catch (Exception ex) {
            logger.error(String.format("Exception ocurred while initialiazing CloudWatch client: %s", ex.getMessage()));
        }
    }

    public static void incMessagesPublished() {
        messagesPublished++;
    }

    public static void incMessagesConsumed() {
        messagesConsumed++;
    }

    public static void putMetricData(long timerId) {

        try {
            if (!isConsumer) {
                MetricDatum publishDatum = new MetricDatum()
                        .withMetricName(ECSCloudWatchCounter.PUBLISH_COUNTER)
                        .withUnit(StandardUnit.None)
                        .withValue(messagesPublished)
                        .withDimensions(dimensions);

                PutMetricDataRequest publishRequest = new PutMetricDataRequest()
                        .withNamespace(CLOUDWATCH_NAMESPACE)
                        .withMetricData(publishDatum);

                cloudwatch.putMetricData(publishRequest);
            } else {
                MetricDatum consumeDatum = new MetricDatum()
                        .withMetricName(ECSCloudWatchCounter.CONSUME_COUNTER)
                        .withUnit(StandardUnit.None)
                        .withValue(messagesConsumed)
                        .withDimensions(dimensions);

                PutMetricDataRequest consumeRequest = new PutMetricDataRequest()
                        .withNamespace(CLOUDWATCH_NAMESPACE)
                        .withMetricData(consumeDatum);

                cloudwatch.putMetricData(consumeRequest);
            }
        }
        catch (Exception ex) {
            logger.error("Exception occurred when calling CloudWatch PutMetricData API", ex);
        }

        messagesPublished = 0.0;
        messagesConsumed = 0.0;
    }
}
A counter is used to keep track of the number of messages sent to/received from the Kafka topic by each task. The incMessagesPublished/incMessagesConsumed methods, invoked from elsewhere in the application code, increment the counter every time a message is handled by a task. The putMetricData method is periodically called once every 30 seconds to publish this metric data to the CloudWatch namespace ECS/CloudWatch/Custom. Refer to the documentation for Amazon CloudWatch pricing for charges incurred on custom metrics.
Publishing custom metrics with Prometheus
If you choose to capture custom metrics using Prometheus, then the applications are instrumented with Prometheus client library for Java as shown below.
package com.octank.kafka.metrics;

public class PrometheusCounter {
    protected static final String JOB_PRODUCER = "producers";
    protected static final String JOB_CONSUMER = "consumers";
    private final static String PRODUCER_COUNTER = "messages_produced_total";
    private final static String CONSUMER_COUNTER = "messages_consumed_total";

    private static io.prometheus.client.Counter messagesPublished;
    private static io.prometheus.client.Counter messagesConsumed;

    public static void init(boolean isConsumer) {
        if (isConsumer) {
            messagesConsumed = io.prometheus.client.Counter
                    .build()
                    .name(CONSUMER_COUNTER)
                    .help("Total number of messages consumed from a kafka topic")
                    .labelNames("job", "topic")
                    .register();
        } else {
            messagesPublished = io.prometheus.client.Counter
                    .build()
                    .name(PRODUCER_COUNTER)
                    .help("Total number of messages published to a kafka topic")
                    .labelNames("job", "topic")
                    .register();
        }
    }

    public static void incMessagesPublished(String topic) {
        messagesPublished.labels(JOB_PRODUCER, topic).inc();
    }

    public static void incMessagesConsumed(String topic) {
        messagesConsumed.labels(JOB_CONSUMER, topic).inc();
    }
}
Here, a Prometheus Counter is used to keep track of the number of messages sent to/received from the Kafka topic by each task. The Counter is incremented by calling the incMessagesPublished/incMessagesConsumed methods every time a message is handled by a task. In this implementation, both producer and consumer applications make use of the Vert.x framework and expose these custom metrics to a metrics collector at the /metrics endpoint using the MetricsHandler.
Steps to deploy the CloudWatch agent with Prometheus monitoring to Amazon ECS, and how to configure it to scrape targets are documented here. While Prometheus supports auto-discovery of scraping targets in a Kubernetes cluster such as nodes, services, pods, there is no such built-in discovery for Amazon ECS. The mechanism used by the CloudWatch agent for identifying scraping targets in an Amazon ECS cluster leverages Prometheus’ support for file-based service discovery and is well documented here. The agent configuration used for the current implementation is shown below.
{
   "logs":{
      "metrics_collected":{
         "prometheus":{
            "prometheus_config_path":"env:PROMETHEUS_CONFIG_CONTENT",
            "ecs_service_discovery":{
               "sd_frequency":"1m",
               "sd_result_file":"/tmp/cwagent_ecs_auto_sd.yaml",
               "task_definition_list":[
                  {
                     "sd_job_name":"producers",
                     "sd_metrics_ports":"8080",
                     "sd_task_definition_arn_pattern":".*:task-definition/KafkaProducerTask:[0-9]+",
                     "sd_metrics_path":"/metrics"
                  },
                  {
                     "sd_job_name":"consumers",
                     "sd_metrics_ports":"8080",
                     "sd_task_definition_arn_pattern":".*:task-definition/KafkaConsumerTask:[0-9]+",
                     "sd_metrics_path":"/metrics"
                  }
               ]
            },
            "emf_processor":{
               "metric_declaration":[
                  {
                     "source_labels": ["job"],
                     "label_matcher":"^producers$",
                     "dimensions": [["ClusterName","TaskGroup"]],
                     "metric_selectors":[
                        "^messages_produced_total$"
                     ]
                  },
                  {
                     "source_labels": ["job"],
                     "label_matcher":"^consumers$",
                     "dimensions": [["ClusterName","TaskGroup"]],
                     "metric_selectors":[
                        "^messages_consumed_total$"
                     ]
                  }
               ]
            }
         }
      },
      "force_flush_interval":5
   }
}
The ecs_service_discovery section helps the CloudWatch agent identify the set of tasks deployed using the KafkaConsumerTask and KafkaProducerTask task definitions as scraping targets. The emf_processor.metric_declaration section configures how Prometheus metrics scraped from these tasks are converted into performance log events using the embedded metric format. With the above configuration settings, a performance log event sent to CloudWatch logs by the agent looks as shown below. This log event will be used by CloudWatch to generate data for a custom metric named messages_consumed_total in the CloudWatch namespace ECS/ContainerInsights/Prometheus with the dimensions, ClusterName and TaskGroup. These dimensions will enable the aggregation of metrics data collected from all tasks that belong to a service.
{
   "CloudWatchMetrics":[
      {
         "Metrics":[{"Name":"messages_consumed_total"}],
         "Dimensions":[["ClusterName","TaskGroup"]],
         "Namespace":"ECS/ContainerInsights/Prometheus"
      }
   ],
   "ClusterName":"ecs-sarathy-cluster",
   "LaunchType":"EC2",
   "StartedBy":"ecs-svc/2462781964732404868",
   "TaskDefinitionFamily":"KafkaConsumerTask",
   "TaskGroup":"service:ConsumerService",
   "TaskRevision":"24",
   "Timestamp":"1613014769602",
   "Version":"0",
   "container_name":"consumer",
   "exported_job":"consumers",
   "instance":"10.10.101.243:8080",
   "job":"consumers",
   "messages_consumed_total":600,
   "prom_metric_type":"counter",
   "topic":"octank"
}
Setting up service scaling with Application Auto Scaling
Amazon ECS service is autoscaled using Application Auto Scaling with a target tracking policy that selects a CloudWatch metric and sets a target value. A custom metric specification that represents a CloudWatch metric of our choosing can be used to set up such a policy. However, not all metrics are suitable target tracking. Cumulative metrics such as messages_consumed_total and messages_produced_total, which are monotone increasing, are not particularly useful for autoscaling. We will have to convert them into a utilization or rate metric that increases or decreases proportionally to the capacity of the scalable target, in this case, the number of tasks in a service.
This task is performed by an AWS Lambda function in this implementation. The Go program shown below is deployed as a Lambda function and using Amazon EventBridge, it is scheduled to execute once every minute. This function is configured to retrieve data for a trailing 60 second period from the CloudWatch namespace ECS/CloudWatch/Custom for the metric messages_produced_total and, using metric math expression, compute a new metric named rate_messages_produced_average_1m proportional to the number of consumer tasks. This metric is then published back into CloudWatch as a custom metric and serves as a valid utilization metric that can be used by Application Auto Scaling.
package main

import (
    "context"
    "encoding/json"
    "log"
    "os"
    "time"

    "github.com/aws/aws-lambda-go/lambda"
    "github.com/aws/aws-sdk-go/aws"
    "github.com/aws/aws-sdk-go/aws/session"
    "github.com/aws/aws-sdk-go/service/cloudwatch"
    "github.com/aws/aws-sdk-go/service/ecs"
    "github.com/aws/aws-sdk-go/service/ssm"
)

var sharedSession *session.Session = nil

func main() {
    lambda.Start(HandleRequest)
}

func HandleRequest(ctx context.Context) (string, error) {
    initializeAWSSession()
    ssmService := getSSMClient()
    cloudwatchService := getCloudWatchClient()
    ecsService := getECSClient()

    //
    // Get the number of tasks running under the target service
    //
    serviceName := aws.String("ConsumerService")
    clusterName := aws.String("ecs-sarathy-cluster")
    describeServiceOutput, err := ecsService.DescribeServices(&ecs.DescribeServicesInput{Cluster: clusterName, Services: []*string{serviceName}})
    if err != nil {
        return err.Error(), err
    }
    serviceList := describeServiceOutput.Services
    var taskCount float64
    for _, svc := range serviceList {
        desired := svc.DesiredCount
        running := svc.RunningCount
        pending := svc.PendingCount
        log.Printf("Task count for %s: desired = %d, running = %d, pending = %d\n", *serviceName, *desired, *running, *pending)
        if *pending > 0 {
            taskCount = float64(*desired)
        } else {
            taskCount = float64(*running)
        }
    }

    //
    // Get the SSM Parameter that defines CloudWatch metric data queries in JSON format
    //
    parameterName := aws.String("CloudWatch-MetricData-Queries")
    getParameterOutput, err := ssmService.GetParameter(&ssm.GetParameterInput{Name: parameterName})
    if err != nil {
        return err.Error(), err
    }

    //
    // Unmarshal the JSON data into an array of instances of type 'cloudwatch.MetricDataQuery'
    //
    jsonDataBytes := []byte(*getParameterOutput.Parameter.Value)
    var metricDataQueries []*cloudwatch.MetricDataQuery
    err = json.Unmarshal(jsonDataBytes, &metricDataQueries)
    if err != nil {
        return err.Error(), err
    }

    //
    // Get the name, namespace and dimensions to be associated with the custom metric
    //
    var metricName, metricNamespace *string
    var metricDimensions []*cloudwatch.Dimension
    for _, query := range metricDataQueries {
        if !*query.ReturnData {
            metricNamespace = query.MetricStat.Metric.Namespace
            metricDimensions = query.MetricStat.Metric.Dimensions
        }
        if *query.ReturnData {
            metricName = query.Label
        }
    }
    if metricName == nil || metricNamespace == nil || metricDimensions == nil {
        return "Unable to find CloudWatch namespace and dimensions for the metric", nil
    }

    //
    // Retrieve metric data for the last 5 minutes
    // The data rerieved pertains to that of a metric computed using metric math expresions defined in MetricDataQuery
    //
    now := time.Now()
    endTime := time.Date(now.Year(), now.Month(), now.Day(), now.Hour(), now.Minute(), 0, 0, now.Location())
    startTime := endTime.Add(-5 * time.Minute)
    maxDataPoints := int64(100)
    getMetricDataOutput, err := cloudwatchService.GetMetricData(&cloudwatch.GetMetricDataInput{
        MetricDataQueries: metricDataQueries,
        StartTime:         &startTime,
        EndTime:           &endTime,
        MaxDatapoints:     &maxDataPoints,
        ScanBy:            aws.String("TimestampDescending"),
    })
    if err != nil {
        return err.Error(), err
    }
    log.Println(getMetricDataOutput.MetricDataResults)

    //
    // Collect the values/timestamps retrieved for the metric and insert them as a custom metric in CloudWatch
    //
    var metricData []*cloudwatch.MetricDatum
    metricDataTimestamps := getMetricDataOutput.MetricDataResults[0].Timestamps
    metricDataValues := getMetricDataOutput.MetricDataResults[0].Values
    for i, value := range metricDataValues {
        timestamp := metricDataTimestamps[i]
        averageValue := *value / taskCount
        metricData = append(metricData, &cloudwatch.MetricDatum{
            MetricName: metricName,
            Timestamp:  timestamp,
            Value:      &averageValue,
            Dimensions: metricDimensions,
        })
    }
    _, err = cloudwatchService.PutMetricData(&cloudwatch.PutMetricDataInput{
        Namespace:  metricNamespace,
        MetricData: metricData,
    })
    log.Println("Completed successully")
    return "", nil
}

func initializeAWSSession() {
    region := os.Getenv("AWS_REGION")
    if region == "" {
        region = "us-east-1"
    }
    sharedSession, _ = session.NewSession(&aws.Config{Region: aws.String(region)})
    if sharedSession == nil {
        log.Fatalf("Unable to create a new AWS client session")
    }
}

func getCloudWatchClient() *cloudwatch.CloudWatch {
    service := cloudwatch.New(sharedSession)
    return service
}

func getSSMClient() *ssm.SSM {
    service := ssm.New(sharedSession)
    return service
}

func getECSClient() *ecs.ECS {
    service := ecs.New(sharedSession)
    return service
}
The Lambda function performs its task based on the following JSON configuration data, which is read from AWS Systems Manager Parameter Store. The execution role for this function requires the following set of IAM permissions: cloudwatch:GetMetricData, cloudwatch:PutMetricData, ecs:DescribeServices, ssm:GetParameter, logs:
[
   {
      "Id":"m1",
      "Label":"sum_messages_produced_total_1m",
      "ReturnData":false,
      "MetricStat":{
         "Metric":{
            "Namespace":"ECS/CloudWatch/Custom",
            "MetricName":"messages_produced_total",
            "Dimensions":[
               {
                  "Name":"ClusterName",
                  "Value":"ecs-sarathy-cluster"
               },
               {
                  "Name":"TaskGroup",
                  "Value":"service:PublisherService"
               }
            ]
         },
         "Period":60,
         "Stat":"Sum"
      }
   },
   {
      "Id":"m2",
      "Expression":"m1/60",
      "Label":"rate_messages_produced_average_1m",
      "ReturnData":true,
      "Period":60
   }
]
Next, the DesiredCount dimension for the consumer service is registered as a scalable target with Application Auto Scaling. This will allow the service to scale out up to a maximum of 10 tasks, which in this implementation, is also the number of partitions in the Kafka topic.
CLUSTER_NAME=ecs-sarathy-cluster
SERVICE_NAME=ConsumerService
aws application-autoscaling register-scalable-target \
--service-namespace ecs \
--scalable-dimension ecs:service:DesiredCount \
--resource-id service/$CLUSTER_NAME/$SERVICE_NAME \
--min-capacity 1 \
--max-capacity 10
Next, a target tracking policy is created using the configuration parameters defined in config.json.
CLUSTER_NAME=ecs-sarathy-cluster
SERVICE_NAME=ConsumerService
POLICY_NAME=Message-Consumption-Rate-Policy
aws application-autoscaling put-scaling-policy \
--policy-name $POLICY_NAME \
--service-namespace ecs \
--resource-id service/$CLUSTER_NAME/$SERVICE_NAME \
--scalable-dimension ecs:service:DesiredCount \
--policy-type TargetTrackingScaling \
--target-tracking-scaling-policy-configuration file://config.json
The contents of config.json file are shown below. This policy tracks the custom metric rate_messages_produced_average_1m with target value of 30.
{
    "TargetValue":30.0,
    "ScaleOutCooldown":120,
    "ScaleInCooldown":120,
    "CustomizedMetricSpecification":{
       "MetricName":"rate_messages_produced_average_1m",
       "Namespace":"ECS/CloudWatch/Custom",
       "Dimensions":[
          {
             "Name":"ClusterName",
             "Value":"ecs-sarathy-cluster"
          },
          {
             "Name":"TaskGroup",
             "Value":"service:PublisherService"
            }
       ],
       "Statistic":"Average"
    }
 }
With the above policy, Application Auto Scaling creates and manages CloudWatch metric alarms that trigger the scaling actions. The steps involved in converting a CloudWatch custom metric that was created based on a Prometheus Counter into a utilization or rate metric are essentially the same. The relevant metric data is retrieved from the namespace ECS/ContainerInsights/Prometheus.
Autoscaling in action
We start off with a deployment that is comprised of two tasks of the Kafka Publisher Service, one task of the Kafka Consumer Service, as well as the CloudWatch agent with Prometheus support. The Kafka topic is set up with 10 partitions. A steady stream of messages is published to the Kafka topic at the rate of about 65-70 messages/second. Messages from all partitions are processed by the single task in the consumer service at the rate of about 20 messages/second. The per-minute rates of messages produced/consumed are calculated using the metric math expressions SUM(rate_messages_produced_total)/60 and SUM(rate_messages_consumed_total)/60 respectively and displayed in Figure 2. Figure 3 shows the custom utilization metric rate_messages_produced_average_1m, which is computed by Lambda and used for target tracking by Application Auto Scaling. This denotes the rate of messages produced in proportion to the number of consumer tasks is initially also at about 65-70 messages/second as we have only one consumer task.
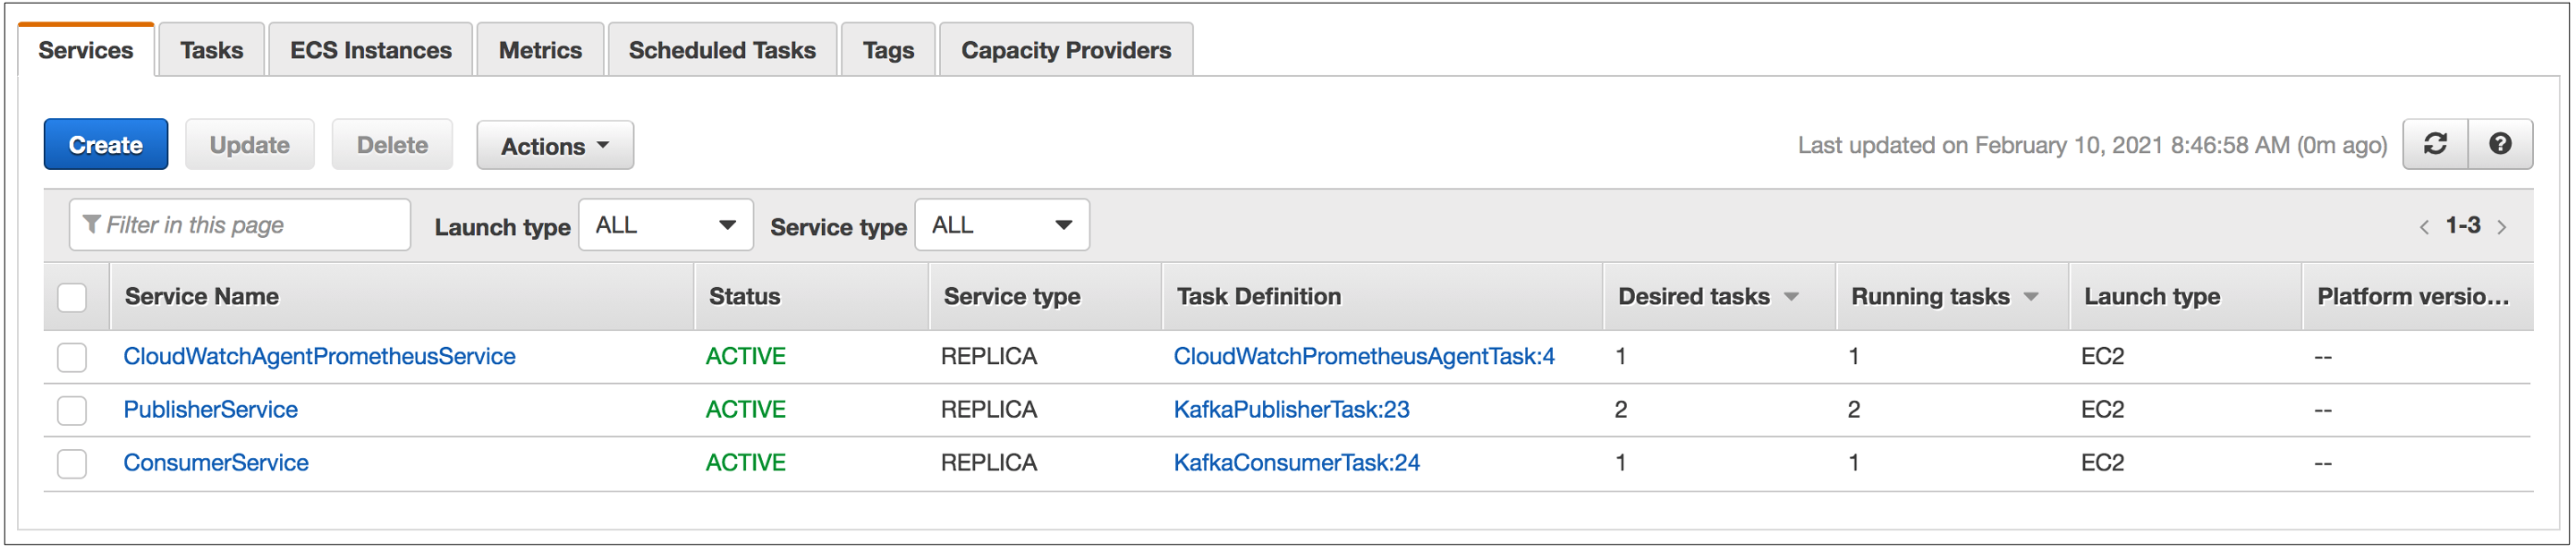
Figure 1. List of services deployed to ECS
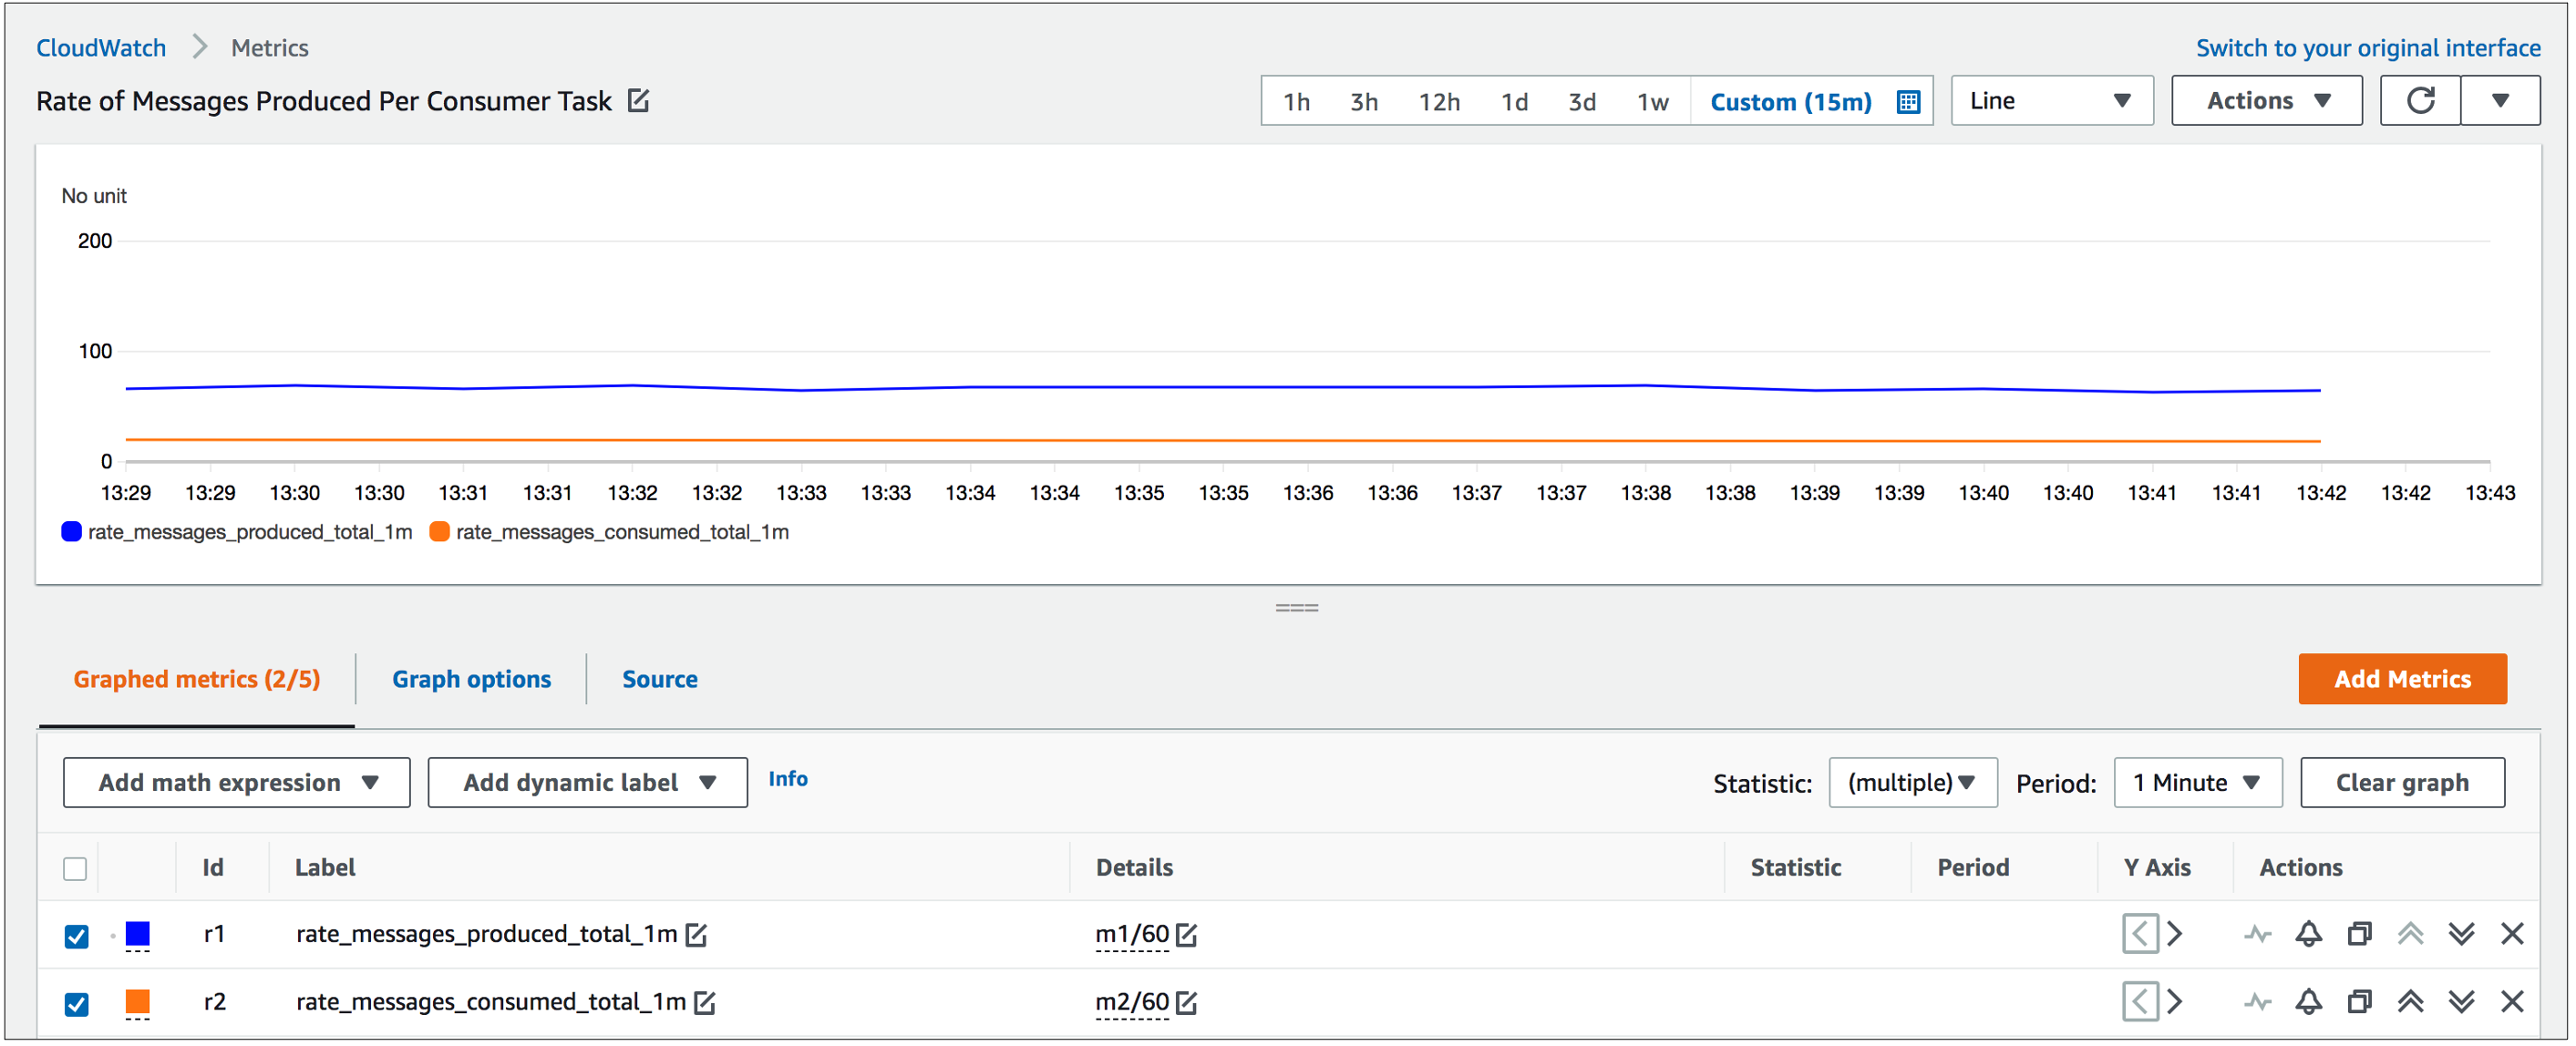
Figure 2. Initial rate messages produced/consumed shown using metric math expressions
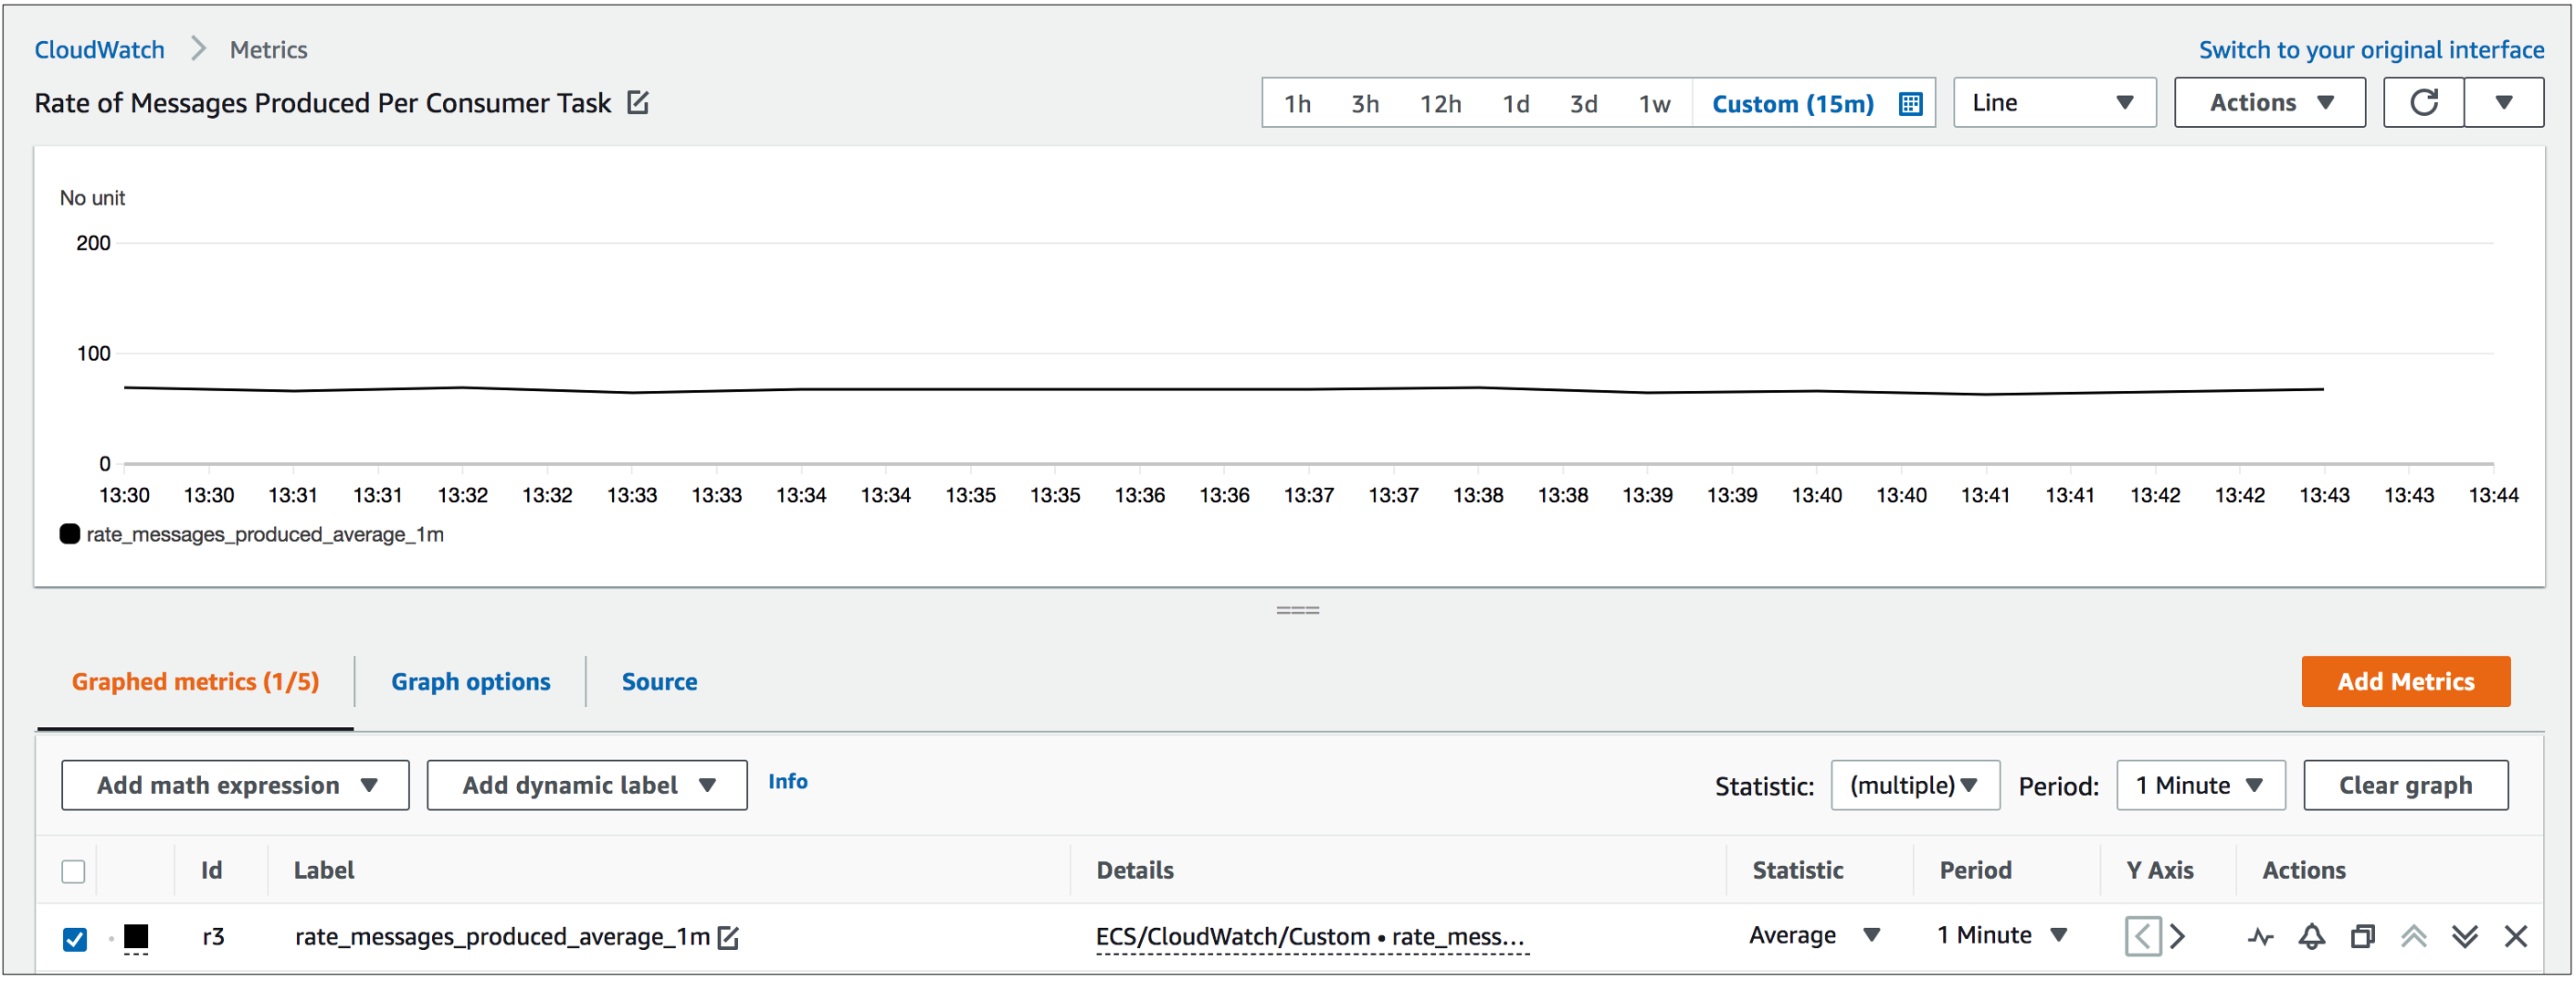
Figure 3. Custom utilization metric computed by Lambda and used for target tracking by Application Auto Scaling
When we create a target tracking scaling policy, Application Auto Scaling creates the two metric alarms shown in the figure below to manage the automatic scaling of the consumer tasks. These two metric alarms, one to handle scale out and the other to handle scale in, together ensure that the average value of the utilization metric rate_messages_produced_average_1m stays in the range of 27-30.
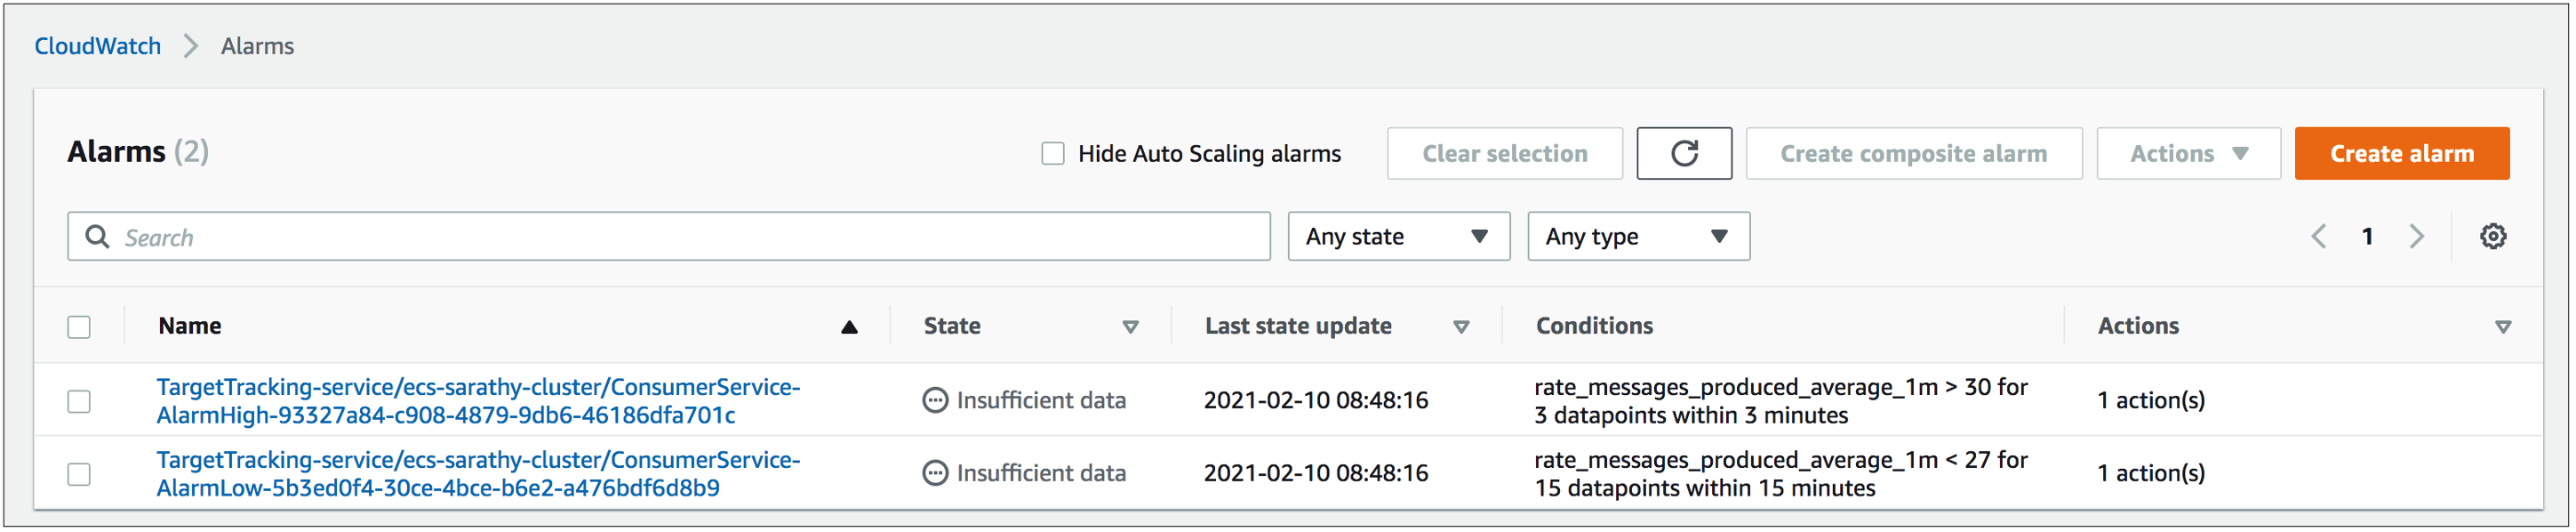
Figure 4. CloudWatch metric alarms managed by Application Auto Scaling
As the initial value of the metric rate_messages_produced_average_1m is about 65-70, the alarm that tracks the upper threshold of this metric executes the first scale out action, during which two additional consumer tasks are launched, which brings this utilization metric value below the target of 30. The rate of messages produced is then doubled to about 130-140 messages/rate. Subsequently, the second scaling action is executed, which launches two more tasks to keep this metric value below the target of 30 after it breaches the set threshold. With more consumer tasks launched, we can see that the combined rate of messages processed by the consumer tasks, indicated by rate_messages_consumed_total_1m, picks up and gets closer to that of the producers. The figures below shows how the system behaves in response to the two scale out actions.
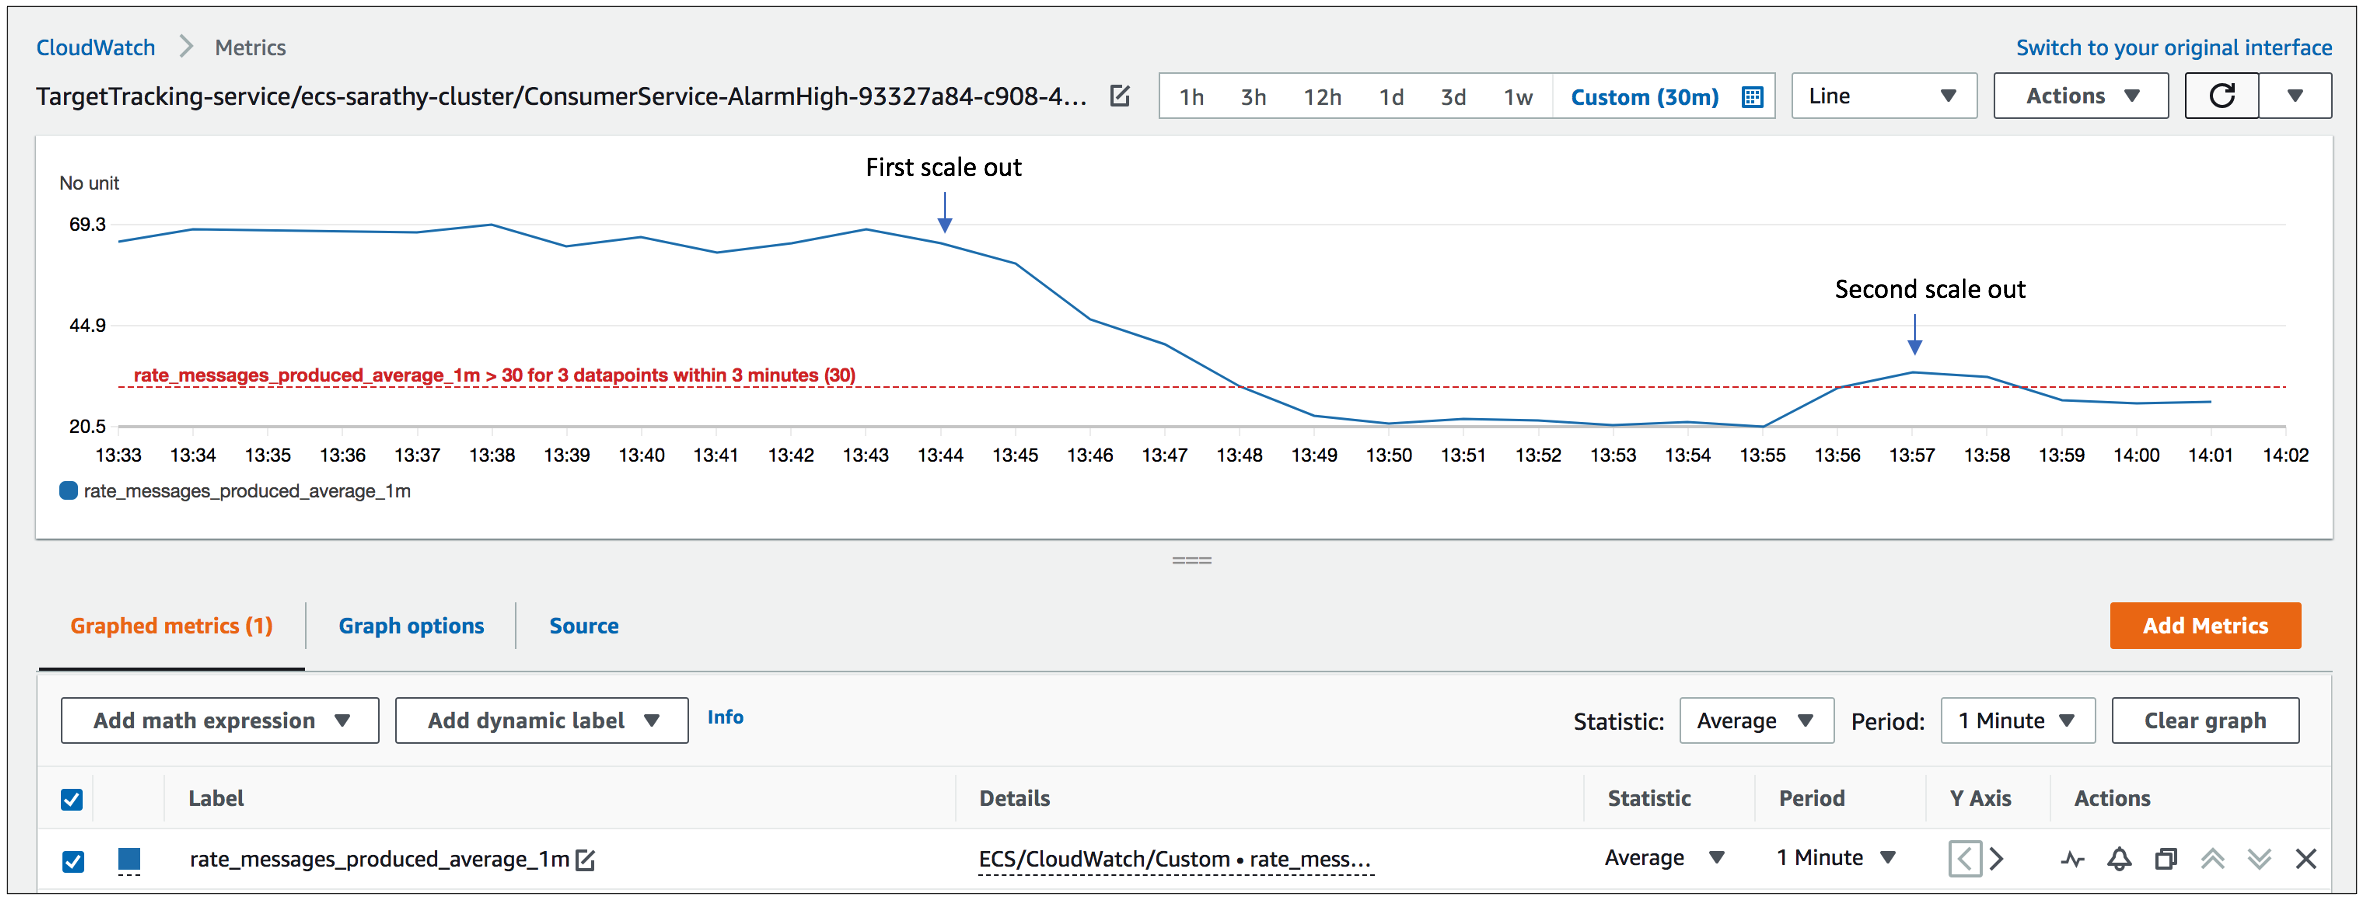
Figure 5. Behavior of the target metric, rate_messages_produced_average_1m, during the two scale out actions.
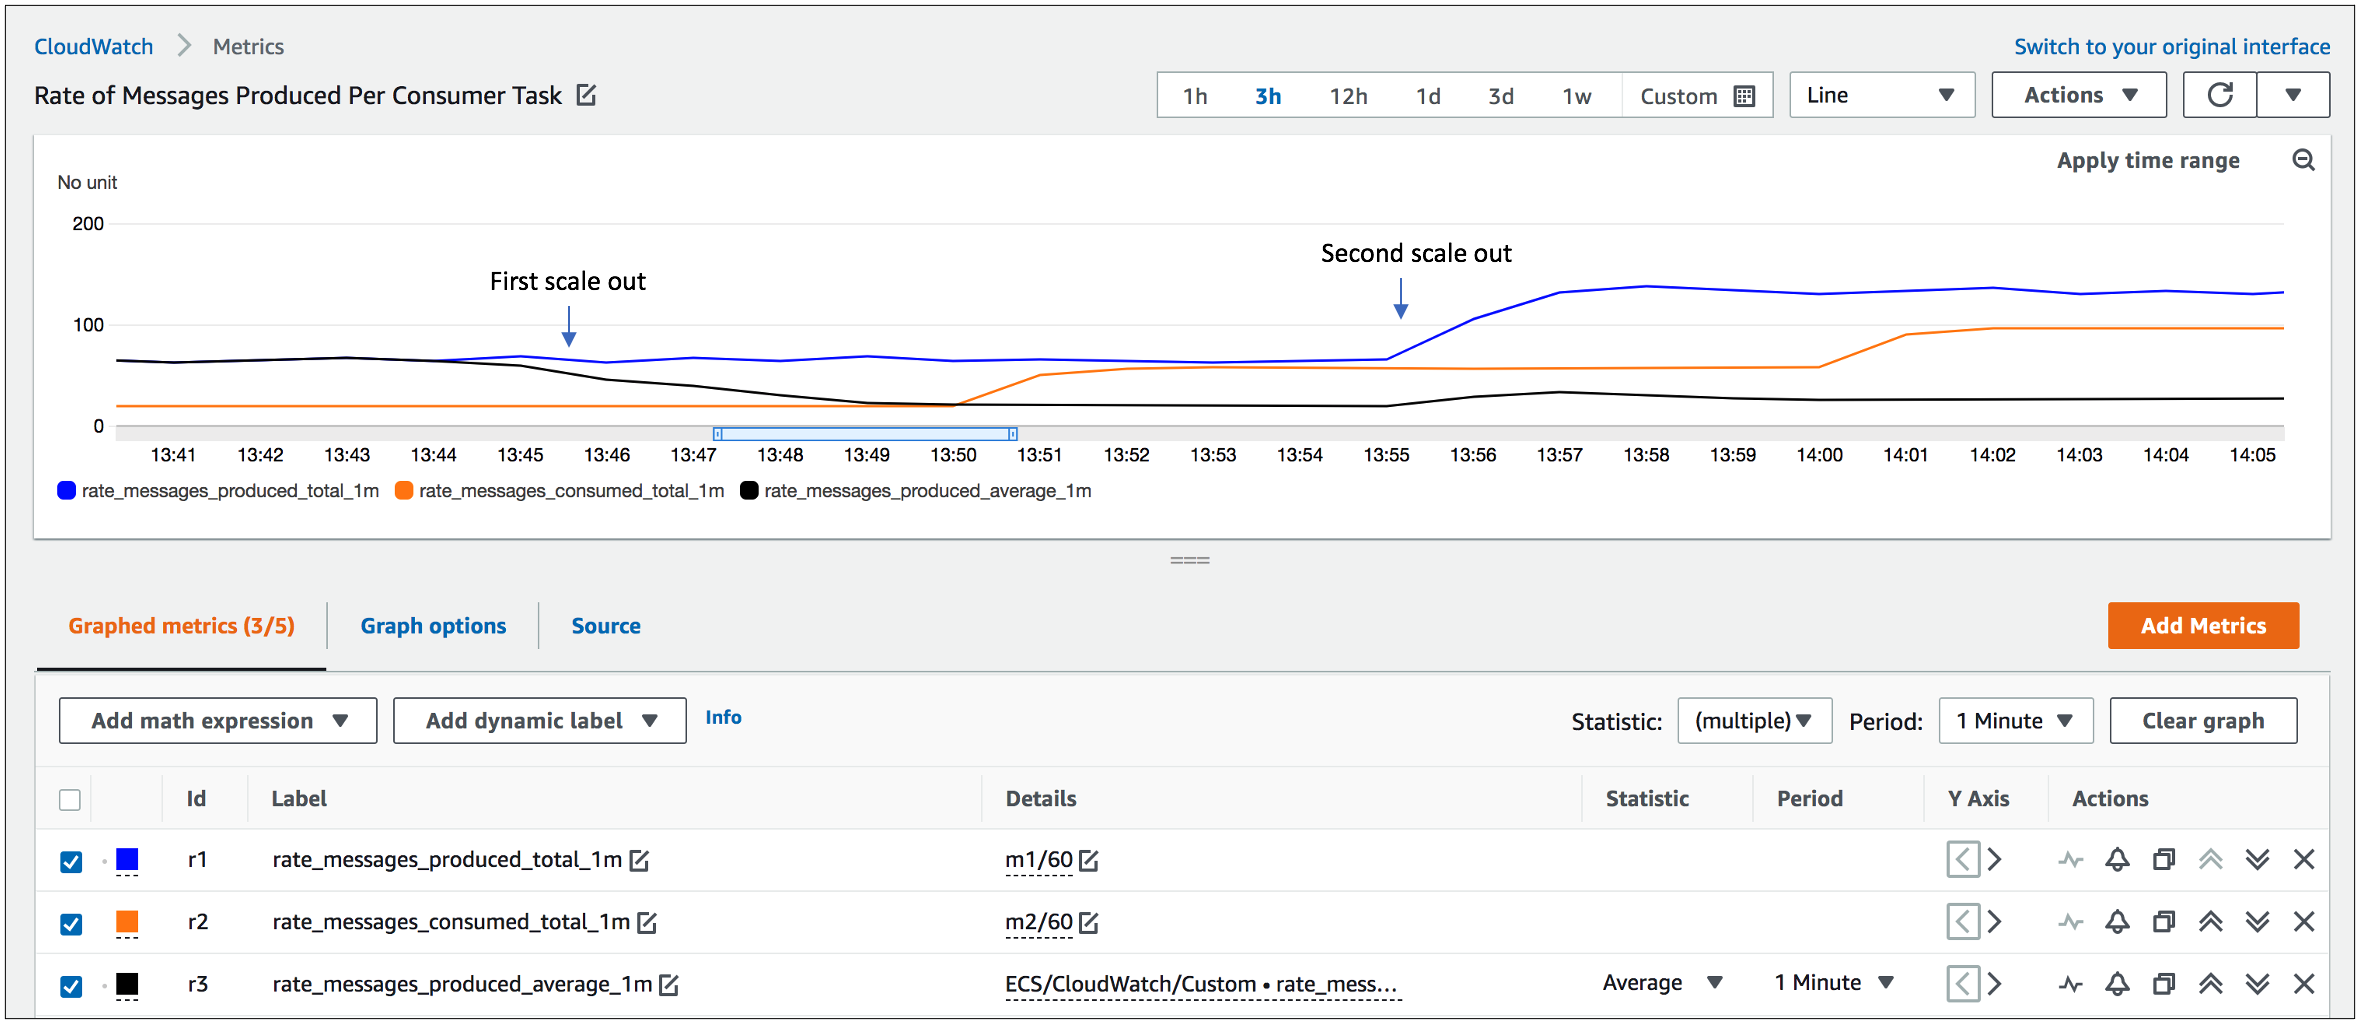
Figure 6. Behavior of the per-minute rate of messages produced/consumed (blue/red) during the scale out actions
The rate of messages produced is now decreased to about 50 messages/second resulting in a scale in action shown in the figures below, bringing the number of consumer tasks down to two. The primary goal of Application Auto Scaling is to prioritize availability in response to an increased load on the system. As seen from these figures, it performs a scale out relatively faster, when a metric breaches a threshold for three one-minute periods, while the scale in action is executed in a far more conservative manner, only after the threshold is breached for 15 one-minute periods.
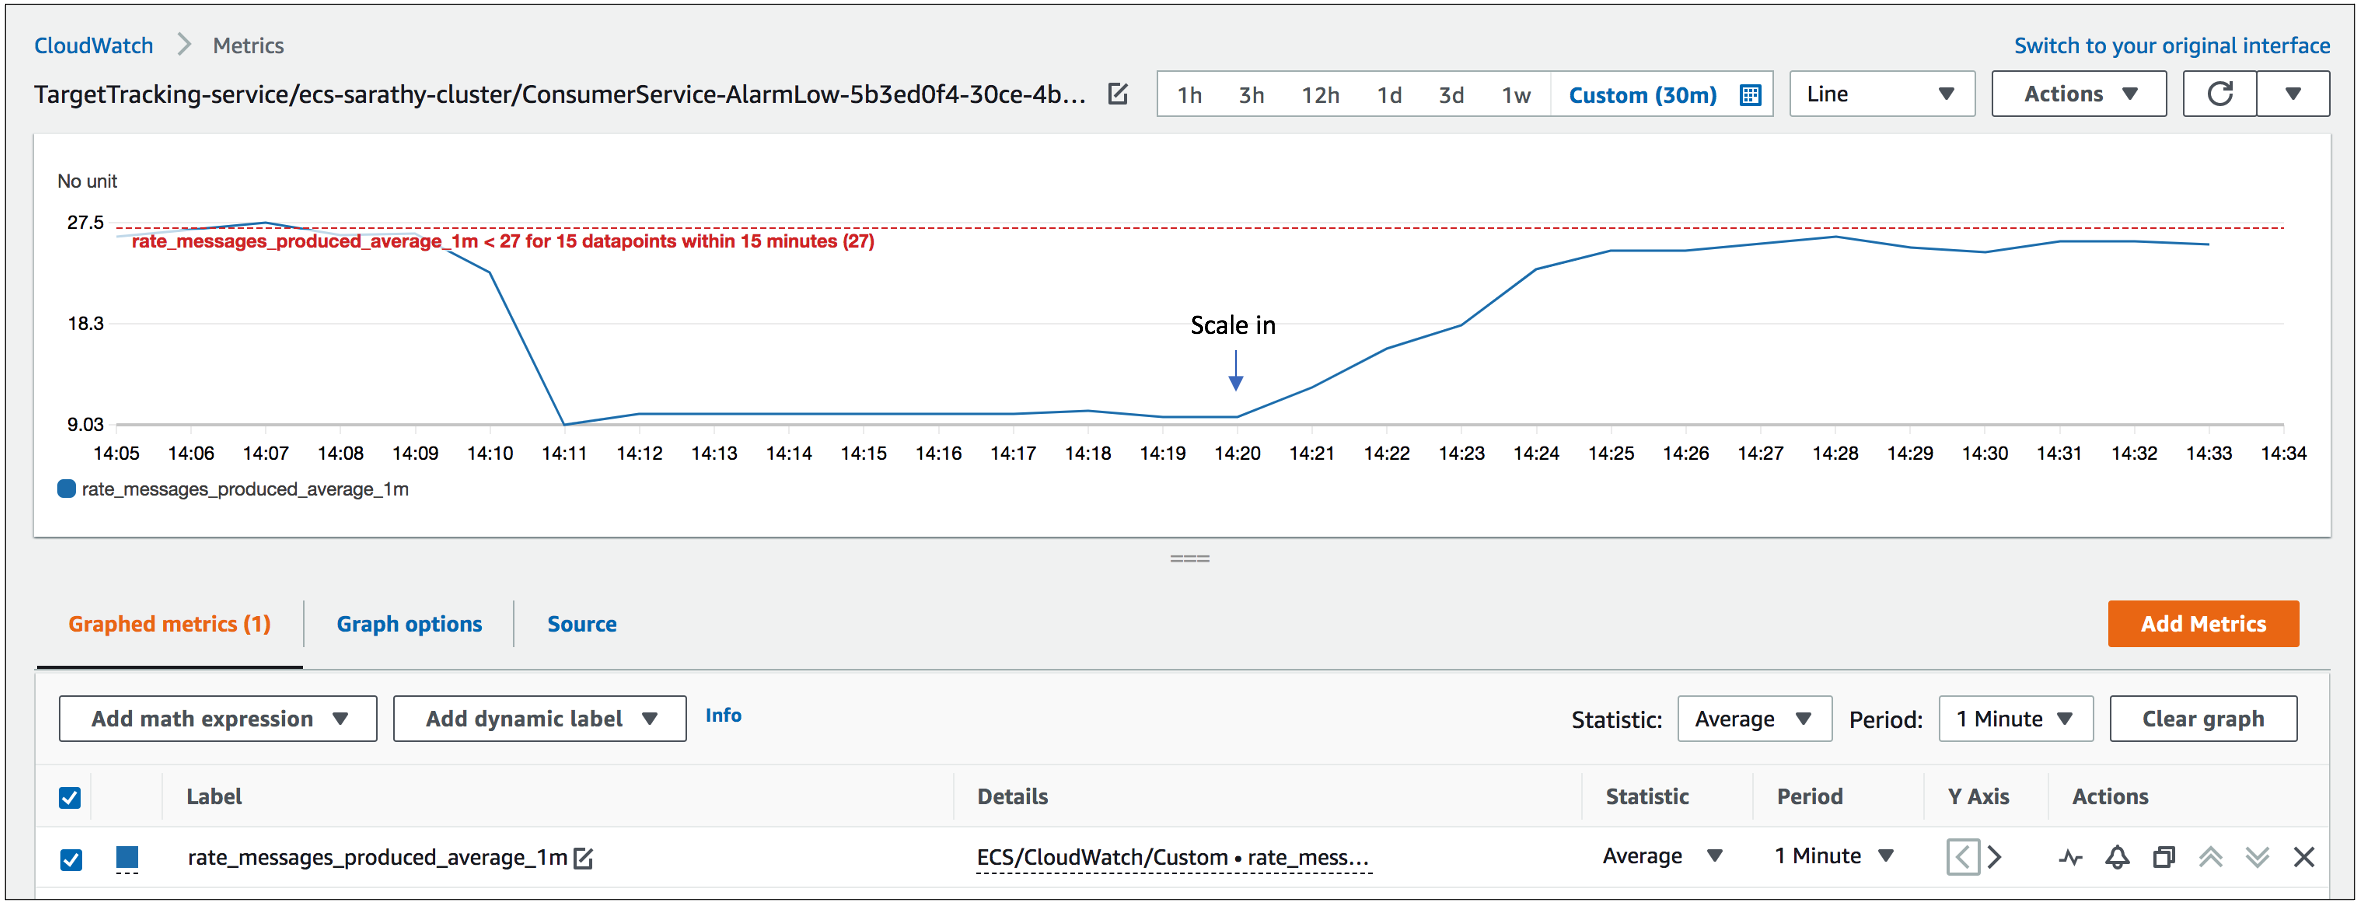
Figure 7. Behavior of the target metric, rate_messages_produced_average_1m, during the scale in action.
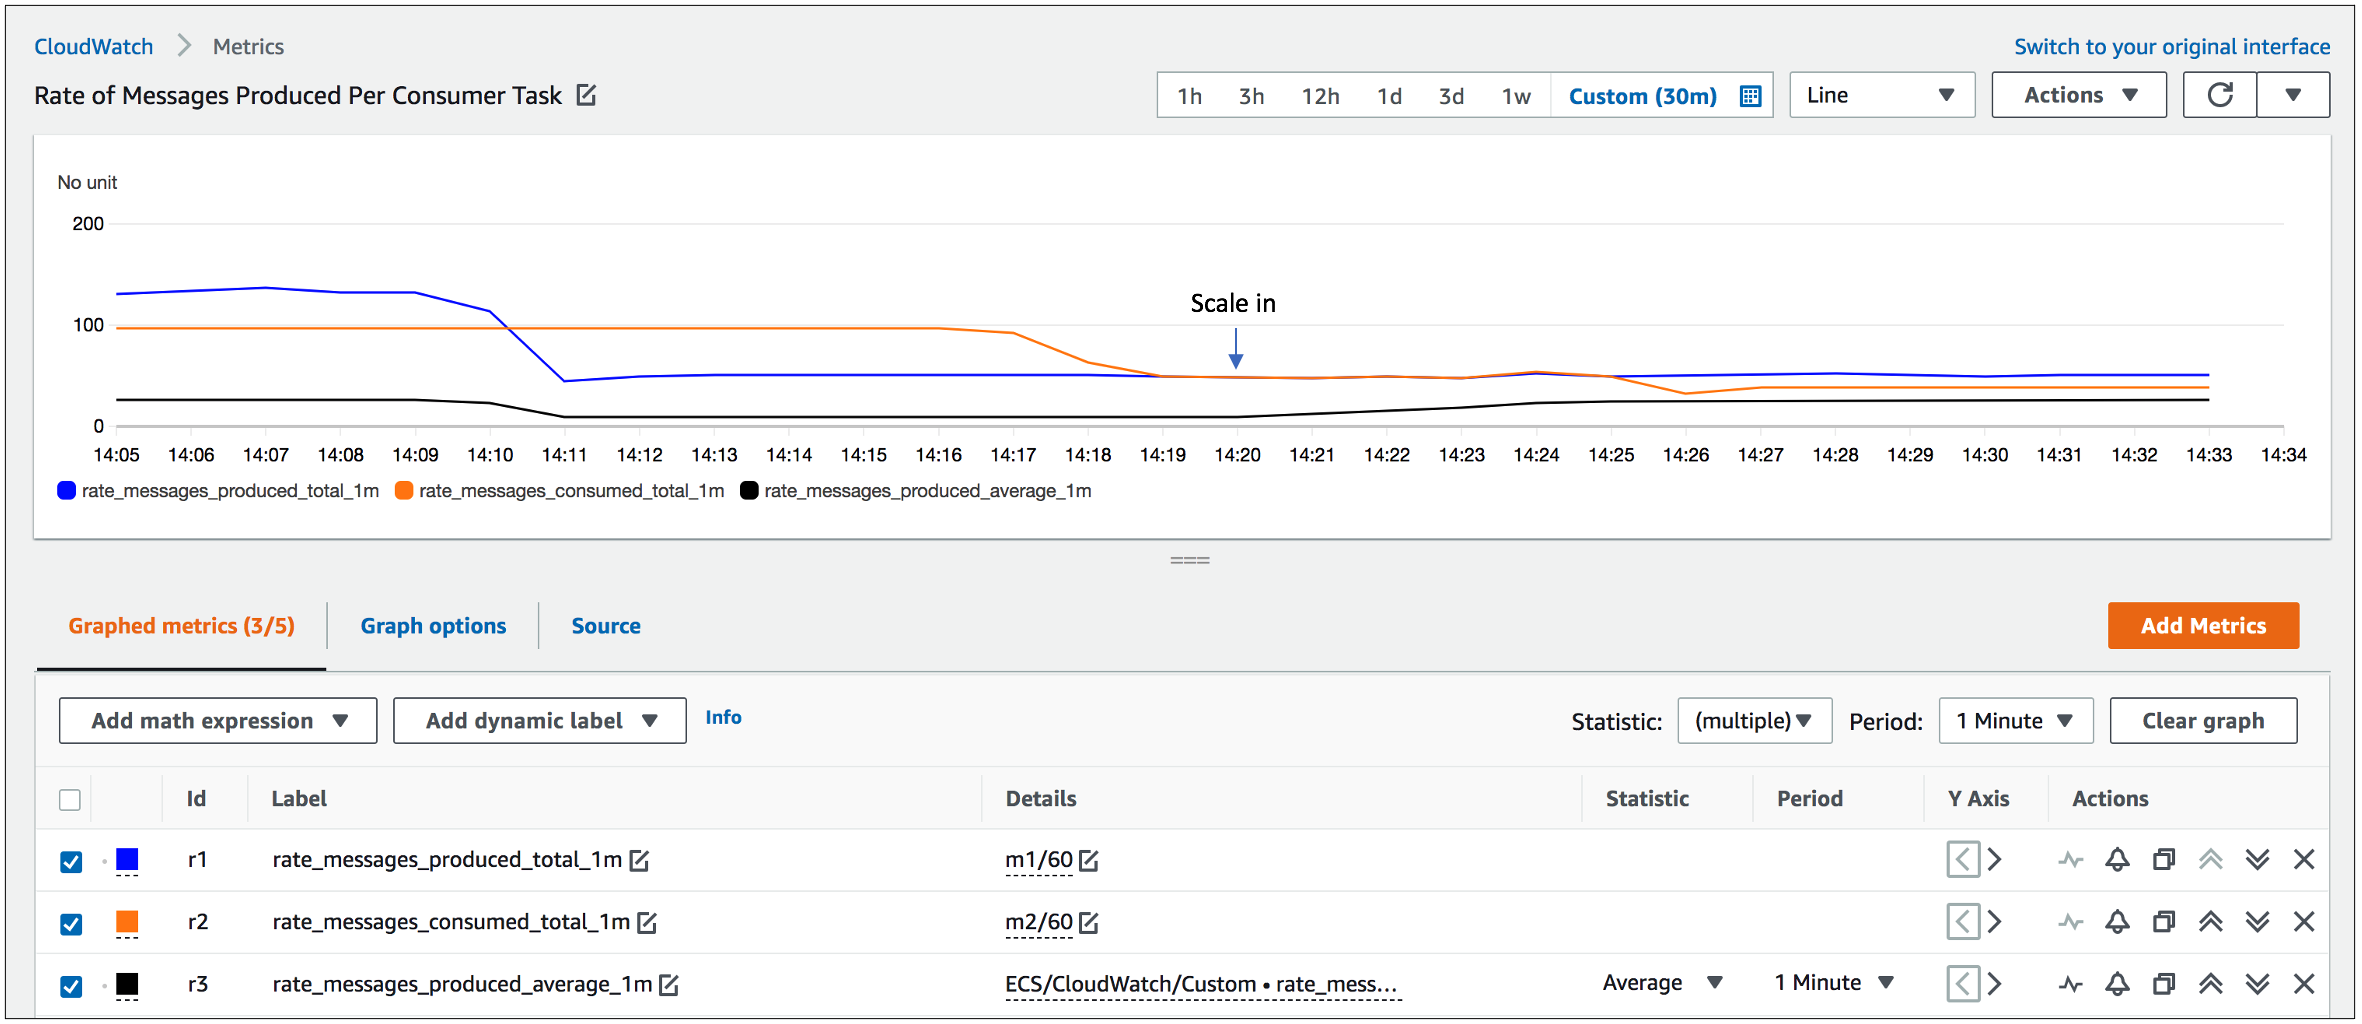
Figure 8. Behavior of the per-minute rate of messages produced/consumed (blue/red) during the scale in action
The figure below shows the change in the number of tasks in the Kafka Consumer Service as well as its average CPU and memory profile during the autoscaling event. Before the scale out, there is one task that is consuming messages from all 10 partitions and after the scale out each of the five tasks is processing messages from two partitions. But the nature of the application in this use case is such that the average CPU and memory usage in each task do not have any correlation to the number of partitions it is consuming messages from and hence are not reliable indicators of when to perform automatic scaling.
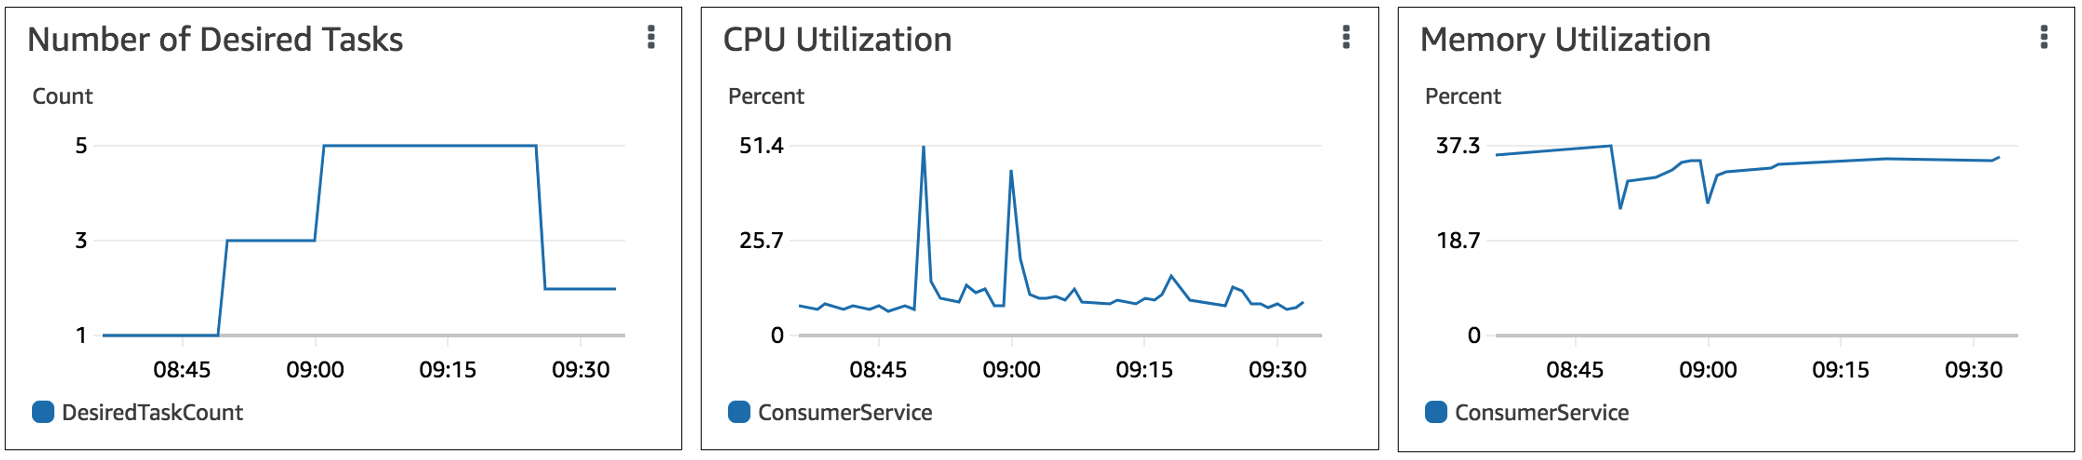
Figure 9. Average CPU and memory usage by consumer tasks
The procedure used for implementing autoscaling with a custom Prometheus metric that was collected from an Amazon ECS service by Container Insights is exactly the same as above. These metrics are ultimately also reported as CloudWatch custom metrics similar to the ones published using CloudWatch SDKs.
Concluding remarks
There are many use cases where custom metrics collected from an application are better indicators for executing an autoscaling action than the metrics providing CPU and memory usage by the application. Microservices deployed to Amazon ECS have the option of collecting such custom application metrics using either CloudWatch SDKs or CloudWatch Container Insights monitoring for Prometheus. A counter, which is a monotone increasing value, is often used to capture cumulative metrics such as the number of HTTP requests processed, number of messages processed from a queue, and number of database transactions executed. This post presented an approach for using Application Auto Scaling in conjunction with such custom cumulative metrics to effectively autoscale microservices deployed to an Amazon ECS cluster.