Containers
How Taloflow saved 60% by moving their data pipeline to AWS Fargate Spot
This post was contributed by Todd Kesselman, CTO, CFO, Chairman, Taloflow.
About Taloflow
Taloflow is a company focused on cloud cost optimization, cloud cost accounting, and explaining the relationship between cloud costs and business metrics.
Data pipeline overview
At Taloflow, we take pride in hitting our Service Level Objectives (SLOs) while always striving to find what economists call the “efficiency frontier.” In this post, I’ll cover why and how Taloflow moved our data pipeline from AWS Glue to AWS Fargate Spot on account of information derived from the AWS Cost Management Platform we built for developers.
The results included:
- Significant cost savings
- More efficient pipeline flows
- Easier scaling
- Better development and debugging
- More accurate cost information
For some background on the nature of our deployment, Taloflow’s pipeline performed the following general functions:
- We pull cloud cost and usage information from a variety of sources. This includes CSVs of AWS Cost and Usage Reports, and queries against client databases.
- We are also pushed data from many sources, including Amazon EventBridge, our own customer facing APIs, and S3 buckets designed to receive 3rd party files.
- We take all the data, clean it, repurpose it for our analysis, store it in a friendly format, and make it available to customers as data lakes and reports.
- We use the data to run machine learning inferencing to create expectations, explanations, and recommendations about cloud costs.
- We integrate the learnings back into the pipeline. From there, the system can push timely analysis, recommendations, and alerts to our customers.
We originally built the cost ingestion pipeline on top of an architecture that featured an Amazon EMR deployment of Flink, AWS Glue, AWS Athena, Amazon MSK, S3, and Amazon ECS. We’ve had this pipeline in place for approximately two years.
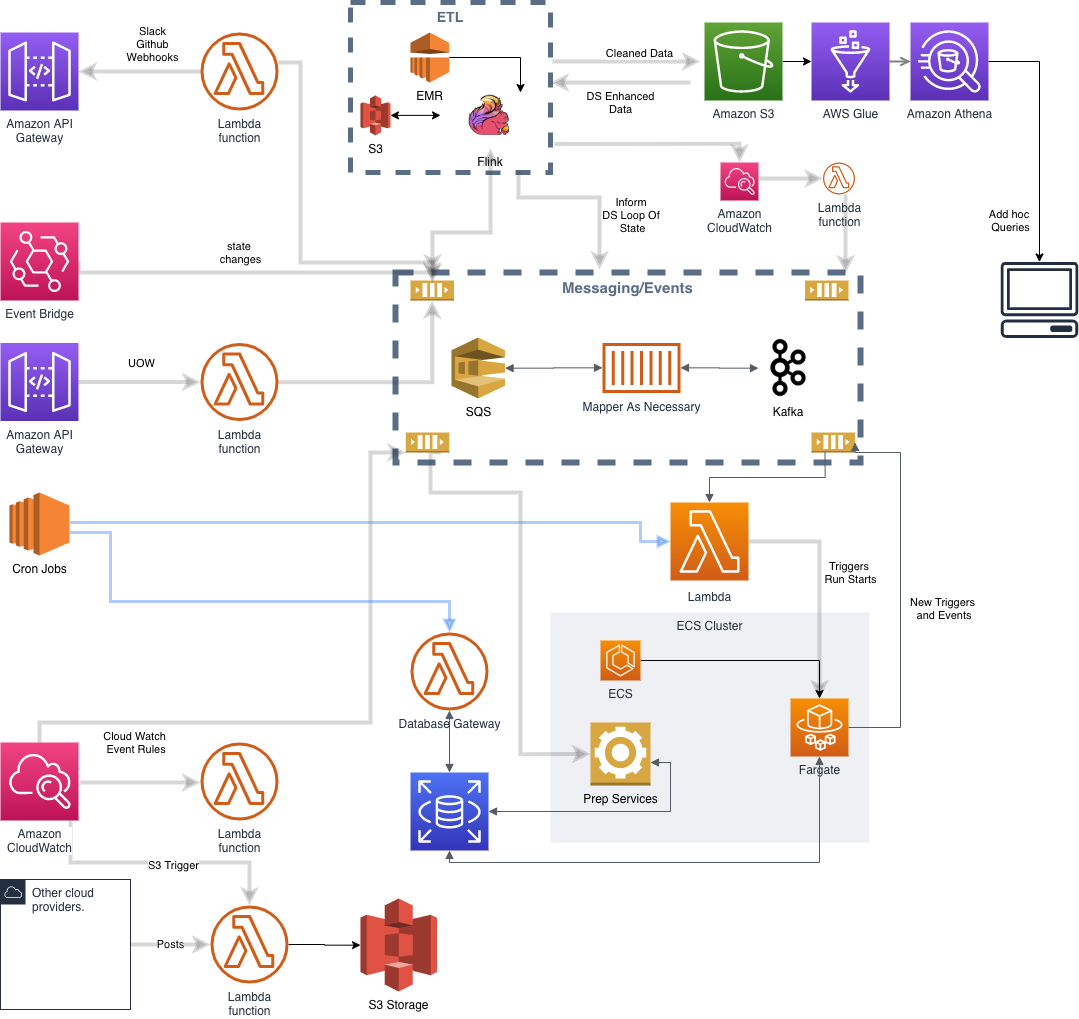
Our deployment history
Here’s where we started. We set up Flink on EMR to handle the inbound streams associated with AWS resources state changes and the basic batched ETL Pipeline. Once we cleaned the files, we stored them in S3 and sent an event to trigger the data science pipeline. The cleaning process required the following:
- The files are checked for completeness and metadata is stored for reference
- We “dedup” the files including cleaning up duplicate hours and days that occur because each AWS Cost and Usage Report repeats information from the prior days
- We apply a small amount of normalization
While the files are being cleaned, they are fed into Flink as a stream so that they may also be used as events for the alerting system. The Flink streams initiate anomaly detection using ML models that are looped back into the flow.
As we were initially building the ETL and data science pipeline (also described in the diagram above), we elected to use AWS Glue, Amazon Athena, and Amazon ECS. At the time, we hypothesized that using Glue would save us developer time and would result in an efficient structure since we were already familiar with Spark and it is a fully managed service. Even though we already were running Flink, we believed that Glue’s integration with Athena, and the job/crawler/table management elements encapsulated in the service would offer sufficient benefit to justify its addition to our workflow. We used AWS Glue to create specialized datasets manipulated for different purposes. We then ran a service on Amazon ECS that listened for completion and triggered various data science tasks as the tables were updated. Finally, we ran the actual learning processes on Amazon ECS containerized tasks, albeit we also ran Amazon SageMaker very early on in this journey. We stored the results in S3. The Flink pipeline monitored the S3 buckets for updated results.
Our cost monitoring made it clear we were spending too much per customer
Six months ago, we began to roll out a new product that links business events to cloud costs for seamless costing and customer profitability. To do this, we use an abstraction called “Unit of Work” to tie the business to compute costs. In our case, we had Units of Work related to the amount of cost information a client uploaded, as well as the size and frequency of analysis required. This was our first look at how much it actually cost us (step and marginal costs) to run the pipeline process and provide alerting and reporting. Once we measured using our product, two things were clear. Our pricing strategy would eventually be a limiting factor on our growth without increasing revenue per customer or reducing cost, and that the issue was getting worse not better.
When we went through our architecture looking for the hot spots to correct course, AWS Glue stood out as trending upwards. Here’s what we saw:
- We spent too much money crawling too frequently and for too many files. This had to do with limitations on the CloudWatch events thrown out by Glue and the fact that our datasets are heavily partitioned on S3. As we grew revenue, the problem also grew. We employed all sorts of hacks in an effort to limit the amount of crawling necessary, but these hacks reduced efficiency.
- It was difficult to optimize exactly how much Glue CPU cost. We overprovisioned for small jobs, underprovisioned for large ones.
- We could not maximize the efficiency of our partitioning. This is because AWS Glue provides limited flexibility in its partitioning settings. As a result, we racked up lots of GetRequests on our S3 buckets.
- It was cumbersome to debug Glue. Using the development endpoint was expensive. Sometimes we left it on by mistake, and it wasn’t a great predictor of whether something would successfully run in a production.
- Launch times varied widely and sometimes exceeded our window for quality of service and our concurrency demands were unpredictable in Glue. We were starting to spend more and more time monitoring and tweaking these factors.
We found an alternative strategy
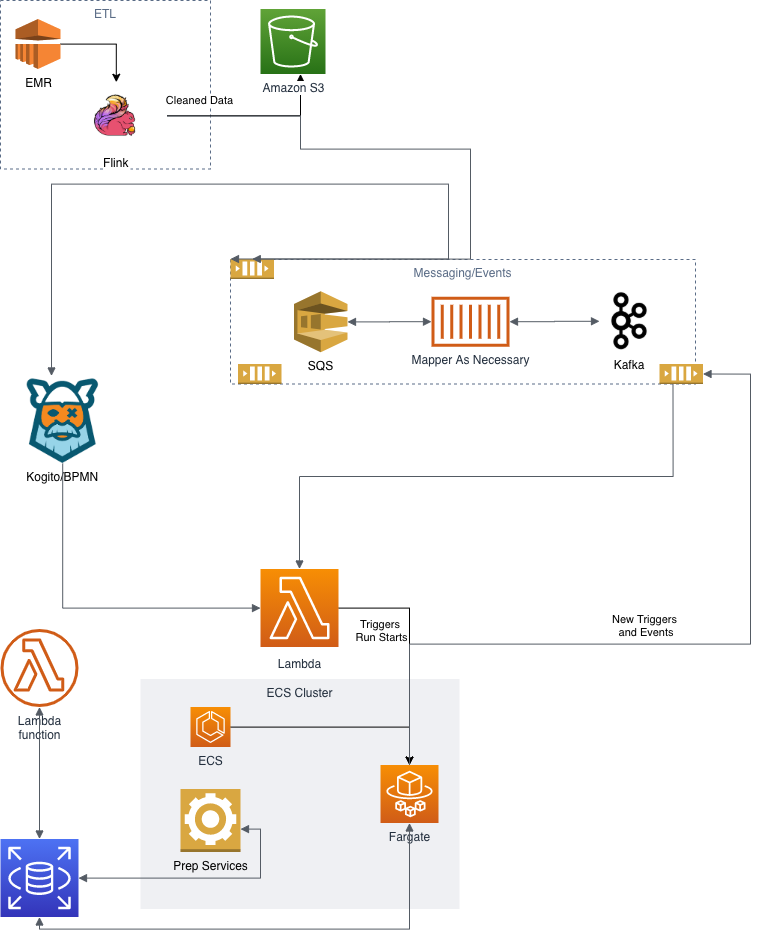
We decided to explore moving the data pipeline from AWS Glue to Python containers. We also wanted to push the limits of cost optimization with Spot. Considering the two objectives, Fargate Spot seemed like a natural fit. To make this happen we:
- We rewrote our data science ETL to pull direct from S3 rather than go through Athena or Glue. This removed the need for most of the crawling.
- We redesigned the way we stored and pulled the data to create a lower level of granularity for every routine. We modified our analysis runs to reconstruct sets from the granular data, meaning we were loading only the exact data we needed for each run, rather than whitling down a larger set as we had done in the past.
- This enabled us to dramatically reduce the memory footprint of our data science loop. Almost all our client data now could be made to fit on a 30GB Fargate instance. For those cases where there is simply too much data to fit in 30GB, we now run the exact same containers on Amazon ECS instances. We have prototyped a Dask (parallel Pandas server) deployment for even larger datasets, but found that we don’t need to add that complexity.
- We improved our scheduler and process management with better tracking and timing. We can now wait and rerun any job that fails. Although, almost none have not been able to run on Spot when we wanted. Whether or not something constitutes a timeout, meaning a run didn’t finish as planned, can be rules-based rather than one size fits all. We can now apply logical elements to determine if jobs finished successfully.
- Our current deployment is based on an architecture with Flink on EMR, Amazon ECS, AWS Fargate Spot, and S3 with a very limited amount of Athena. The schedulers are ECS tasks that are being shifted to a RedHat BPMN implementation.
The challenging parts
The Scheduler. Scheduling Spot instances on Fargate required a bit more management than before. For example, the AWS Glue jobs had a time out, so if they got stuck, the system would come around to forcibly terminate them so we wouldn’t be charged for running “stuck” jobs. However, we have to run a time-out manager in the scheduler (Kogito) with the Fargate tasks. If the time-out has passed and the task has not thrown a completion event, then the Fargate task is forcibly shut down. Likewise, we also have to monitor time-out on launch now. If Spot is not available, we switch the launch type to OnDemand Fargate. On the plus side, we can deploy much more complex rules to determine if a run is successful. With ECS and Fargate, it’s easier to pick up intermittent issues like saving to S3 and force back into the scheduler for a rerun.
Rethinking Job Failure. We did have to rethink all of our jobs to ensure that failure and termination were always recoverable and observable. The complicated issue was the occurrence of files being overwritten. If the run was partial, then we grappled with verifying the completeness of the data for analysis.
Scaling with peace of mind easily, reliably, and inexpensively
The net results allowed us to not only scale less expensively, but scale better as well. Specifically:
- Cheaper. We reduced our Cost Per Customer by almost 2/3rds, allowing us to be more aggressive with pricing while still improving our margins.
- More reliable. The resulting system was actually more reliable. The AWS Glue jobs were tricky to monitor, failed for unknown reasons, and sometimes provided obtuse error messages. The Fargate containers log better, and throw out cogent failure messages that are easier to trace.
- Easy debugging. Debugging Python containers locally, or on a dev machine is pretty straightforward. There are no endpoints to fire up and leave on, and you can step through code where necessary. We saw our development time drop significantly.
- Suited for scale. With Fargate, we can run all clients at once without having to worry about scale up, the authorized concurrent jobs, the instances available, etc.
- Minor headaches. About the only thing we have had to do is ask AWS to increase our Fargate container limit from time to time. Our scheduler is smart enough to hold jobs if we exceed the container limit. The nature of the jobs we are running makes it so that if they are slightly delayed, there is no impact on SLOs. We get alerts if it stays above threshold too long and can force runs to the ECS instances if necessary. So far, we’ve never had to.
I would be remiss not to mention that it was important during the transition process that we had good, accurate, cost management, and alerting in place. For example, one day our dev environment spun up 70 zombie Fargate containers, which were not caught by the scheduler. That’s not cheap! But we were alerted about it almost immediately, thanks to our product, so we could go in and manually shut them down, trace through the issue, and make sure that it didn’t happen again. The beauty of Fargate is that it scales very easily. But with any scalable service, you need to be careful you have sufficient monitoring in place to quickly identify a problem should one occur.