Containers
Introducing AWS App Mesh Metrics Extension
NOTICE: October 04, 2024 – This post no longer reflects the best guidance for configuring a service mesh with Amazon ECS and Amazon EKS, and its examples no longer work as shown. For workloads running on Amazon ECS, please refer to newer content on Amazon ECS Service Connect, and for workloads running on Amazon EKS, please refer to Amazon VPC Lattice.
——–
Today, we are excited to announce that the AWS App Mesh metrics extension is now generally available. With App Mesh metrics extension, customers can collect, aggregate, and filter App Mesh specific metrics that are meaningful and aid in debugging while benefiting from reduced usage costs. App Mesh metrics extension is available to all customers running workloads on Amazon Elastic Compute Cloud (Amazon EC2), Amazon Elastic Kubernetes Service (Amazon EKS), Amazon Elastic Container Service (Amazon ECS), and self-managed Kubernetes.
AWS App Mesh is a service mesh that makes it easy to monitor and control services. A service mesh is an infrastructure layer dedicated to handling service-to-service communication, usually through an array of lightweight proxies deployed alongside the application code. App Mesh standardizes how your services communicate, giving you end-to-end visibility and helping to ensure high availability for your applications. App Mesh provides consistent visibility and network traffic control for every service in an application. It also simplifies all the aspects of an observability experience, such as logs, metrics, and traces. App Mesh integrates with a variety of logging, monitoring, and tracing technologies. These include Amazon CloudWatch, Prometheus, AWS X-Ray, and Datadog.
In this blog post, we will deploy a sample application onto Amazon ECS that includes App Mesh configuration constructs. These constructs include virtual gateways, routers, services, and nodes.
For conceptual explanations of these constructs, refer to App Mesh User Guide. We will quickly review the built-in metrics generated by Envoy without the metrics extension. You will enable the metrics extension and configure more mesh-aware metrics. Additionally, you will configure filtering rules to collect only newly aggregated metrics, which will improve your experience and reduce the cost of metrics storage.
Current state and enhancements
AWS App Mesh uses a popular open-source service proxy named Envoy to provide fully managed, highly available service-to-service communication. Envoy monitors both upstream and downstream traffic and emits many statistics about its own operations as well as many dimensions of inbound and outbound traffic. These metrics are broadly classified as Upstream, Downstream, and Server (Envoy’s internal status). Visit App Mesh Envoy metrics for additional information and a complete list of Envoy metrics.
Envoy generates hundreds of metrics, each of which is broken into a few dimensions – and has a high degree of cardinality. Dimensions are a collection of data properties that describe items that are relevant to your application, such as envoy.cluster, appmesh.mesh, appmesh.virtual_node, and appmesh.virtual_gateway. These dimensions correspond to the quantitative data you want to monitor—for example, response code, retry rates, error rates, and date—in other words, the ‘keys’ in key:value pairs. Cardinality is a term that refers to the number of distinct values included within a data dimension. It is defined as the intersection of key and values. Thus, appmesh.mesh represents data with a low cardinality rate, but appmesh.virtual_node represents data with a high cardinality.
The standard built-in metrics generated by Envoy aren’t straightforward in the way they relate back to App Mesh. For example, there is no way to know for sure which virtual service is communicating with a given virtual node or a gateway. App Mesh metrics extension enhances Envoy proxies running in your mesh. This enhancement allows the proxies to generate additional metrics that are aware of the resources you define. This small subset of additional aggregated metrics will help give you insight into the behavior of your App Mesh resources. If you are not already using Envoy metrics in your daily operations, App Mesh metrics extension enables you to leverage a subset of aggregated metrics as a starting point. Additionally, if you prefer using aggregate metrics over the original Envoy metrics, you can benefit from reduced metrics storage and analysis costs.
To review the complete list of new metrics, visit the App Mesh metrics extension user guide. The App Mesh Envoy image must be at least version v1.19.1.1 in order to use the metrics extension. Refer to App Mesh documentation for instructions on how to upgrade the Envoy proxy.
Demo application overview
We’ll be launching a basic Amazon ECS-based application called “The DJ App” in this walkthrough. It is a simple application with the purpose of demonstrating how to use App Mesh metrics extension by example, without becoming a distraction in itself. It is utilized across the AWS App Mesh examples GitHub repository, allowing you to explore the content and preserve context for these demos. Additionally, the following walkthroughs are already included in the examples repo.
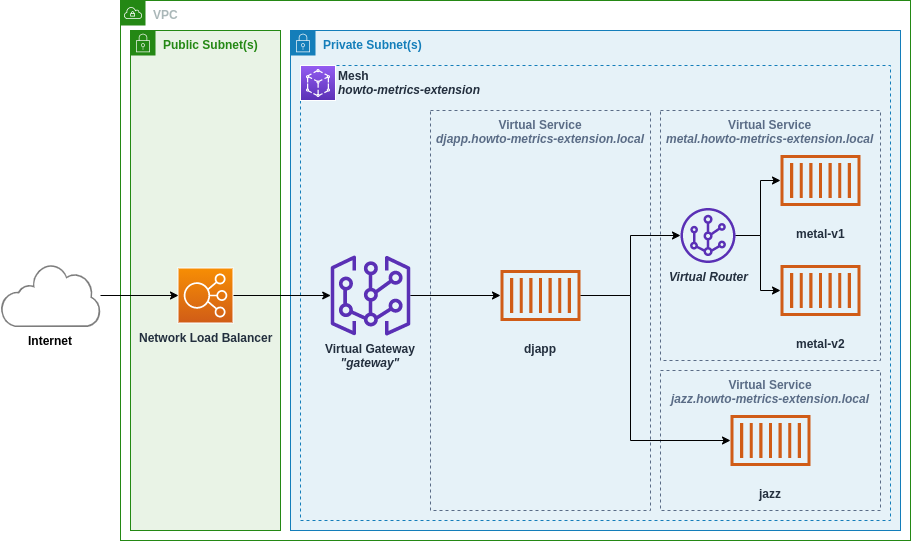
In the following diagram, you can see an illustration of a DJ App deployed with App Mesh in the namespace howto-metrics-extension. With this configuration, you can utilize App Mesh features such as metrics collection. Requests to the microservices are routed through an Envoy proxy, and the metrics gathered by Envoy proxies running alongside each microservice are sent to CloudWatch under the howto-metrics-extension namespace. To learn more about App Mesh mesh constructs and setup in detail, you can refer to the App Mesh user guide.
The DJ App returns details of the artists either metal or jazz. The application composed of four microservices dj, metal-v1, metal-v2, and jazz. The djapp service handles incoming requests from a Network Load Balancer (NLB) and routes traffic to either jazz or metal backends for artist lists. The jazz service will return artists such as Miles Davis or Astrud Gilberto, while metal-v1 and metal-v2 handles metal artists (60:40 traffic split) such as Judas Priest or Megadeth. The metal-v2 will also return the city where the artists come from along with artists first and last name.
Prerequisites
- An AWS account with admin privileges
- The AWS CLI with appropriate credentials
- Git to download repository
- cURL, a sample HTTP utility
- A Docker development environment and familiarity with using Docker
Walkthrough
The following walkthroughs deploy DJ App to an Amazon ECS cluster running within AWS along with the required objects to run the application within App Mesh. As part of the application deployment, a virtual gateway is configured as previously described along with virtual nodes, virtual services, and virtual routers. These walkthroughs can be found in the App Mesh examples repository on GitHub. Start by cloning a local copy of the repository.
git clone https://github.com/aws/aws-app-mesh-examples.git
cd aws-app-mesh-examples
The walkthrough uses AWS CloudFormation and is scripted for convenience. To use the scripts, export environment variables that will be used in the following steps to deploy your application and mesh.
export AWS_ACCOUNT_ID=$(aws sts get-caller-identity --output text --query 'Account')
export AWS_DEFAULT_REGION=<AWS region where you wish to deploy the demo, e.g. us-west-2>
export ENVOY_IMAGE=<get the latest from https://docs.aws.amazon.com/app-mesh/latest/userguide/envoy.html>
Note: The metrics extension requires the App Mesh Envoy image with a minimum version of v1.19.1.1.
Change to walkthrough directory to get started with metrics extension for Amazon ECS.
cd walkthroughs/howto-metrics-extension-ecsDeploy the DJ App
Let’s deploy DJ App, with default metrics enabled (without metrics extension).
./deploy.sh deploy djapp-v1After a few minutes, the applications will be deployed to Amazon ECS and registered in the mesh. Store the endpoint of the virtual gateway’s NLB in an environment variable named PUBLIC_ENDPOINT. Replace https://howto-Public-55555555.us-west-2.elb.amazonaws.com with the following DJ App’s load balancer URL.
export PUBLIC_ENDPOINT=https://howto-Public-55555555.us-west-2.elb.amazonaws.comDefault Envoy metrics
Once everything is running correctly, you can begin testing the application by sending queries to the djapp-v1 endpoint. Additionally, we will simulate traffic to generate metrics for Envoy. Allow a few minutes for the following code to run.
while true; do
  curl $PUBLIC_ENDPOINT;
  sleep 1;
  echo;
done
Now, log in to the CloudWatch metrics management console and select the howto-metrics-extension namespace to monitor.

As explained previously, Envoy generates hundreds of metrics that are organized within few distinct dimensions. A couple dimensions provide insight into how App Mesh constructs, such as virtual node or virtual gateway, are generated:
appmesh.meshappmesh.virtual_nodeappmesh.virtual_gateway
You can perform a search in CloudWatch for the metric envoy_cluster_upstream_rq to determine the total number of requests made by Envoy to virtual nodes in your cluster.
You may also use the metrics.sh script included in the walkthrough code to obtain snapshot images of the metrics generated during this exercise. For instance, to get a snapshot of the metrics for the last 15 minutes:
./metric.sh -m envoy_cluster_upstream_rq -x Sum -q "appmesh.mesh=howto-metrics-extension appmesh.virtual_node=djapp"
This metric shows the number of requests from virtual node djapp to virtual node metal-v2. It has the dimension envoy.cluster name and a value of cds_egress_howto-metrics-extension metal-v2_ http_8080 in the preceding screenshot. Each virtual node in the backend will result in a unique metric value, and none of these metrics will indicate the virtual service that represents the backend.
As you can see, Envoy generates a large number of metrics with few dimensions and a high degree of cardinality. Let’s look at how the metrics extension might help you generate a subset of metrics that will provide insight into how your mesh behaves in relation to the resources you define in App Mesh.
Enable metrics extension
You can enable metrics extension by setting the environment variable APPMESH_METRIC_EXTENSION_VERSION to the value 1 inside the Amazon ECS task definition. Metrics extension adds additional App Mesh native dimensions such as VirtualService, TargetVirtualService, TargetVirtualNode, along with already supported dimensions Mesh, VirtualNode, and VirtualGateay. Refer to the deploy/deploy-v2.yaml Envoy Image section to verify the APPMESH_METRIC_EXTENSION_VERSION setting.
Let us deploy djapp-v2 with metric extension enabled.
SKIP_IMAGES=1 ./deploy.sh deploy djapp-v2Allow a few minutes for the updates to complete. Let’s generate metrics using the following code.
while true; do
  curl $PUBLIC_ENDPOINT;
  sleep 1;
  echo;
done
You can log back into the CloudWatch console to verify the availability of new metrics.

To determine the number of requests handled by the gateway, run the following command:
./metric.sh -t VirtualGateway -n gateway -m envoy_appmesh_RequestCount -x Sum -q "metric_type=counter"Or to see the latency between djapp and the jazz, run:
./metric.sh -t VirtualNode -n djapp -m envoy_appmesh_TargetResponseTime -x Average -q "TargetVirtualNode=jazz metric_type=timing"With the addition of the TargetVirtualService dimension, it is easier to create rolled up dashboards. To learn more about the steps involved in creating a dashboard, visit Simplify CloudWatch Dashboards section on GitHub.
Filter metrics
App Mesh metrics extension provides a subset of useful metrics that help you see things such as traffic, latency, and error rates in the DJ App. In your scenario, the new metrics added might make some of the default Envoy metrics redundant. Depending on the use case, you can include a subset of Envoy’s original metrics along with metrics supported by the metrics extension. In these cases, you can leverage Amazon CloudWatch Prometheus scraping capabilities to filter metrics before sending them to CloudWatch. For further information, see the Prometheus scraping guide.
In this section we will deploy two separate versions of djapp—one that only includes aggregated metrics and another that includes selected Envoy metrics along with aggregated metrics. To showcase filtering features, we’ve included task descriptions for djapp-v3 and djapp-v4 in this tutorial. You can define metrics and dimensions for the CloudWatch agent within the Amazon ECS task definition in the metric_declaration section of variable CW_CONFIG_CONTENT.
Send only aggregated metrics
You can now deploy djapp-v3, which sends only aggregated metrics.
SKIP_IMAGES=1 ./deploy.sh deploy djapp-v3Wait for few minutes for updates to complete. Let us generate metrics by running the following code.
while true; do
  curl $PUBLIC_ENDPOINT;
  sleep 1;
  echo;
done
At this point, no default Envoy metrics are being sent to CloudWatch. Additionally, only the metric dimensions for which we opted in are sent. You may validate this behavior by executing metrics.sh and checking one of Envoy’s built-in metrics, such as envoy_cluster_upstream_cx_total. As a result, the command should not return any snapshots.
./metric.sh -t VirtualNode -n djapp -m envoy_cluster_upstream_cx_total -x Sum -q "envoy.cluster_name=cds_egress_howto-metrics-extension_metal-v1_http_8080 metric_type=counter"You can examine aggregated metrics also by logging into the CloudWatch console.
Include selected Envoy metrics
We’ll now deploy djapp-v4, which demonstrates how to include a subset of Envoy metrics. In this example, we’ll add envoy_cluster_upstream_cx_total to the prometheus scrape configuration. You can see that scrape configurations now include regex: ^(envoy_appmesh_.+)|(envoy_cluster_upstream_cx_total)$.
Let’s deploy updated djapp-v4 task definition.
SKIP_IMAGES=1 ./deploy.sh deploy djapp-v4Allow a few minutes for the updates to complete. Let’s produce metrics using the following code.
while true; do
curl $PUBLIC_ENDPOINT;
sleep 1;
echo;
done
Run metrics.sh again to verify that the envoy_cluster_upstream_cx_total metrics are being gathered. The graph should represent the number of TCP connections established between djapp and the metal-v1 virtual node.
./metric.sh -t VirtualNode -n djapp -m envoy_cluster_upstream_cx_total -x Sum -q "TargetVirtualNode=metal-v1"You can use the filtering examples provided in this blog article as a starting point for determining which metrics to monitor. When you want to use a subset of metrics or solely aggregated data, the filter mechanisms will help you with cost savings on metrics storage and analysis.
Cleanup
Remember to clean up any resources created for this walkthrough to prevent incurring additional fees.
./deploy.sh deleteConclusion
In this post, we showed how to use metrics extension with a sample application in Amazon ECS. All of the configuration samples featured in this post are only examples and, as such, we encourage you to take them and use them as your starting point.
AWS App Mesh metrics extension is now available on Amazon EKS. For customers running workloads on Amazon EKS, see the howto-k8s-metrics-extension examples on GitHub. Additionally, you can use metrics extension with AWS Distro for OpenTelemetry. Use deploy/djapp-v5 to learn about OpenTelemetry collection.
We will continue to add aggregated metrics to metrics extension based on your feedback. Check out the AWS App Mesh documentation for further information on how to use the service, as well as the App Mesh User Guide. You may provide feedback on this feature, review our roadmaps, and request new features on AWS App Mesh and the AWS Containers roadmap. Check out our examples project on GitHub for additional hands-on App Mesh examples.