Containers
Using Prometheus to Avoid Disasters with Kubernetes CPU Limits
“Sir, your application is continually getting throttled,” I repeated.
The highly skilled team that I was brought in to help with an outage was in disbelief. They had been using the same limits configuration in production for over two years. Yet, the Grafana chart was definitive: CPU throttling was causing the outage they were currently experiencing.
They asked what anyone in the same position should ask: How could this have happened? We followed the best practices of setting requests and limits the same, is that wrong? Should we just take off limits? What values should we be setting?
This was a pivotal moment for me. I wanted to be able to address their questions as clearly as I could and show them what the problem was. This situation led me on a journey deep into the heart of Linux and Kubernetes performance. And today, I’d like to share part of that journey with you, in the hope you might avoid such a situation.

In this post, I will explain how limits work, what metrics you can use to set the right values, and metrics for troubleshooting throttles.
Prerequisites
We will be using generic cAdvisor metrics, which are available in most monitoring platforms. If you don’t currently have a monitoring setup, then I would suggest reading our guide to setting up Amazon Managed Grafana and Amazon Managed Service for Prometheus.
Walkthrough
Understanding limits
When we configure limits, we are telling the Linux node how long a specific containerized application can run during a specific period of time. We do this to protect the rest of the workloads on a node from a wayward set of processes from taking an unreasonable amount of CPU cycles.
I choose my words carefully here to address a common misunderstanding with limits. We are not defining several physical “cores” sitting on a motherboard; however, we are configuring how much time a grouping of processes or threads in a single container can run before we want to temporarily pause the container to avoid overwhelming other applications.
If you find that statement a bit counterintuitive, you are not alone. It’s quite easy to mistake what is happening at the Kubernetes-scheduler level, which uses the concept of physical cores with the Linux CPU accounting system that operates on a highly complex set of rules that’s more nuanced.
Limits are time
Let’s use a fictitious example to ease into things. We have a single-threaded application, and this application needs exactly one second of real CPU time to complete a transaction. What are we trying to do when we configure one “core” or 1000 millicores as a limit?
If our application needed one full second of CPU time to service an application programming interface (API) call without being stopped or throttled, then we allow this application to run for 1000 milliseconds (ms) or 1 CPU second before throttling this container.
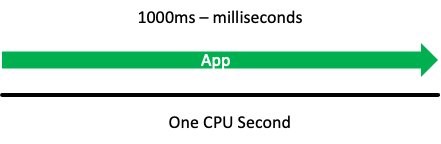
With the 1000 milliseconds being the same as one second of CPU time, this should allow us to run for one full CPU second in time, unrestricted, every second. The reality of how this works is more subtle than this, but we will get there soon.
To add some official terminology, let’s call this one CPU second a period. This is how we measure the time that passes in chunks. Next, let’s call this 1000 millicores that we are configuring in YAML the quota, which is simply how much time that we are allowed to use.
Accounting system
Limits are an accounting system that track and limit how much total vCPU a single container is using in a fixed time period. This value is tracked as a global pool of available run time that a single container is allowed to use in that period. There is a lot going on in that statement, so let’s break it down.
Going back to the concept of a period, or how often we want to turn to a new page in our ledger system, we need to allocate this time globally across more than one vCPU. That means we’ll need to break each page of the ledger into sections, called slices. The default in a Linux kernel is to cut up a period of time into 20 slices.
Now we want to run for just half the period. Easy! We configure our quota to use half of these slices. After the period elapses, this accounting system resets and the process starts over.
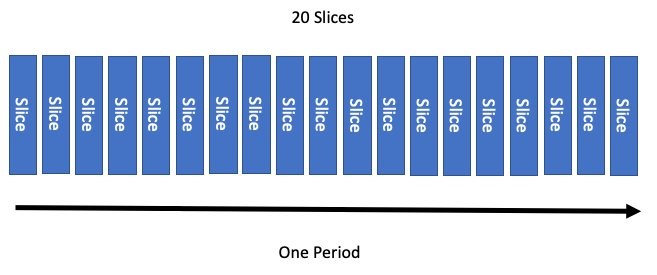
Perfect. Now we want to run for just half the period. Easy, again! We configure our quota to use half of these slices. After the period elapses, this accounting system resets and the process starts over.
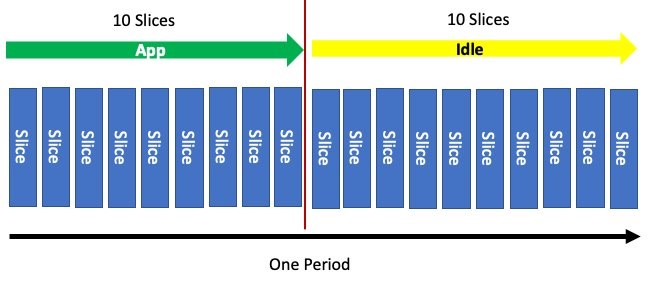
Similar to how requests or shares are converted into ratios that indicate percentage allocation of CPU, limits are also converted into a percentage. For example, if we set the quota on the container to be half the period, then we have a similar configuration.
To start, we use 1000 milliCPU (in other words, millicores) as a full share. When we configure 500 milliCPU, we are using half of the period, or 500m/1000m = 50%. If I did 200m/1000m that would be a ratio of 20% and so on. We need this conversion number to understand the output of some Prometheus metrics.
We mentioned this system of accounting was per container, so let’s look at using the container_spec_cpu_period metric in Prometheus. Here we find something interesting. Unlike our thought experiment, the real period of time associated with the container is 100 ms.

Linux has a setting called cpu.cfs_period_us that sets how long a period runs before we turn to a new page in the ledger. This value is how long in microseconds (us) of real time passes before the next period is created. These Linux metrics are turned into the Prometheus metrics via the cAdvisor daemonset.
Putting aside some advanced use cases, the amount of time that passes before we turn the ledger page isn’t quite as important as how many slices the period of time CPU usage is limited to.
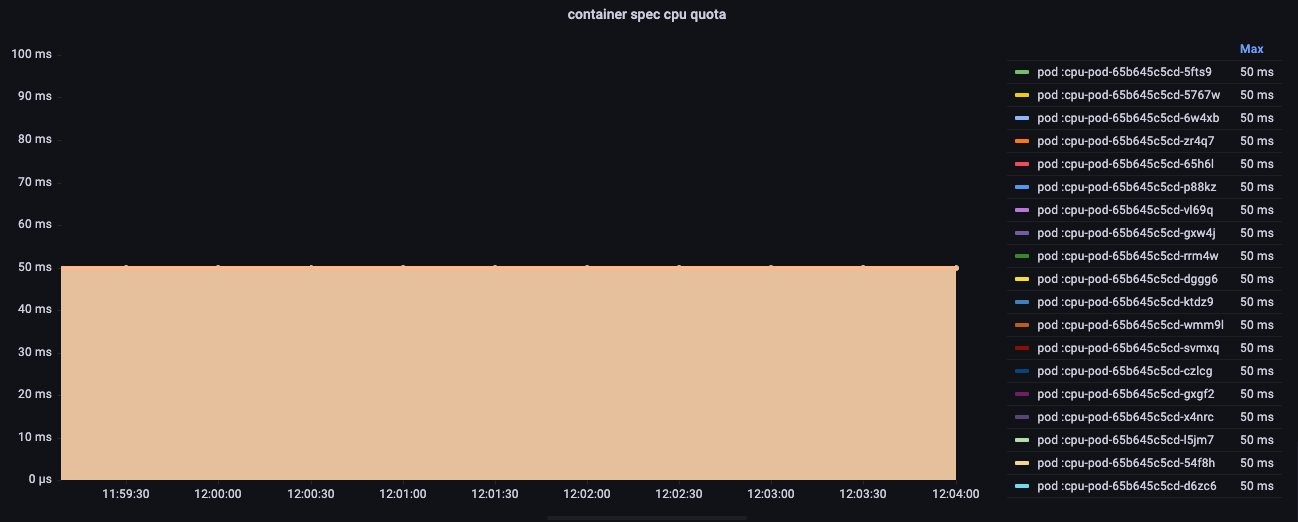
With that bit of knowledge under our belt, let’s look at the quota values for our container settings using the cpu.cfs_quota_us metric. Here we see the value 50 milliseconds (i.e., half of the 100 ms period has been configured). So far, so good.
Containers have threads
Containers often have multiple threads and process in them, with the capacity to have hundreds depending on the language.
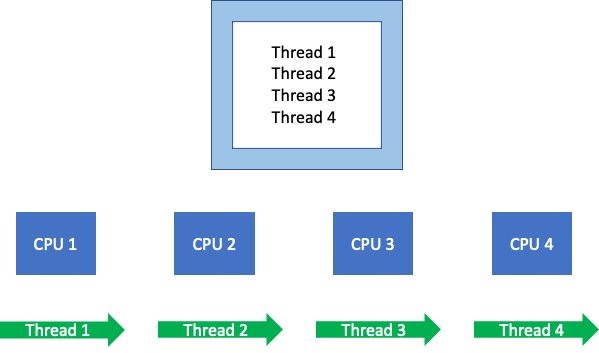
When these threads/processes run, they schedule on different available vCPUs. Linux’s accounting system needs to keep track of what’s using these vCPUs globally, which is then added to the ledger.
Putting the period concept aside for a minute, let’s use the container_cpu_usage_seconds_total metric to track how many vCPUs were actively processing this one application’s threads over one full second in real time. We get a value of four vCPU seconds used, with the assumption that the threads ran for the full second on each of the four vCPUs.
What if we said the total bill could be no more than one vCPU second? In that circumstance, we throttle this application’s other threads running on the node in that timeframe. This happens in almost every production cluster I’ve worked on, so I think it’s worth our time to understand the global nature of this accounting system.
Global accounting
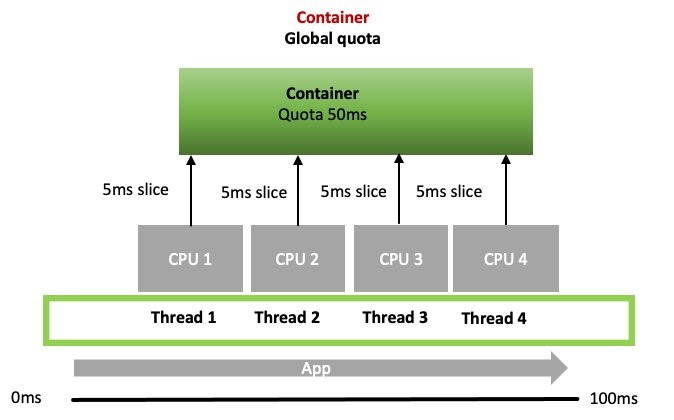
Remember how we discussed breaking the time into slices so we could allocate that time globally across more than one vCPU? Let’s return to our four threads on four vCPU’s example so we can understand how that’s done.
When a CPU wants to run a thread or process in its queue., it confirms if the process is allowed by asking for a 5 ms slice from the global quota set on the container. If the container’s global quota has enough time to allocate a slice, then the thread runs. If it doesn’t, then the process is throttled and waits for the next period.
The real world
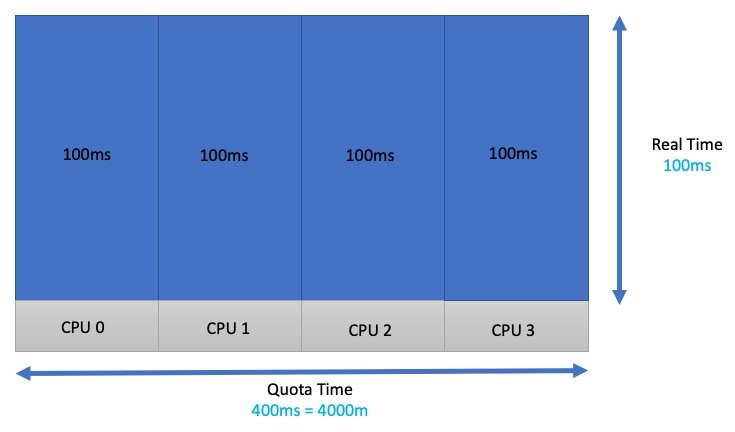
Let’s do another thought experiment. If I had four threads, and each of those threads wanted 100 ms of real CPU time to complete a task, then I would need to add all that time up for each vCPU. This would give us a total of 400 ms or 4000 m. I have configured a limit for this process that avoids throttling!
Unfortunately, workloads don’t look like this in the real world. These functions and threads might be running a heavy or light API call. The time the application needs varies, and it would be dangerous to think of it as something that is fixed. Taking that a bit further, maybe not all four threads need a vCPU right now because a few are waiting for a database lock or something to that effect.
Because of this, workloads that tend to burst a great deal and are latency sensitive are not always good candidates for limits. Fortunately, a new feature called cpu.cfs_burst_us (burstable completely fair scheduler [CFS] bandwidth controller) allows us to carry over some of their unused quota from one period to the next. However, at the time of this writing, this feature is still making its way into Kubernetes.
Interestingly, this isn’t where most customers get themselves into trouble. Let’s say we just guessed our application and testing requirements, and 1 CPU core sounds about right (come on, we’ve all done it). That container’s application threads are going to get spread out over four vCPUs. This has the effect of dividing the global quota of 100 ms/4 or 25 ms of runtime per thread.
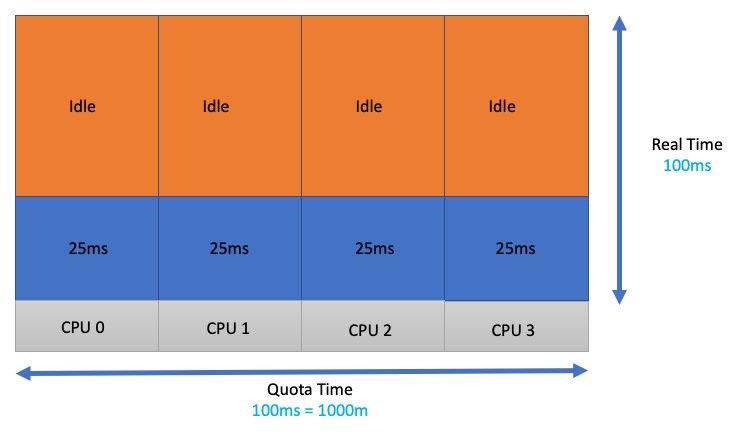
Each thread wanted (100 ms of quota) * (four threads) or 400 ms of quota. During the 100 ms that elapsed in the real world, we lacked 300 ms of accounting time or quota. Consequently, those threads got throttled for 300 ms.
Latency
Let’s look at the impact of all this from an application point of view. A single threaded application takes 100 ms in the real world time to complete. When we configure the quota to 100 ms or 1000 m/1000 m = 100%. Therefore, we have the protection of a limit in place, but no throttling!

In this second example, we are going to guess wrong and set the limits to 400 m or 400 m/1000 m = 40%. This gives us 40 ms of quota in a 100 ms accounting period. Look at the impact this has on the latency of the application.
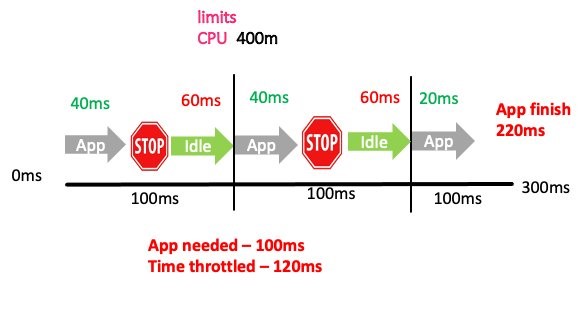
We more than doubled the time (220 ms) it took to process the same request! The application throttled two out of the three total accounting periods. In two of these periods, the application was throttled for 60 ms of real time. Importantly, that vCPU time might have even gone unused if no other threads were in the run queues waiting to be processed. This would have the effect of application slowness, but low CPU utilization, which is a confusing problem if you didn’t know what to look for.
This brings us to one of the most common metrics you see associated with limits, container_cpu_cfs_throttled_periods_total. This metric gives you how many periods were throttled versus the total periods available container_cpu_cfs_periods_total. In our case, that’s 2 out of 3 (66%) throttled.
That’s useful, but how would I find out that I needed to add 60 ms?
Throttled seconds
Luckily, we have a cAdvisor metric called container_cpu_cfs_throttled_seconds_total, which adds up all those throttled 5 ms slices and gives us an idea how far over the quota the process is. This metric is in seconds, so we divide the value by 10 to get 100 ms, which is the same as our period.
Don’t worry if you don’t know PromQL. In this post, I used Prometheus and here is what I’m using to look at the top three pods CPU usage over a 100 ms time.
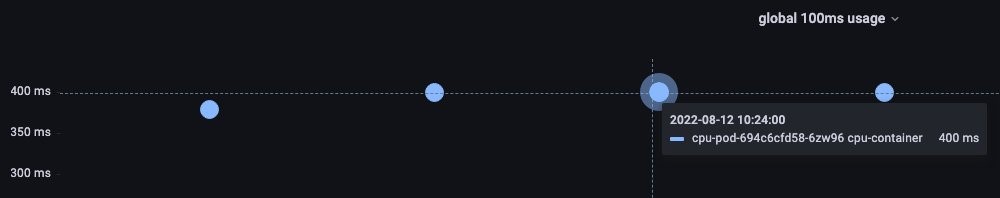
Let’s set up things like the thought experiment: Four threaded application that wants 400 ms of CPU time every 100 ms of time passing in the real world.
A value of 400 ms of vCPU usage is observed.
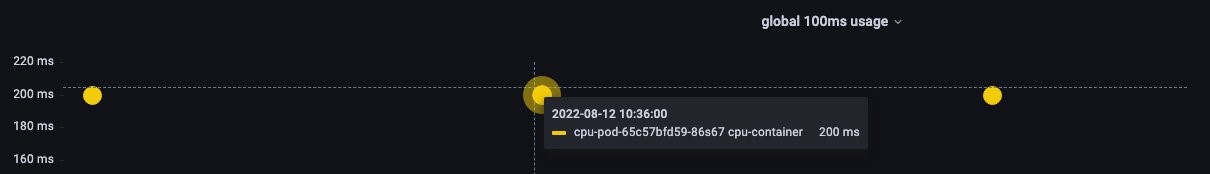
Now we limit this container to half the time it needs to run.
Here we see the total CPU usage reduce by half in the 100 ms of real time, which is what we expected.
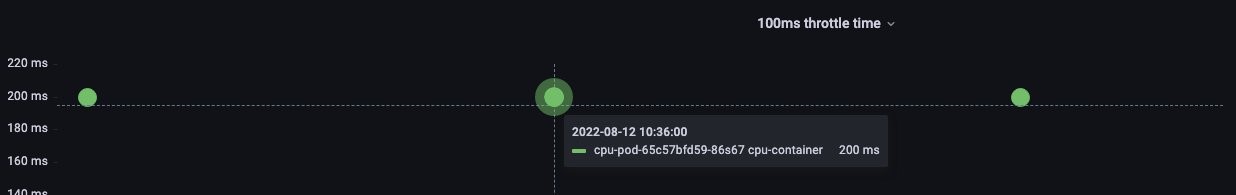
PromQL gives us a per second throttling, with 10 periods in a second. To get the per period throttling, we divide by 10. If we want to know how much to increase the limits setting, then we can multiple by 10 (e.g., 200 ms * 10 = 2000 m).
You could simply not divide by 10 and use some trickery in Grafana to call it millicores, but I’ll leave that up to you.
If you want a quick way to set limits to something reasonable, then the examples that I provided in this post should provide some helpful examples.
Please note that this example is contrived. Things like the container resource allocation, which we call requests, is another layer on top of all this complexity that can affect production.
Conclusion
In this post, I showed you how limits work, what metrics you can use to set the right values, and metrics for troubleshooting throttles. I like to think of limits as a safety net of sorts. There are certain situations (such as multi-tenant) where a safety net is necessary and Prometheus is a great tool to help you set something reasonable. If this solution helped you, I would love to hear your story! Feel free to reach out at shancor@amazon.com or on Linkedin.