Containers
Category: Amazon Managed Service for Prometheus
Deploy production generative AI at the edge using Amazon EKS Hybrid Nodes with NVIDIA DGX
This post demonstrates a real-world example of integrating EKS Hybrid Nodes with NVIDIA DGX Spark, a compact and energy-efficient GPU platform optimized for edge AI deployment. In this post we walk you through deploying a large language model (LLM) for low-latency generative AI inference on-premises, setting up node monitoring and GPU observability with centralized management through Amazon EKS.

Monitoring Windows pods with Prometheus and Grafana
This post was co-authored by Cezar Guimarães, Sr. Software Engineer, VTEX Introduction Customers across the globe are increasingly adopting Amazon Elastic Kubernetes Service (Amazon EKS) to run their Windows workloads. This is a result of customers figuring out that refactoring existing Windows-based applications into an open-source environment, while ideal, is a very complex task. It […]

Using Prometheus to Avoid Disasters with Kubernetes CPU Limits
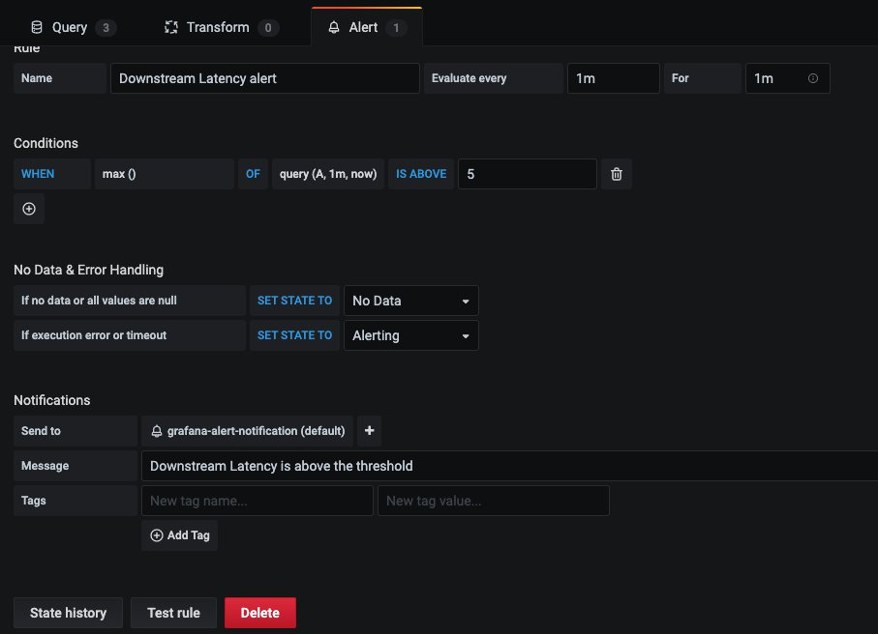
“Sir, your application is continually getting throttled,” I repeated. The highly skilled team that I was brought in to help with an outage was in disbelief. They had been using the same limits configuration in production for over two years. Yet, the Grafana chart was definitive: CPU throttling was causing the outage they were currently […]

Monitoring Amazon EKS Anywhere using Amazon Managed Service for Prometheus and Amazon Managed Grafana
This blog provides a step-by-step guide on how to monitor your containerized workload running on Amazon EKS Anywhere by publishing metrics to Amazon Managed Service for Prometheus and using Amazon Managed Grafana to visualize. Amazon EKS Anywhere is a deployment option for Amazon EKS that enables you to easily create and operate Kubernetes clusters on a customer-managed […]
Monitoring your service mesh container environment using Amazon Managed Service for Prometheus
NOTICE: October 04, 2024 – This post no longer reflects the best guidance for configuring a service mesh with Amazon ECS and Amazon EKS, and its examples no longer work as shown. For workloads running on Amazon ECS, please refer to newer content on Amazon ECS Service Connect, and for workloads running on Amazon EKS, […]