Containers
Monitoring Amazon EKS Anywhere using Amazon Managed Service for Prometheus and Amazon Managed Grafana
This blog provides a step-by-step guide on how to monitor your containerized workload running on Amazon EKS Anywhere by publishing metrics to Amazon Managed Service for Prometheus and using Amazon Managed Grafana to visualize.
Amazon EKS Anywhere is a deployment option for Amazon EKS that enables you to easily create and operate Kubernetes clusters on a customer-managed vSphere environment (or bare metal coming in 2022). EKS Anywhere provides an installable software package for creating and operating Kubernetes clusters on premises and automation tooling for cluster lifecycle support. EKS Anywhere brings a consistent AWS management experience to your data center, building on the strengths of Amazon EKS Distro, an open-source distribution for Kubernetes used by Amazon EKS.
Solution overview
The following figure illustrates the overall architecture of setting up a Prometheus server on your EKS Anywhere cluster and Amazon Managed Service for Prometheus alongside Amazon Managed Grafana on AWS Cloud:
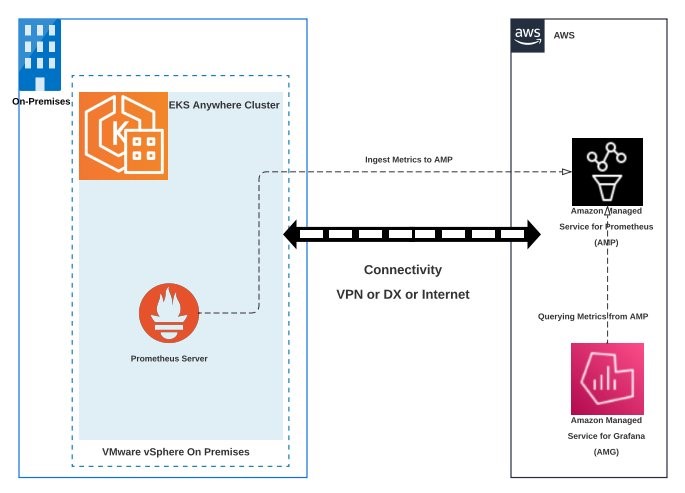
Customers choosing to run EKS Anywhere on their infrastructure would like to access AWS services in their nearby geography for various needs such as storage, observability, or AI enablement. In order to achieve network connectivity between customer infrastructure and the AWS Cloud, the following connectivity options are available:
- AWS Direct Connect allows you to establish dedicated connections from on-premises to AWS. With Direct Connect, you can bypass the internet, which often reduces network costs, improves bandwidth throughput, and provides a more consistent network experience. You can request 1 or 10 or 100 Gbps connections directly from AWS, which currently supports a public virtual interface.A public virtual interface can access all AWS public services using public IP addresses. This is the most recommended approach.
- Direct access to AWS services over the public internet whitelisting on-premises network security posture for endpoints and IPs of AWS services.
- AWS VPN allows you to create IPsec site-to-site VPN tunnels from an Amazon Virtual Private Cloud (Amazon VPC) to an on-premises customer gateway enabling a hybrid environment. This approach requires more complex networking configurations such as VPC endpoints on Amazon VPC, forwarding of all on-premises DNS queries related to accessing AWS services to AWS, Route 53 inbound endpoints, Route 53 resolver rules, and so on.
Once one of the above networking options is adopted, the next step to access AWS services is to authenticate with AWS using IAM. EKS IAM roles for service account (IRSA) enables applications running in clusters to authenticate with AWS services using IAM roles. In order to enable IRSA for your EKS Anywhere cluster, you should be creating your own OIDC provider for the cluster and hosting your cluster’s public service account signing key. The public keys, along with the OIDC discovery document, should be hosted somewhere that AWS Security Token Service (AWS STS) can discover them. Please check the page IAM for Pods configuration for more information on setting up IRSA on your EKS Anywhere cluster.
Next, customers running EKS Anywhere might use Prometheus for monitoring their Kubernetes cluster and would like to use Grafana as one of the options to visualize the metrics. Prometheus is a popular open-source monitoring tool that provides powerful querying features and has wide support for a variety of workloads. Amazon Managed Service for Prometheus is a fully managed Prometheus-compatible AWS service that makes it easier to monitor environments, such as Amazon EKS, Amazon Elastic Container Service (Amazon ECS), and Amazon Elastic Compute Cloud (Amazon EC2), securely and reliably. Amazon Managed Grafana is a fully managed and secure data visualization service for open-source Grafana that enables customers to instantly query, correlate, and visualize operational metrics, logs, and traces for their applications from multiple data sources. Amazon Managed Grafana integrates with multiple Amazon Web Services (AWS) security services and supports AWS Single Sign-On (AWS SSO) to offer single sign-on for accessing the Grafana console in your Amazon Managed Grafana workspace, manage access control, search data, and build visualizations.
Solution walkthrough
Prerequisites
To deploy this solution, you must complete the following prerequisites:
- An administrative machine configured to have AWS CLI admin access for accessing AWS services
- Fully accessible EKS Anywhere cluster from administrative machine
- IRSA set up on your EKS Anywhere cluster
- Install the following tools on the administrative machine
Let’s start by setting a few environment variables:
To create an Amazon Managed Service for Prometheus workspace, use the following AWS CLI command:
Remote write metrics to Amazon Managed Service for Prometheus
Please run the commands in the following code snippet. The following actions will result:
- Creates an IAM role with an IAM policy that has permissions to remote write into an Amazon Managed Service for Prometheus workspace.
- Creates a Kubernetes service account that is annotated with the IAM role.
- Creates a trust relationship between the IAM role and the OIDC provider hosted in your Amazon EKS-A cluster.
Amazon Managed Service for Prometheus does not directly scrape operational metrics from containerized workloads in a Kubernetes cluster. It requires users to deploy and manage a standard Prometheus server in their cluster to perform this task.
Execute the following commands to deploy the Prometheus server on the EKS cluster:
Create a file called amp_ingest_override_values.yaml with the following content in it. If you are using a version of Prometheus earlier than 2.26.0, please follow this documentation under the section using older versions of Prometheus.
Execute the following command to install the Prometheus server configuration and configure the remoteWrite endpoint.
AWS Single Sign-On (AWS SSO)
To use Amazon Managed Grafana in a flexible and convenient manner, we chose to use AWS Single Sign-On (AWS SSO) for user management. AWS SSO is available once you’ve enabled AWS Organizations manually, or it is auto-enabled while setting up AWS Control Tower.
Amazon Managed Grafana integrates with AWS SSO to provide identity federation for your workforce. Using Amazon Managed Grafana and AWS SSO, users are redirected to their existing company directory to sign in with their existing credentials. Then, they are seamlessly signed in to their Amazon Managed Grafana workspace. This ensures that security settings such as password policies and two-factor authentication are enforced. Using AWS SSO does not impact your existing IAM configuration.
Create Amazon Managed Grafana workspace and query metrics from Amazon Managed Service for Prometheus workspace
You can easily spin up on-demand, auto scaled Grafana workspaces (virtual Grafana servers) that enable you to create unified dashboards across multiple data sources. Before we can use Amazon Managed Grafana for the following example, we need to set it up. In the following example, we’re using the AWS console to walk you through the required steps and comment on things to consider when performing each step.
After you select the Create workspace button in the right upper corner of the Amazon Managed Grafana console landing page, give your new workspace a name and, optionally, a description:

In this step, you also have to enable AWS Single Sign-On (AWS SSO) for Amazon Managed Grafana since this is how we manage user authentication to Grafana workspaces. Also, choose Service managed as the permission type:

In the next screen, please select the following data sources and SNS as the notification channel. Then select Next.

In the next screen, select Create workspace without any selections to create the Amazon Managed Grafana workspace.
By default, the AWS SSO user has Viewer permissions. Since we will be adding new data sources and creating a dashboard in Amazon Managed Grafana, you want to update the user type as admin. Under the Authentication tab, select the Configure users and user groups button, select the SSO user you want to use to sign in to Grafana, and select the Make admin button, as shown in the following screenshot:

Query metrics from Amazon Managed Service for Prometheus workspace
- In the Summary section, select the Grafana workspace URL. This will take you to the AWS SSO sign-in screen, where you can provide the UserId and Password of your configured SSO user.
- Once you’re signed in to the Amazon Managed Grafana console, navigate to the Configuration (gear) section on the left navigation bar. Select Data sources to add the Amazon Managed Service for Prometheus datasource.
On the right, select the Add data source button and select Prometheus, as shown in the following screenshot:

Configure Prometheus data source:
- In Name, let’s add
AMPDataSourceor any name you prefer. - In URL, add the Amazon Managed Service for Prometheus workspace remote write URL from Workload Account A without the
api/v1/remote_writeat the end. - Enable
SigV4auth. - Under the
SigV4AuthDetails section:- For Default Region, choose the Region where you created the Amazon Managed Service for Prometheus workspace
- Select the Save and test You should receive the notification
data source working.


You will notice that the Amazon Managed Service for Prometheus data source is authenticated through SigV4 protocol. Grafana (7.3.5 and above) has the AWS SigV4 proxy built-in as a plugin, which makes this possible
- Now choose Explore from the left navigation bar to query metrics and enter the following query in the text box:
apiserver_current_inflight_requests. Please refer to EKS Control Plane in the EKS Best Practices Guides to learn more about the Amazon EKS control plane metrics you can monitor using Prometheus to proactively understand the performance of your Amazon EKS cluster. - You will receive a screen similar to the one in the following screenshot, which shows that we are able to successfully query metrics from the EKSA cluster through the Amazon Managed Service for Prometheus workspace:

You can also import the existing dashboard by selecting the plus (+) sign on the left navigation bar.
- Select Import.
- In the Import screen, type “3119” in the Import via grafana.com textbox and select Import.
- From the dropdown at the bottom, select AMPDataSource and select Import.

Once complete, you will be able to confirm the Grafana dashboard is presenting metrics from the EKSA cluster through the Amazon Managed Service for Prometheus data source, as shown in the following screenshot.

Clean up
Use the following commands to clean up the created AWS resources for this demonstration:
Finally, navigate to the Amazon Managed Grafana console to delete the created Amazon Managed Grafana workspace.
Conclusion
In this blog post, we demonstrated how to set up Amazon Managed Grafana to retrieve metrics from Amazon Managed Service for Prometheus to retrieve metrics from container workloads running on your EKS-A Anywhere cluster in a customer-managed datacenter. If you are looking to learn more about EKS Anywhere, please check out the EKS Anywhere Frequently Asked Questions.