Desktop and Application Streaming
Analyze access patterns in Amazon WorkSpaces
Customers regularly ask how to analyze access patterns in Amazon WorkSpaces. Administrators seek to understand how users are accessing Amazon WorkSpaces so they can provide an outstanding overall experience. For example, granular information about access patterns helps plan maintenance windows, forecast network capacity requirements, and set priorities of WorkSpaces client updates.
Centrally collecting WorkSpaces events across AWS Regions can provide insights into user access patterns. Analyzing these events helps you answer questions like:
- “How are users connecting to WorkSpaces?”
- “What client platforms are customers using?”
- “Are my customers accessing WorkSpaces from our corporate network, or remotely?”
- “At what time each day are the majority of users connecting?”
You can also use this data for auditing purposes to validate how often and at what time-specific remote workers are logging into their WorkSpaces.
In this blog post, I show you how to use Amazon CloudWatch, Amazon Kinesis, Amazon Athena, and Amazon QuickSight to analyze and visualize access patterns of your WorkSpaces users.
The following diagram shows ingestion of WorkSpaces login events in the solution we deploy in this blog:
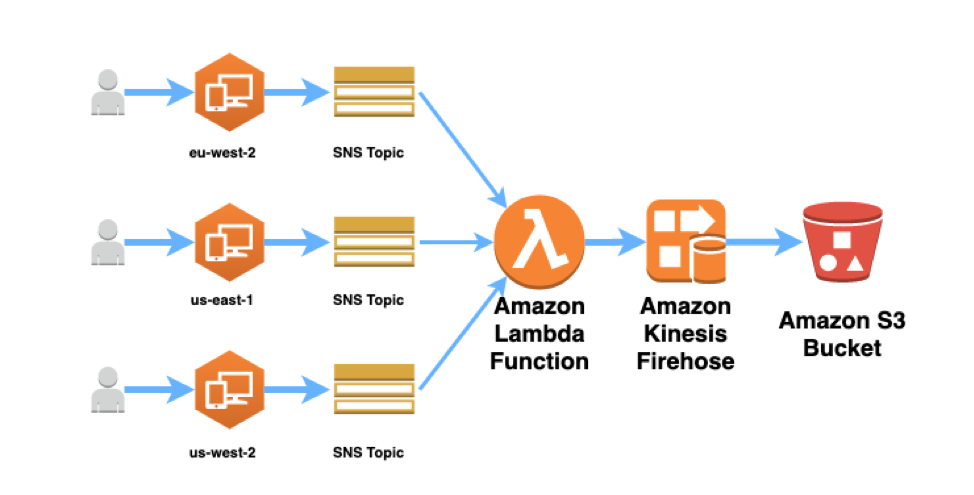
The diagram shows collection of login events across multiple AWS Regions; this is an optional configuration. The solution can be deployed in a single AWS Region.
The ingestion steps are as follows:
- Successful logon to a WorkSpace generates a CloudWatch event (review how to monitor your WorkSpaces using CloudWatch Events).
- A CloudWatch rule then publishes a message to an Amazon SNS topic, which has an AWS Lambda function as a subscriber. All SNS topics have the same, central Lambda function as a subscriber.
- The Lambda function can transform the CloudWatch event data. The Lambda function then publishes this data into a Kinesis Data Firehose stream.
- Kinesis Data Firehose writes the data into an Amazon S3 bucket in batches (after 60 seconds or 5 MB of data collected, whichever comes first).
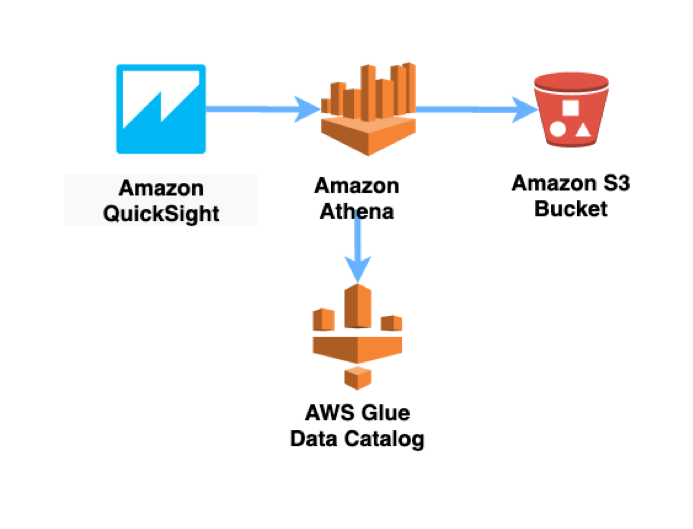
Querying is handled by Amazon Athena and an AWS Glue Data Catalog. The data is visualized though an Amazon QuickSight dashboard.
Prerequisites:
- An AWS environment with Amazon WorkSpaces configured
- Because we are collecting WorkSpaces access data, create multiple WorkSpaces test users to validate the solution.
- An AWS account that has permission to create IAM roles and policies.
- An S3 bucket. This bucket stores query results from Athena.
Walkthrough
I’ve provided two AWS CloudFormation templates that create the ingestion components shown in the previous diagram. First, we deploy the primary stack.
- Download the WorkSpaces access analysis AWS CloudFormation template.
- Visit the AWS CloudFormation console in the region of your choice.
- Choose Create stack and then choose With new resources (standard).
- On the Create stack page, select Upload a template and then choose the template you downloaded in step 1. Choose Next.
- Provide a unique name for an S3 bucket. The bucket is used to store WorkSpaces access event data. Choose Next.
- Choose Next on the Configure stack options page.
- Select the following check box:
- I acknowledge that AWS CloudFormation might create IAM resources.
- Choose Create stack – The stack deploys in approximately 4 minutes and creates the following resources:
- A CloudWatch rule. This CloudWatch rule capturesWorkSpace login events in the primary AWS Region. Each login generates a successfulLogin event.
- An SNS topic that receives CloudWatch Events for successfulLogin.
- A Lambda function that can transform and enrich the successfulLogin event
- A Kinesis Data Firehose data stream
- An S3 bucket that stores access event data
- IAM roles and policies necessary for the preceding resources
- Verify that the stack has a status of CREATE_COMPLETE.
- log into any WorkSpace in the current AWS Region to generate a successfulLogin CloudWatch event.
- Connecting to WorkSpaces from different locations and different devices generates richer data.
(Optional) You can also capture WorkSpaces login events in other AWS Regions by deploying a second AWS CloudFormation template. Download the WorkSpaces access analysis AWS CloudFormation template for a secondary region. For this template, you must provide the ARN for the Lambda function you deployed in the primary stack: the ARN is available under “Outputs” in the primary stack.
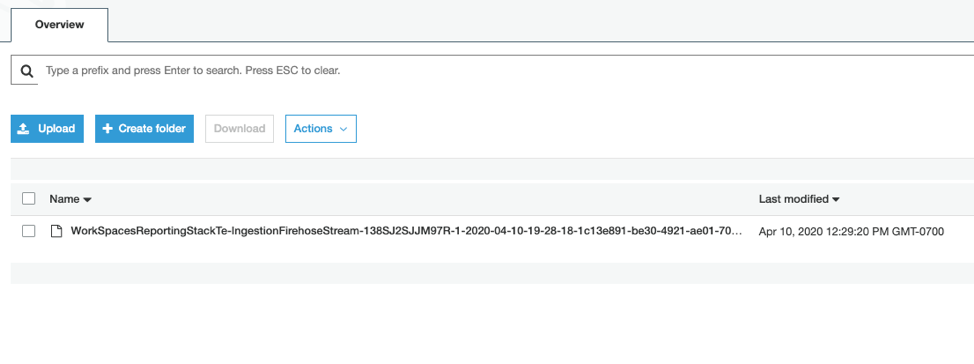
About 60 seconds after logging into a WorkSpace, you should see data written into your S3 bucket under the prefix workspacesAccessLogs/<YEAR>/<MONTH>/<DAY/<HOUR>.
Note: You can transform the data in the event before it reaches the S3 bucket. Add code to the Python Lambda function that was deployed by the primary stack. For example:
- Convert the loginTime field to a different time format.
- Add a user name field to the event by querying a DynamoDB table in which you have a mapping between WorkSpace ID and user name.
Now that you’ve validated that you’re collecting data for WorkSpaces login events, query those events using Amazon Athena.
Analyzing and visualizing access data
In Athena, we create and run queries against the login event data we are collecting.
- Open the Athena console.
- If this is your first time visiting the Athena console:
- Choose Get Started to open the Query Editor.
- If this is your first time visiting the Athena console:
- Choose Set up a query result location in Amazon S3.
- Enter the path to the bucket that you created in Amazon S3 for your query results (described in the prerequisites). Prefix the path s3://. Add a forward slash to the end of the path. Choose Save.
- In the Athena Query Editor, enter the following query, to see a sample of 10 login events:
SELECT DISTINCT id,
detail.loginTime,
detail.clientPlatform,
detail.workspaceId,
detail.directoryId,
detail.clientIpAddress,
region
FROM "workspaces_access_dashboard_db"."workspaces-access-events"
limit 10; - Choose the plus (+) sign in the Query Editor to create a tab with a new query.
- In the new tab, enter another query to count how many login events we have for different client platforms (that is, how many login events were generated from Windows, macOS, Linux, etc. clients):
SELECT detail.clientPlatform,
count(*) cnt
FROM "workspaces_access_dashboard_db"."workspaces-access-events"
GROUP BY detail.clientPlatform
ORDER BY cnt desc;
Building Amazon QuickSight dashboards
Before continuing, make sure that Amazon QuickSight has access to the S3 bucket that contains your WorkSpaces login data (you can configure access under “Security & permissions” here ).
- To start, launch into Amazon QuickSight – https://quicksight.aws.amazon.com/sn/start.
- Confirm that you are in the correct AWS Region. If not, you can switch to the correct Region by selecting it from the dropdown menu on the top right.
- Choose Datasets.
- Choose New dataset from the top right.
- Create a new Athena Data Source and provide a name.
- Select the workspaces_access_dashboard_db database and the workspaces-access-events table.

- Choose Use custom SQL.
- Enter the following SQL query:
SELECT DISTINCT
id,
account,
region,
detail.loginTime,
detail.clientPlatform,
detail.workspaceId,
detail.directoryId,
detail.clientIpAddress
FROM"workspaces_access_dashboard_db"."workspaces-access-events"
limit 10; - Choose Import to SPICE for quicker analytics
- Choose Visualize
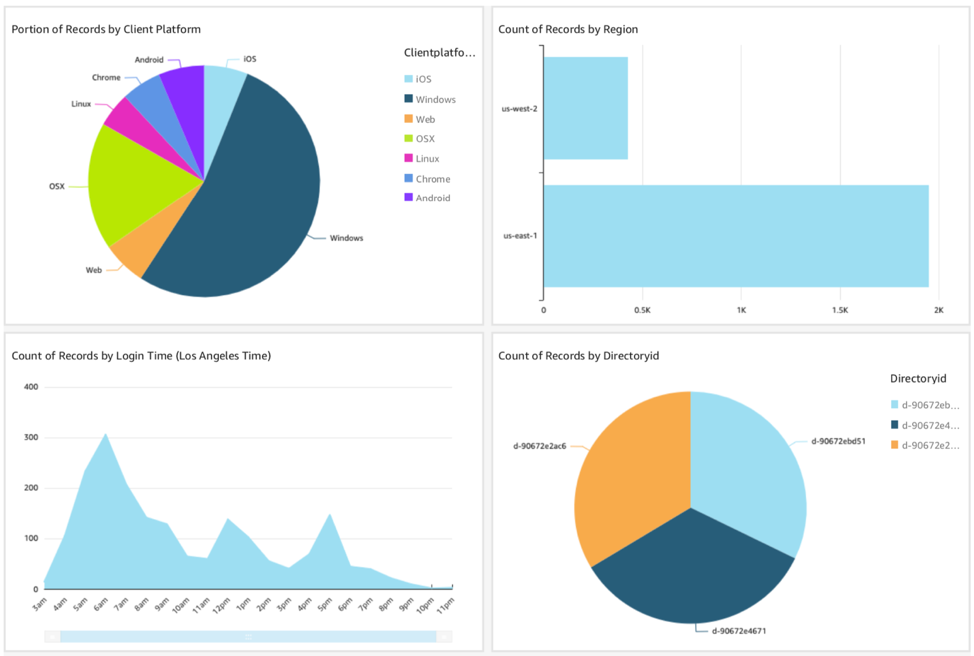
- To create your first visualization, select “clientplatform” under Field list on the left panel. Then select the Pie chart under Visual types. This shows the portion of users connecting from different types of client platforms:

- You could create a similar visualization for Directory IDs (use the “directoryid” field) to show the portion of connections from each directory you have registered in WorkSpaces.
- (Optional, if you’re collecting events across several AWS Regions) On the top left, select the Add button to add a new visualization. Then select Region under Field list on the left panel. Select Horizontal bar chart under Visual types. This shows the number of connections from each AWS Region where you have WorkSpaces deployed:

- Select the Add button again to add a final visualization.
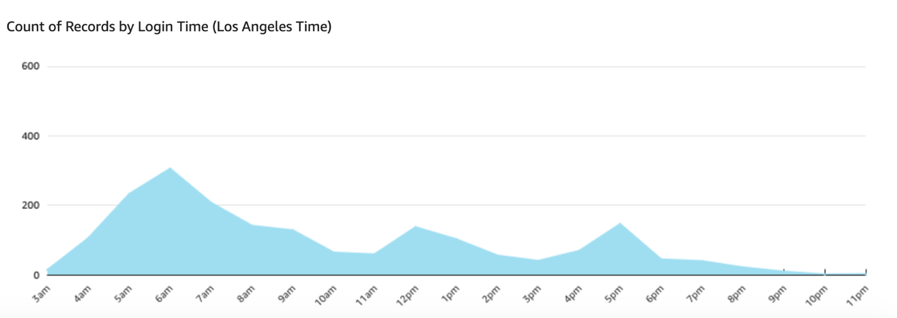
- Select logintime under Field list on the left panel, and the Stacked area line chart under Visual types. On the top under Field wells, select “logintime” and aggregate by hour. This visualization shows the number of successfulLogin events during each hour of the day:
Clean up
To remove resources created in this blog:
- Empty the contents of the S3 bucket containing your WorkSpaces login data.
- Delete the CloudFormation stacks you deployed (in the primary Region and other Regions).
- In Amazon QuickSight, delete the Athena dataset and delete the Analysis you created.
Conclusion
You can analyze access patterns in Amazon WorkSpaces by centrally collecting WorkSpaces events across regions to provide insights into user’s access patterns. For example, you can discover the most popular client platforms, if users are connecting primarily from your corporate network/externally and the login activity level at different times of the day.
Amazon WorkSpaces generates successfulLogin CloudWatch Events (review how to monitor your WorkSpaces using CloudWatch events). You can add additional metadata to these events by calling external data sources using a Lambda function. For example, you could query a DynamoDB table to map a WorkSpace ID to a user name.
After centrally collecting these events in Amazon S3, you can query and visualize your WorkSpaces login data in a serverless manner using Athena and Amazon QuickSight.