AWS Developer Tools Blog
AWS Toolkit in JetBrains Rider
The AWS Toolkits for different IDEs are built to support a vast array of use cases and developer preferences so there’s almost always a tool for the IDE you use; e.g. JetBrains Rider, IntelliJ IDEA, JetBrains PyCharm, Microsoft’s VS Code, or Visual Studio. Developers tend to be attached to their preferred IDE and thus AWS Toolkits, such as the AWS Toolkits for JetBrains Rider make it easier to build on AWS from their IDE. The AWS Toolkit for Rider is an open source plugin for the Rider IDE that makes it easier to create, debug, and deploy .NET applications on Amazon Web Services. JetBrains Rider is a multi-platform .NET IDE that supports developing .NET, ASP.NET, .NET Core, Xamarin, and Unity applications on Windows, Mac, and Linux, and is based on JetBrains’ well-established Java editor, IntelliJ IDEA and also incorporates functionality reserved for the ReSharper extension.
The AWS Toolkit for Rider is an open source plug-in for the Rider IDE that makes it easier to create, debug, and deploy .NET applications on Amazon Web Services.
JetBrains Rider is a multi-platform .NET IDE that supports developing .NET, ASP.NET, .NET Core, Xamarin, and Unity applications on Windows, Mac, and Linux, and is based on JetBrains’ well-established Java editor, IntelliJ IDEA and also incorporates functionality reserved for the ReSharper extension.
In this Blog we are going to display how to setup the AWS Toolkit for JetBrains Rider and dive in details into specific examples of using AWS Lambda to build serverless applications.
If you don’t already have Rider, you should download a 30-day trial version and give it a test-drive.
Once you are running Rider, the next step is to install the Toolkit.
Getting Started
Installing the toolkit is done through the IDE.
- Open Rider.
- Select Configure on the splash screen
- Select Plugins from the drop-down menu
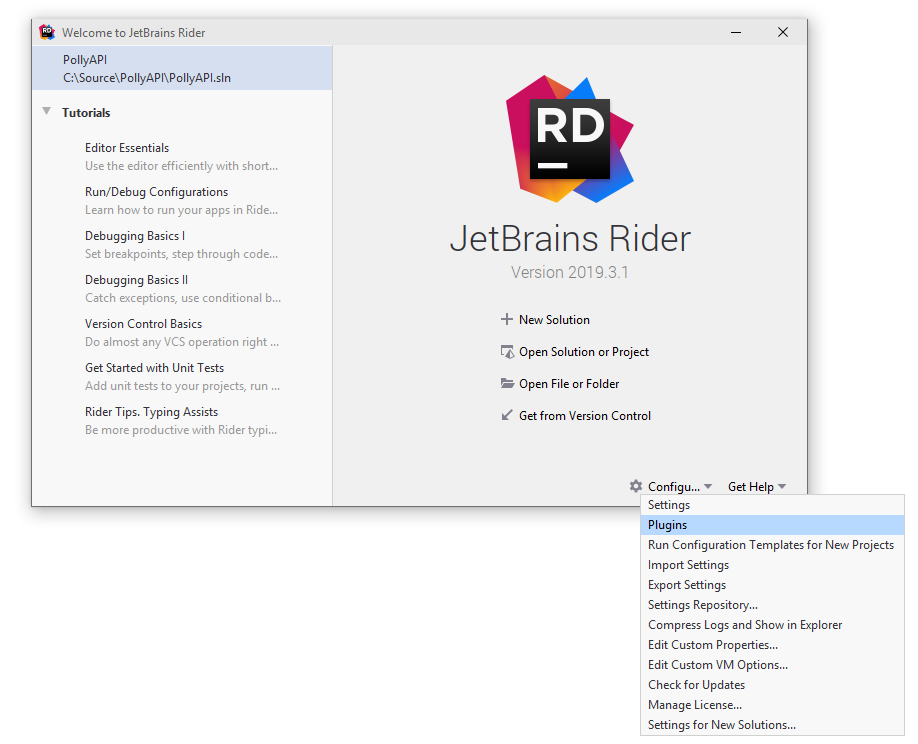
- Type in aws to get a filtered set of extensions

- Click the Install button on the AWS Toolkit.
- Click that button and OK through the confirmation screen and restart your IDE.
- The last step is configuring your AWS credentials. Once you have opened an existing or created a new solution, you will see a notice in the lower right-hand corner of the screen that states “No Credentials Selected”.

- If you have not already configured your local environment to support AWS credentials, click here for instructions.
- If your local environment is configured you should be able to click the “No credentials selected” message and select the AWS Profile you would like to use.
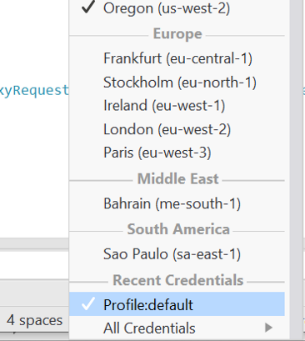
The selected credential set will be used to connect to AWS and determine which resources that the AWS Explorer will be able to communicate with.
Once credentials are selected, you can also quickly switch between AWS regions. Once you do that, the respective resources will be updated automatically on your AWS explorer.
Note: the IDE offers an event log that can be expanded at any given time, for instance after configuring your AWS credentials an event was created:

The AWS Explorer
The AWS Explorer window allows you to interact with several AWS services without having to leave your IDE by giving you access to your AWS cloud account.
AWS Explorer lists AWS resources you own in your account, including infra (S3, Lambdas), and CloudFormation stacks.
Currently, this experience is those areas that support cloud-optimized development approaches including containers (Amazon Elastic Container Service or ECS) and serverless (AWS Lambda).
Once you have opened Rider and installed and configured the toolkit, you should get a tab similar to that shown below. Expanding a few of those sections shows those items of that type for which your configured user has rights.
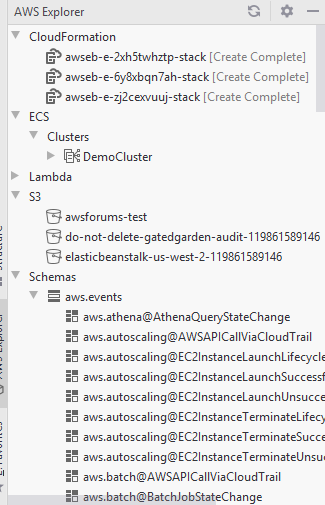
You also have the ability to work with the details of the items. Right-clicking on an item in the CloudFormation area, for example, gives you the ability to View Stack Status. Doing so will give you full stack status report from the last time the template was processed:

You will also be able to copy the arn directly from the IDE or delete the stack if desired.
Similarly, The ECS section node provides information about clusters that have been configured in Amazon Elastic Container Service (ECS) and the S3 node provides visibility into Amazon Simple Storage Service (S3) buckets. Lastly, the Lambda section provides access into the various AWS Lambda functions that are configured on the server.
Working with AWS Lambda
AWS Lambda provide .NET developers the ability to have code run only when necessary, generally whenever there is a request. Historically, a web or API application had to be running full-time. This would mean that processor and memory usage would be a 24×7 affair. The amount of processor and memory usage would be dependent upon the number of simultaneous calls that the application is managing, but the only time that number would hit 0 would be when the application is not running and thus not able to service those requests. AWS Lambda is a way to only use processor and memory when a request is being served. There are no servers to manage. The system will automatically scale to manage each request individually, removing any guesswork or pre-planning. This approach also allows you to manage memory on a per-function call basis, allowing you to further control resource usage on a per-call basis.
The AWS Toolkit for Rider helps you use .NET Core to write functions designed to run on AWS Lambda. Expanding the Lambda section of the AWS Explorer provides the list of configured functions:
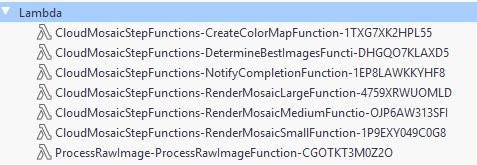
To follow through this tutorial, clone the CloudMosaic sample application that can be downloaded here. Right-clicking on a Lambda function will bring up a menu:
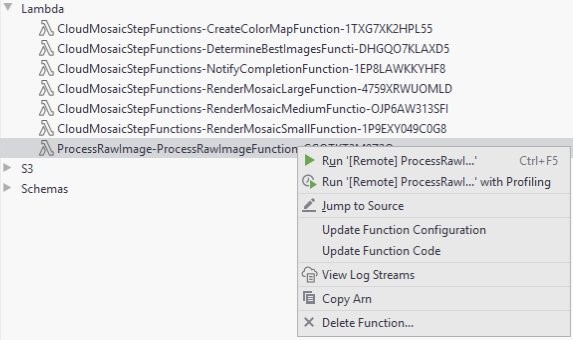
This menu allows you to run the Lambda function remotely by providing the necessary input information. In the case below, the function is expecting an event to be raised when a named S3 bucket has a file added. Selecting the type of input from the drop-down gives you an initial json snippet that contains all of the information that is provided as part of the event. This allows you to add the information that the function cares about, such as the bucket and file names for the file that was uploaded into S3.

Selecting the “Run” button will send the input text to the function and wait for the output. In this case, the event was processed successfully. If you decided to run the function with profiling you will have the additional capability of being able to go into your AWS Management Console and examine the AWS X-Ray output for that function.

The example above references an XRAY TraceId ending in b926. This Id is available in your AWS XRay console which provides you the ability to drill down into the state of the function and evaluate performance and trace what may be happening with work that is happening within the function.

The previous example shows that this function called the Rekognition, S3, and DynamoDB services.
Creating a new Lambda function
Alternatively you can also create a new Lambda function:
- Right click on Lambda in your AWS Explorer and select create a new AWS Lambda.
- A new window will allow you to specify the Name, Description and Handler for the Lambda function. Your Lambda function’s handler is the method in your function code that processes events. When your function is invoked, Lambda runs the handler method. When the handler exits or returns a response, it becomes available to handle another event.
- After providing these inputs, select the runtime, specify timeout and memory allocation.
- You could also specify Environment variables, IAM role (or create a new role), enable X-Ray and specify or create deployment settings and build settings.

Working with CloudWatch logs
A powerful feature that Rider provides is viewing your AWS CloudWatch log streams without having to leave your IDE.
On the AWS Explorer right click on CloudWatch logs and select view log streams.
Select the log stream and double click it to view more details. On the top right side of the window, you can filter and search through the CloudWatch event. This allows developers to develop, test and monitor a running application in a single window without having to jump through several tools.

Cloud Debugging for ECS
The AWS Toolkit for Rider enables you to debug your cloud applications by directly accessing code running in the cloud. Previously, when you wanted to step-through debug your applications in your IDE, you had to rely on features such as local emulation, which attempt to replicate complex cloud architectures on your local machine. Emulated environments cannot consistently maintain fidelity with your cloud environment, resulting in more errors found at deployment time and longer development cycles.
Cloud Debugging currently supports debugging containerized applications running on Amazon ECS with AWS Fargate. You can view logs, set breakpoints, and get a terminal into the running container.
For more information in details, please refer to the get started guide.
Conclusion
JetBrains Rider allows users to configure, create and monitor their environments through a powerful and easy to use IDE backed by the familiar experience and shortcuts developers are used to when working with IntelliJ IDEA the popular JetBrains IDE. Install the AWS Toolkit for Rider and check out the AWS Toolkit User Guide. You can submit quick feedback from the IDE itself, or better yet submit or +1 feature requests on GitHub.