AWS DevOps & Developer Productivity Blog
How Amazon CodeGuru Profiler helps Coursera create high-quality online learning experiences
This guest post was authored by Rana Ahsan and Chris Liu, Software Engineers at Coursera, and edited by Dave Sanderson and Adnan Bilwani, at AWS.
Coursera was launched in 2012 by two Stanford Computer Science professors, Daphne Koller and Andrew Ng, with a vision of providing universal access to world-class learning. It’s now one of the world’s leading online learning platforms with more than 77 million registered learners. Coursera partners with over 200 leading university and industry partners to offer a broad catalog of content and credentials, including Guided Projects, courses, Specializations, certificates, and accredited bachelor’s and master’s degrees. More than 6,000 institutions have used Coursera to transform their talent by upskilling and reskilling their employees, citizens, and students in the high-demand data science, technology, and business skills required to compete in today’s economy.
Coursera’s challenge
About a year and a half ago, we were debugging some performance bottlenecks for our microservices where some requests were too slow and often resulted in server errors due to timeout. Even after digging into the logs and looking through existing performance metrics of the underlying systems, we couldn’t determine the cause or explain the behavior. To compound the matter, we saw the issues across multiple applications, leading to a concern that the issue resided in code shared across applications.
To dig deeper into the problem, we started doing manual reviews of the code for the applications associated with these failures. This process turned out to be too laborious and time-consuming.
We also started building out our debugging solution utilizing shell scripts to capture a snapshot of the system and application state so we could analyze the details of these bottlenecks. Although the scripts provided some valuable insights, we started to run into issues of scale. The process of deploying the tooling and collecting the data became tedious and cumbersome. At the same time, the more data we received back from our scripts, the more demand we saw for this level of detail.
Solution with Amazon CodeGuru
It was at this point we decided to look into CodeGuru Profiler to determine if it could provide the same insights as our tooling while reducing the administrative burden associated with deploying, aggregating, and analyzing the data.
Quickly after deploying CodeGuru Profiler, we started to get valuable and actionable data regarding the issue. The profiler highlighted a high CPU usage during the deserialization process used for application communications (see the following screenshot). This confirmed our suspicions that the issue was indeed in the shared code, but it was also an unexpected find, because JSON deserialization is widespread and it hadn’t hit our radar as a potential candidate for the issue.
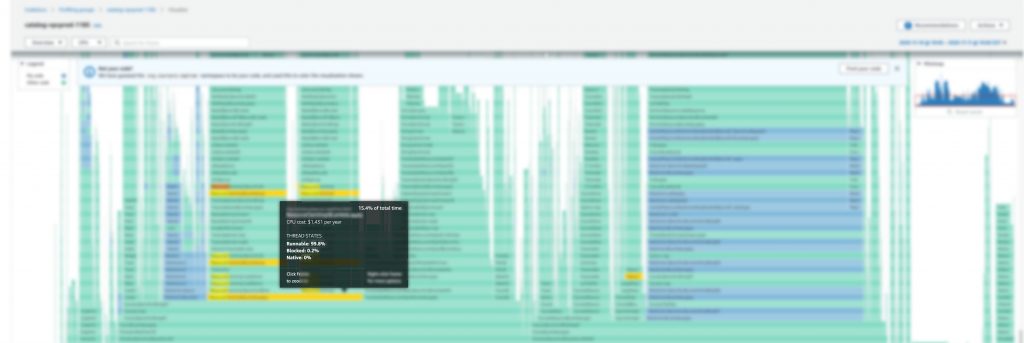
The deserialization performance was causing slow processing time for each request and increasing the overall communication latency. This led to performance degradation by causing the calls to slowly stack up over time until the request would time out. With CodeGuru Profiler, we were also able to establish a relationship between the size of the JSON document and the high CPU usage. As the document size increased, so did CPU usage. In some cases, this resulted in a resource starvation situation on the system, which in turn could cause other processes on the instance to crash, resulting in a sudden failure.
In addition to the performance and application instances failures, the high CPU usage during deserialization was quietly driving up costs. Because the issue was in shared code, the wasteful resource consumption was contributing to the need for additional instances to be added into the application cluster in order to meet throughput requirements.
Results
The details from CodeGuru Profiler enabled us to see and understand the underlying cause and move forward with a solution. Because the code is in the critical communication path for our microservices and shared across many applications, we decided to replace the JSON serialization with an alternative object serialization approach that was much more performant.
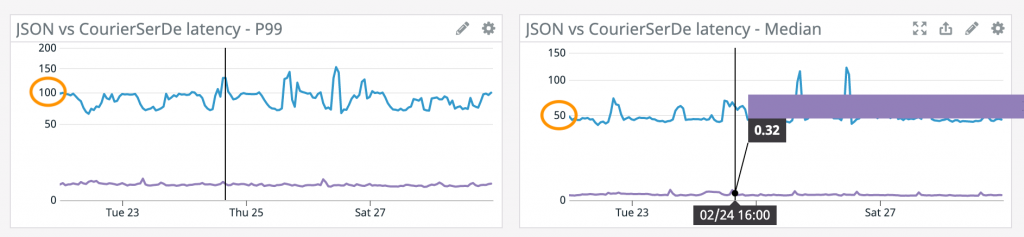
To get a deeper understanding of the performance impact of this change, we deployed the original code to a test environment. We used CodeGuru Profiler to evaluate the performance of the JSON and native object serialization. After we ran the same battery of tests against the new code, the deserialization CPU usage dropped between 30–40%.

This resulted in a corresponding decrease in serialization-deserialization latency of 5–50% depending on response payload size and workload.
As we roll out this optimization across our fleet, we anticipate seeing significant improvements in the performance and stability of our microservices platform as well as a reduction in CPU utilization cost.
Conclusion
CodeGuru Profiler provides additional application insights and helps us troubleshoot other issues in our applications, including resolving a case of flaky I/O errors and improving tail latency by recommending a different thread-pooling strategy.
CodeGuru Profiler was easy to maintain and scale across our fleet. It quickly identified these performance issues in our production environment and helped us verify and understand the impact of possible resolutions prior to releasing the code back into production.
About the authors
 |
Rana Ahsan is a Staff Software Engineer at Coursera |
 |
Chris Liu is a Staff Software Engineer at Coursera |
 |
Adnan Bilwani is a Sr. Specialist Builders Experience at AWS |
 |
Dave Sanderson is a Sr. Technical Account Manager at AWS |