AWS for Industries
How to perform price action analysis with Amazon FinSpace
Price Action Analysis is a trading methodology that solely focuses on recent price movements of securities. It allows traders to understand and capture the current market structure in patterns, further serving as trading signals. Reading price action intuitively is an effective way to maximize trading profits for retail traders, institutional traders, and hedge fund managers.
Although price action traders aim to “Keep It Simple Stupid”, it isn’t simple to identify “true” price action patterns. The main reason is that price action analysis is essentially a chart reading exercise. Identifying price patterns on charts is subjective and manual, which makes it challenging to analyze the effectiveness and automate trading. Partially because of this, research on popular price action patterns via verifiable evidence is based only on low-frequency data. For example, a study published by the National Bureau of Economic Research [2] demonstrates that price action patterns may work for a rolling window of 38 to 63 days. Such a long window dramatically limits the trading opportunities where higher frequency data is available.
Amazon FinSpace makes this a much easier job by relieving the traders of onerous data management and empowering them with rich analytical building blocks for data processing and scalable computing resources for sophisticated modeling or simulation.
Head and Shoulders pattern
This post uses the famous Head and Shoulders (HS) pattern to illustrate how to leverage FinSpace to perform price action analysis. Traders widely follow HS as one of the most reliable price action patterns to predict a bullish-to-bearish trend reversal. Various algorithms exist for identifying HS patterns. We choose an algorithm [1] that identifies HS patterns within a given time window by smoothing price movements and finding the local maxima and minima. The resultant HS patterns can be generated at any frequency supported by the underlying dataset and visualized for traders to verify their validity. The framework is generic, and FinSpace users can similarly evaluate other price action patterns with their choices of identification algorithms.
You can find detailed HS pattern definitions and related trading strategies on many websites and books. The following is a sample HS chart on investopedia.com [4].

Workflow
The following is the workflow implemented in this post:
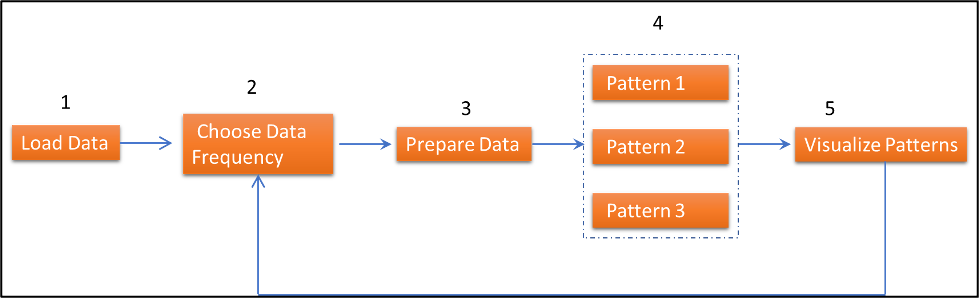
- Load Data: Load raw security price data into FinSpace for further processing and analysis
- Select Data Frequency: Select the desired trading frequency
- Prepare Data: Prepare data for the pattern identification algorithm/model
- Identify Price Action Patterns: Run the algorithm/model to identify the price action patterns
- Visualize Patterns: Plot the pattern on the price chart for verification
Solution overview
The following is the high-level architecture of the price action analysis framework. We use a Jupyter notebook and the managed Spark cluster provided by FinSpace to implement the HS identification algorithm and perform the analysis.

- Load Data: We load “US Equity TAQ – AMZN 6 Months” data, which is part of the Capital Markets Sample Data Bundle installed in the FinSpace environment by default.
- Data Processor – Select data frequency: The raw data loaded in Step 1 is the fine-grained sample at the nanosecond level. Furthermore, we aggregate the price data at various lower frequencies and identify the ones for which the price action patterns are pronounced and tradable.
- Data Processing and Preparation: We aggregate the data to the chosen frequency by calling FinSpace time bar collection, summarization, and filling and filtering functions. We further smooth the resultant price series using functions provided in FinSpace analytical library (e.g., Exponential Moving Average)
- Price Pattern Identifier: Our HS algorithm [1] consists of two steps. First, the algorithm finds all of the local minima and maxima of the smoothed price series obtained at Step 3 in a time window. Second, it identifies HS and Inverse Header and Shoulder (IHS) patterns.
- Visualize HS and IHS: We plot all of the identified HS and IHS patterns in the price series chart to allow the trade to verify their validity.
The FinSpace based architecture has the following advantages:
Simplicity: FinSpace offers high-efficiency data management and processing capabilities as off-the-shelf building blocks. In particular, quickly aggregating and smoothing high volume and high-frequency data can be done through the built-in bar operations. These functionalities allow traders to perform the price action analysis and promptly validate the tradable patterns with minimum development and data management efforts.
Extensibility: The core of the Price Action Analysis is the pattern identification algorithm. Although we implement a simple algorithm, you can easily plug in more sophisticated solutions. For example, by importing respective libraries, one can replace the simple algorithm illustrated in this post with a machine learning (ML) or Digital Signal Processing (DSP)-based model.
Security and Compliance: This solution complies with a comprehensive security model and provides specific security features, such as data encryption in transit and at rest, identity options including SAML-based SSO, and auditability using logs and Audit reports available in the FinSpace web application. You can find more details in the Amazon FinSpace security guide.
Interoperability: The solution described in this post uses standard PySpark language and leverages the FinSpace Time Series APIs, which are only available from FinSpace Spark clusters. The compatibility with Spark lets you reuse existing Spark solutions that you already have to leverage elasticity or integration with other AWS services (such as artificial intelligence (AI) Services for fraud detection or text/document analysis). FinSpace also provides APIs that you can use to integrate with other applications running on AWS or on-premises, thereby effectively enabling hybrid cloud options.
Step-by-step instructions
You can follow FinSpace documentation to sign up for AWS, and create a FinSpace environment. The following instructions illustrate how to detect HS patterns with preinstalled sample data and FinSpace libraries.
- On the left panel of the FinSpace page, select “Capital Markets”, then select “US Equity TAQ – AMZN 6 Months”.
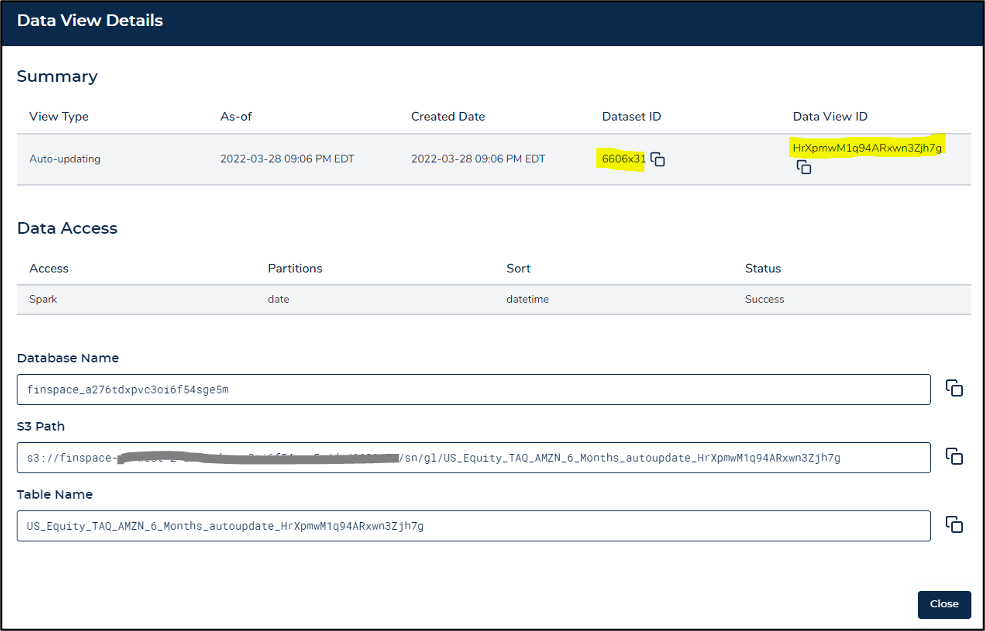
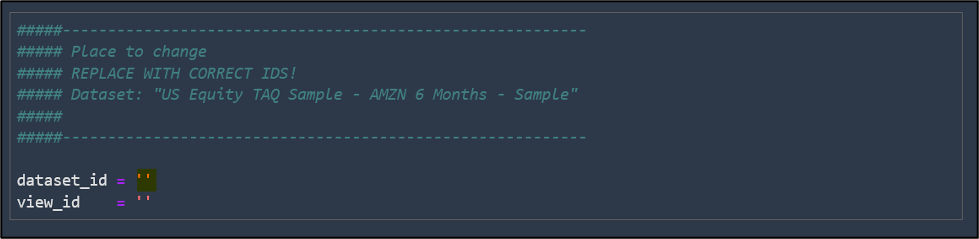
- You need the Dataset and Data View IDs to run the demo notebook. Select the “All Data Views” tab and see the following page.

- Select “Details” and find the Data View ID and Dataset ID values on the pop-up window. Note that your values may be different.
- Next, close the pop-up window and open the notebook by selecting “Go to Notebook” at the top right corner (see screenshot). If prompted with a pop-up message “You will need some data to analyze”, then select “Continue to Notebook”.
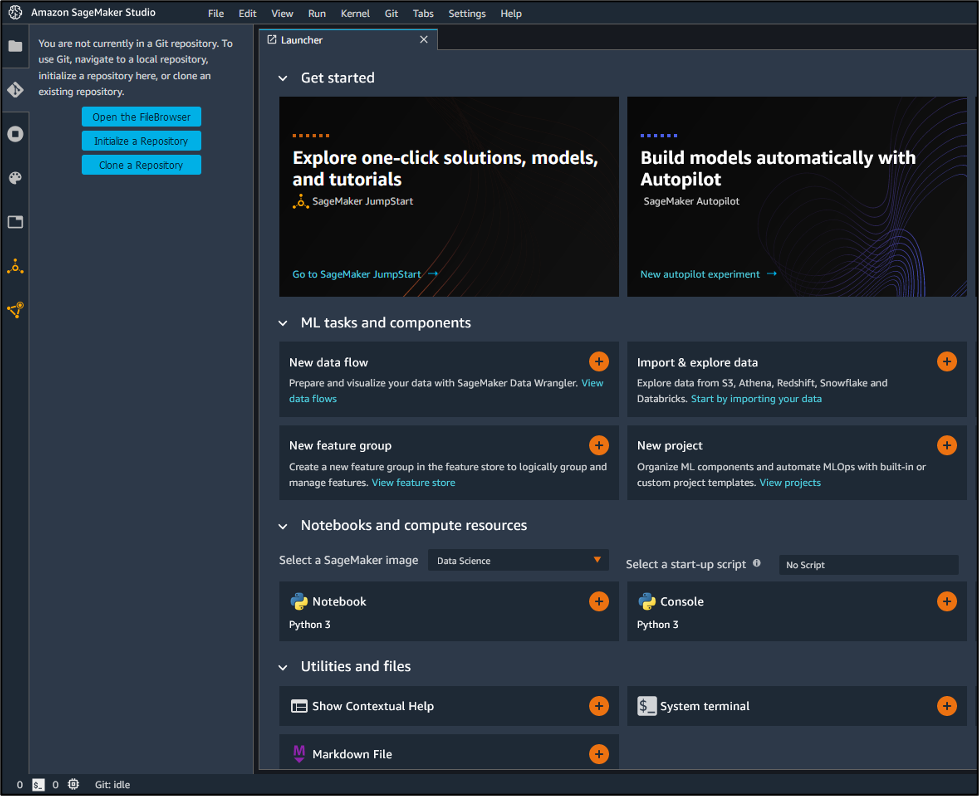
- In Studio, clone the demo source code in the GitHub repository.
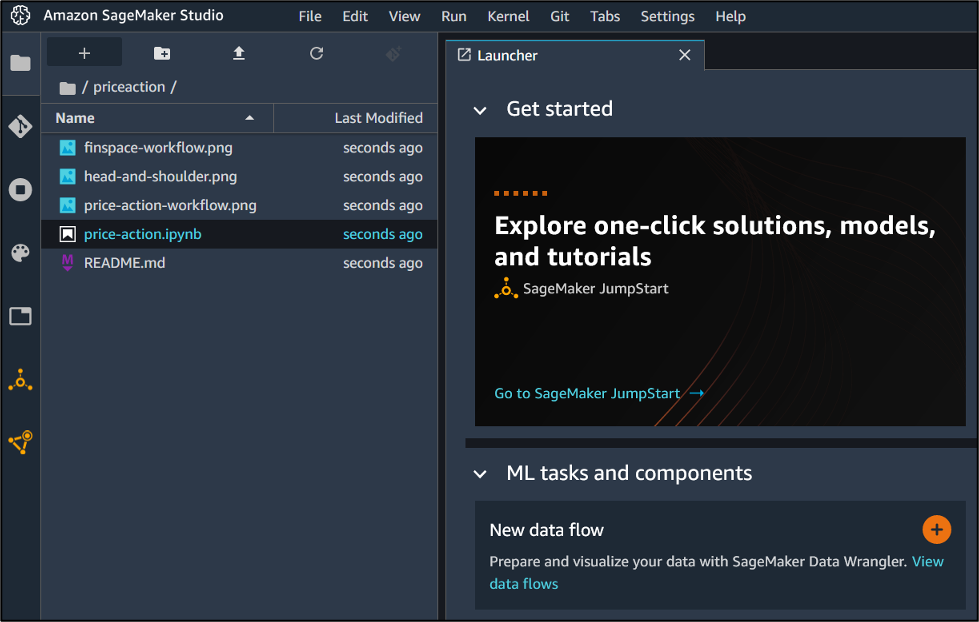
- Open notebook file “price-action.ipynb”. If prompted to set up the notebook environment, then choose image finspace-sparkmagic to start the notebook kernel. Note that the image name suffixes may be different.


- Now you’re ready to run the notebook to find HS patterns by executing the code cells one-by-one. First, we must start the Spark Cluster and load data.
- Start up and connect to a Spark Cluster: start up a Spark Cluster for the first run and connect to it, which takes 8-12 mins.

-
- Set dataset and view: set the dataset and dataview IDs with the values copied in Step 3 above.
- Obtain and pre-process data
- Load common Python and FinSpace libraries

-
- Connect to FinSpace Analytics Manager and read data into spark dataframe


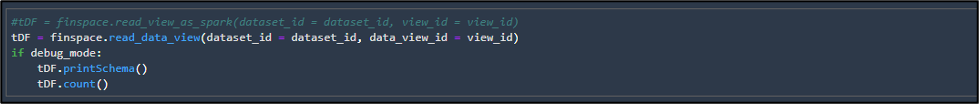
-
- Aggregate high-frequency data into bars
A bar is defined as a one minute window per ticker and event type. In this demo, we only have one ticker, AMZN, and we choose the best quote as the price.
- Aggregate high-frequency data into bars
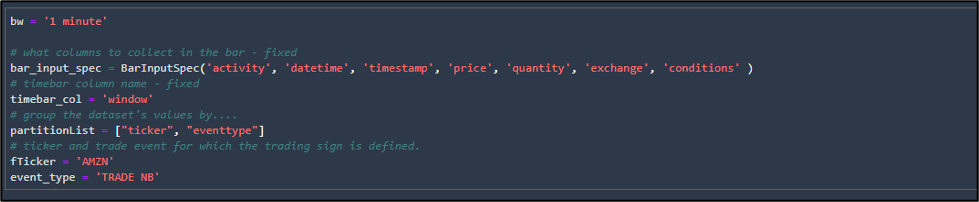
FinSpace library has many common aggregation functions, such as std and vwap. We leverage them to create new data features. Finally, we limit our analysis to a three month time window from 10/01/2019 through 12/31/2019.

-
- For better performance, we smooth the data using the building EMA algorithm.
Note that the original implementation of HS pattern [1] provides similar data processing functions. Because FinSpace has already integrated the processing into data retrieval, both of which run on the cluster, it offers better performance, especially for large data sets like high-frequency data. Therefore, in our implementation, we use FinSpace.
- For better performance, we smooth the data using the building EMA algorithm.

- Detect HS patterns:
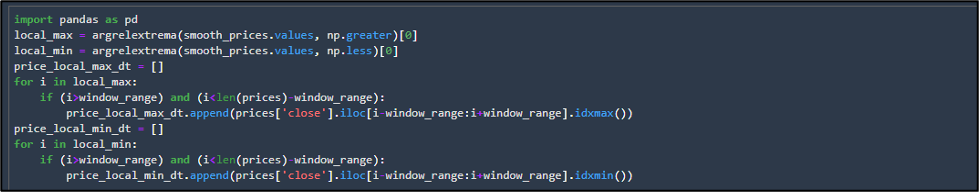
- Find all local minima and maxima
We use the Scipy function argrelextrema for this purpose. Then, we perform further smoothing by picking minima and maxima out of a window: the local minima/maxima must be the minimum/maximum within the window of seven bars centered on itself. This is because it helps dampen noise when dealing with volatile time series.
- Find all local minima and maxima
-
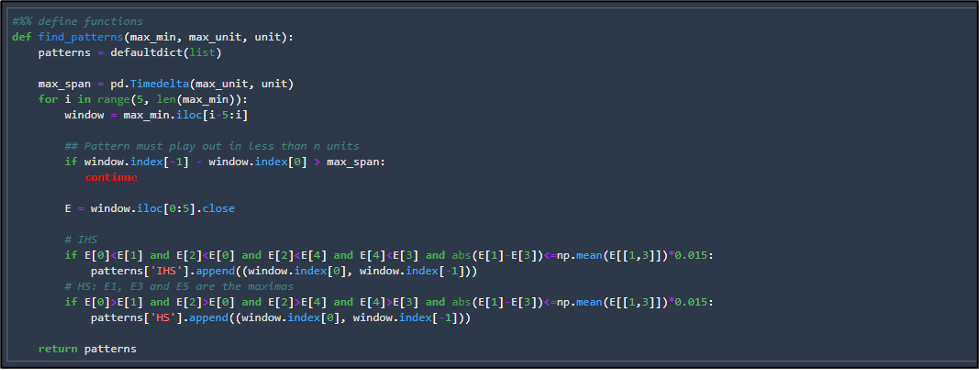
- Find the HS patterns
A HS pattern is identified by five points where- the 1st, 3rd, and 5th are the local maxima, and the 2nd and 4th are the minima
- The total timespan from 1st point to the last must be within a limit. Otherwise, the pattern is of little value for trading purposes. Therefore, in our demo, we use the parameter max_unit and unit to specify the limit, e.g., two hours.
- The neckline in the most typical HS patterns is usually flat, i.e., the 2nd and 4th points are close. Therefore, we hardcode (for simplicity) a small tolerance level (0.015 of the mean value of the two minima).
- Find the HS patterns
The above three conditions are checked for all identified local minima and maxima to identify the patterns.
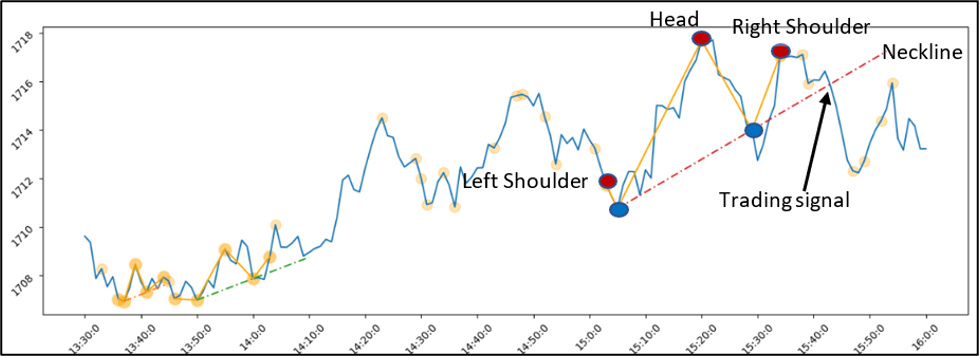
- Plot HS with neckline: Two patterns are detected. We use the second to illustrate the concept and the usage.
- The left shoulder, the right shoulder, and the head are red dots and are local maxima, of which the head is the largest.
- The neck points are in blue.
- The neckline is the dashed line through the two neck points. In this example, the neckline tilts upward.
- When the price breaks the neckline, the HS pattern predicts a further drop in the price and thus triggers a short signal. This example demonstrates that this signal is valid (i.e., profitable).
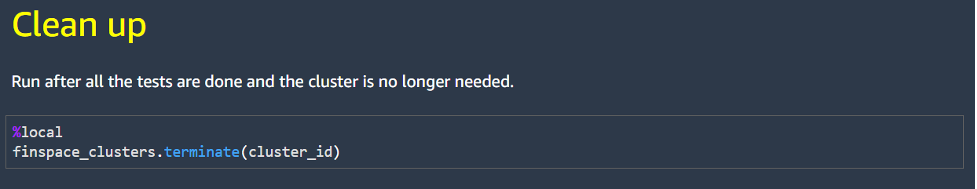
Clean Up
AWS offers a pay-as-you go approach for FinSpace pricing. You can follow these steps to terminate the Spark Cluster and/or delete the FinSpace environment if you no longer need them.
- Terminate Spark Cluster: Add a Jupyter cell at the end of the notebook and execute it. Note that the Cluster ID in the following screenshot is from Step 7.a above.
- Delete the FinSpace environment: Open FinSpace from the , select the environment in your AWS region, then select the “Delete” button. Note that you will delete all of the assets created in the FinSpace environment.
Looking ahead
Whereas this example just focuses on one stock, FinSpace lends itself to extending this analysis to a cross-section of stocks through time. A typical approach to validating if a particular pattern can identify a profitable trading signal would be to backtest the signal and establish the statistical significance of the ex-post price performance. FinSpace allows quantitative analysts to process and aggregate tick data to the desired frequencies, generate the signals, perform backtests on a large universe of stocks, and quickly iterate to test out new signals and scenarios.
Conclusion
This post demonstrated how to perform Price Action Analysis using FinSpace and PySpark. We illustrated the method through the HS pattern and implemented a simplified algorithm based on [1] to identify these patterns using historical high-frequency trading data provided in FinSpace.
You can use the solution described in this post as a foundation and personalize it using your configurations and pattern identification models. You can also use other datasets available in FinSpace or load your datasets.
We welcome any feedback on possible extensions and additional use cases that you would like to see. This post is for educational purposes only. However, past trading performance doesn’t guarantee future performance.
You can find more information on Amazon FinSpace documentation and ready-to-use Jupyter notebooks on Amazon FinSpace GitHub.
Bibliography
[1] Chong, Terence Tai Leung and Poon, Ka-Ho (2014), A New Recognition Algorithm for “Head-and-Shoulders” Price Patterns,. https://mpra.ub.uni-muenchen.de/60825/
[2] Lo, A. W., Mamaysky, H. and Wang, J. (2000). Foundations of Technical Analysis: Computational Algorithms, Statistical Inference, and Empirical Implementation. Journal of Finance, 55(4), 1705–1765.
[3] Sébastien Stormacq, May 2021, New Amazon FinSpace Simplifies Data Management and Analytics for Financial Services,
[4] Adam Hayes, August 23, 2022, What Is the Head and Shoulders Pattern?