AWS Messaging Blog
Amazon Pinpoint’s Analytics Suite Now Includes Event Metric Visualizations
Today, we’re enhancing Amazon Pinpoint’s analytics capabilities by giving you the ability to filter event data based on certain attributes and metrics. We’re also adding new analytics features help you visualize event data over time. These new features help you quickly understand how your customers are using your app, and make it easy to keep track of behavioral trends over time.
For example, if you want to understand how much time a customer spends performing a certain action within your app, such as watching a video, you can now visualize this in as few as three clicks. Start by signing in to the console and choosing the project that contains the data that you want to view. Next, in the navigation pane, under Analytics, choose Events. On the Events chart, you’ll see two new menus: Event Attributes and Metrics, and Event Attribute Values. Use these menus to refine the data in the chart to include only the events and attributes that you want to see.

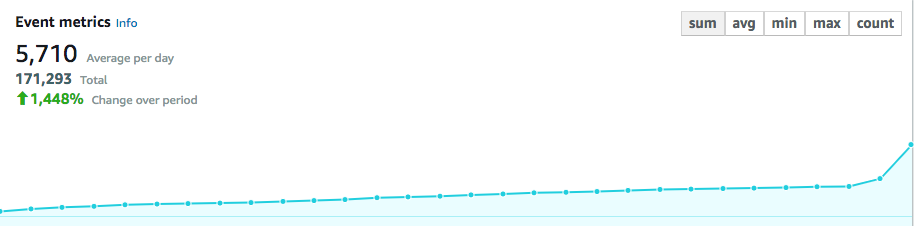
When you select a metric value, Amazon Pinpoint shows a new time-series chart. This chart includes summary filters, so you can quickly see the total time an action occurs, the average, the minimum and maximum values over the time period, and the number of events. You can use this data when considering how to improve the user experience of your app, or when creating new engagement campaigns for certain groups of customers.
For example, you could see if the average time spent on your app is increasing or decreasing, or if the total price of goods sold is trending in the right direction. You can then create engagement campaigns that specifically target segments of users who spend less time in your app, or those who are making fewer in-app purchases.
As always, the data in Pinpoint is yours. You can easily export it to CSV format for analysis in external applications. For deeper analysis, we recommend that you set up Amazon Pinpoint Event Streams, which let you stream your data to nearly any destination. To learn more about setting up Event Streams, see Streaming Events from Amazon Pinpoint to Redshift on the AWS Messaging and Targeting Blog.
You can use these features now in all AWS Regions where Amazon Pinpoint is available. We hope that these additions help you to better understand your customers and find exciting new ways to use Amazon Pinpoint to connect and engage with them.