AWS Messaging Blog
Debugging SMTP Conversations Part 2: Capturing a Live Conversation
If your email-sending application has problems communicating with the Amazon SES SMTP interface (or your customers are having problems connecting to your SMTP server that proxies requests to Amazon SES), you’ll first probably check your application logs to see what’s going on. If you’re not able to find a smoking gun in your application logs though, what else can you do? Last week, we went over the basics of SMTP conversations and today we’ll explore how you can debug deeper than the application logs.
You may consider setting up an application layer wire log that shows all of the messages you’re sending and receiving, but one unlucky day you may find yourself with a lower-level issue on your hands. It could be a problem in the link between you and your ISP, between your ISP and the next hop, between your application and your kernel, or any number of other things.
A great way to get more data to help you figure out what’s going on is to go lower in the networking stack to the transport layer. Two well-known, freely available tools that can help you with this are TCP Flow and TCP Dump. TCP Flow is a great next step when you just want to see plaintext data packets in a human-readable format, while TCP Dump is more adept at giving you the kitchen sink so to speak (i.e., all the TCP packets in a variety of formats). In today’s post we’ll talk about TCP Flow. Since many of our customers use EC2 Linux-backed instances, we’ll focus on how to use TCP Flow from Linux.
Installing TCP Flow
TCP Flow lets you get your feet wet in transport layer debugging without overwhelming you with data. You can get the latest version using git clone:
sudo yum -y install git
mkdir ~/tcpflow && cd ~/tcpflow
git clone –recursive git://github.com/simsong/tcpflow.git
Currently, the latest version is 1.3, and the steps in the README work on a standard EC2 with a 64-bit AMI (tested on ami-bba18dd2 and ami-2f726546), though you may also need to yum install openssl-devel. If you encounter any problems doing this you can also try downloading the latest version from the GitHub site, though the install instructions may be in the NEWS file instead of README.
If you can run sudo /usr/local/bin/tcpflow -h and see the usage information, then the install was a success and you’re ready to boogie. Otherwise, double check the console output to see if some step failed. You can get more detailed usage information from man tcpflow.
Using TCP Flow
As you can see in the TCP Flow usage information, there are a lot of options to help you toggle what you’re looking for; these can be overwhelming at first glance. Let’s look at a reasonable set of options to start you off on the right track:
sudo /usr/local/bin/tcpflow -i any -g -FT -c port 25 > ~/tcpflow_out
- The -i option specifies what network interface to listen on (‘any’ is a reasonable default to start you off)
- The -g option was renamed in a recent version (it used to be -J), but it’s just to give you information in different colors, which you’ll soon see is nice to have.
- The -c option prints to the console instead of creating individual files. By default, TCP Flow creates two files for each TCP conversation – one file for the packets coming in and one for the packets being transmitted. The -c option can be a useful alternative because the console interleaves the input and output packets.
- The -F option is all about the format of the output files, and the ‘T’ prepends each file name with an ISO-8601 timestamp. If you output to the console using the -c option, it will still prepend all the lines of your conversation with the timestamp to the millisecond even though you’re not creating any files.
- The “port 25” bit is a filtering expression, as defined in the pcap filter manual. Depending on what your instance is up to, listening to all traffic can be overwhelming so it’s a good idea to filter on what you care about. You can filter on dozens of things including the source or destination host/port, port ranges, and protocol.
Once you have your TCP Flow output, you can look at it with the color coding preserved (there’s one color for packets sent and one for packets received) using less:
less -R ~/tcpflow_out
You can pipe grep, too, if you’re trying to isolate an incident via a specific source/destination port or address:
grep 1.2.3.4 ~/tcpflow_out | less –R
A TCP Flow Example
If you establish a STARTTLS connection with the Amazon SES SMTP endpoint on port 25 and you use the above TCP Flow command, the output from less might look something like this:
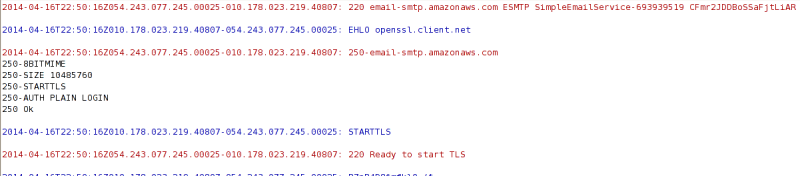
You’ll notice that the output is actually readable – there’s a timestamp for each packet in ISO 8601 format followed by the source IP and port of the packet and then the destination IP and port of the packet. You don’t get TCP packet headers or SYN/ACK packets or any of those details, but maybe your problem doesn’t require that much information.
From this point on, however, the conversation will look like gibberish since it’s just a TLS handshake and then all the packets are encrypted. If you use TLS wrapper mode, all the packets will look like gibberish. The nature of TLS makes it tough to decrypt these packets, but TCP Dump and Wireshark will allow us to decrypt at least some of the handshake (we’ll go over these in the next blog post of this series). TCP Flow is still useful on its own, though, if you’re receiving plaintext SMTP conversations from your customers and then proxying messages to Amazon SES for final delivery.
One last thing to note on TCP Flow – you can use the -r option to read in a TCP Dump capture and make it look readable for you.
We hope that you’ve found these tips handy, but the best is yet to come – in the next post of this series we’ll show you how to milk your TCP connections for all the data they’ve got. Thanks again for being a customer!