Front-End Web & Mobile
Testing mobile apps with Cucumber and Appium through TestNG on AWS Device Farm
Mobile testing frameworks have matured in functionality to support the innumerable features of modern apps. In this blog post, we’re going to dive into how to set up a local development environment for Android app development, and then use Appium to perceive our sample app from a test perspective. Then, we’re going to show how you can use the device-interactive abilities of Appium and business-development utilities of Cucumber within a traditional Java TestNG testing environment. These tools will let you produce in-depth functional tests for mobile apps. Finally, we’ll demonstrate how you can use AWS Device Farm to upload and run your tests across a variety of real mobile devices. This shows you how different hardware can affect the true end-user experience of your app.
Background
Functional testing on mobile devices has been a notoriously hard task to automate ever since smartphones first rose to popularity. Over time, Google and Apple, the two companies behind the Android and iOS mobile operating systems, each released their own low-level interfaces for working with elements on a device’s screen during a test. Using Google’s UIAutomator interface or Apple’s XCTest interface, you can now send commands to devices to ask about what the device is displaying, and also to tell the device to click a certain place on the display. Through these black-box, user-like interfaces, you can perform true functional testing on iOS and Android apps.
Appium acts as a high-level layer of abstraction on top of these interfaces to enable the simplest test cases for developers. Appium has summed up all the complexities and nuances of UIAutomator and XCTest into a clean and simple API for querying and interacting with the UI elements of devices.
A great advantage of this approach is that the Appium APIs for both Android and iOS are almost identical. So, if you’re testing the same app on Android and iOS, your tests for the two will share most of their code. This reduces development time and frustration. Appium doesn’t act as a “testing framework” per se, but rather as a framework for UI interaction. This is where a tried-and-true testing framework like Java’s TestNG comes into the picture.
Using Java TestNG test suites, cases, and methods, it’s possible to interact with a device using Appium. You can perform standard TestNG testing techniques on the results of those interactions. If you want to see if a certain UI element exists on the screen properly, just query the element with Appium, and put the result of the query in a TestNG assertion! By combining the power of Appium and TestNG, you’re able to write clean and elegant functional tests for both Android and iOS apps.
One additional testing innovation that we’ll be going over is the Cucumber framework. Cumbersome test cases and suites can overwhelm developers, and lose their relation to real business needs and behavioral specifications. Cucumber comes into the picture as a way to tie together natural language specifications to code test cases. This means that you can take the TestNG test that checks things about our app with Appium, and tie this test’s input and output to complete sentences of specifications. Testing output has never been cleaner and easier to parse!
Additionally, these tests are ready for automation right out of the box. By using a platform like Device Farm, you can deploy your tests to automatically run on hundreds of different devices, with dozens of different operating system versions—to see exactly how your functional tests perform under different hardware conditions.
Getting started
For this workflow, you’ll be using Device Farm’s sample Android app and tests to explore the functionality of Appium, Cucumber, and TestNG. This app contains many of the standard UI elements for Android. You’ll develop your test locally by using an Android emulator, and Appium’s GUI-based app and Inspector. This is a pretty standard workflow for developing Android tests before deploying them to a cloud-based testing service like Device Farm.
Here are the prerequisites for this test development workflow:
- Android Studio
- Appium
- Maven
- Device Farm’s sample Android app and sample Appium / Cucumber / TestNG tests
Working with projects and emulators in Android Studio
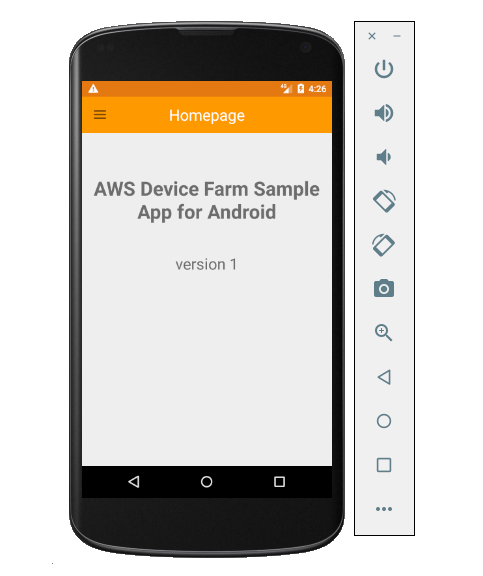
After you’ve downloaded and installed these on your local machine, start by opening up the Device Farm sample project in Android Studio. For this workflow, we assume that you’re familiar with Android Studio projects and emulators. The sample project requires a couple of dependencies that you can download through the SDK Manager. You want to have an Android Platform installed that matches your emulator’s platform, and you need the Android SDK Build Tools version 26.0.2. You’re going to use a Nexus 4 device emulator with platform version 22. You should be able to build and run the app on the emulator:
Getting the Appium Inspector up and running
Open up the Appium desktop application and see if you can control the emulator. Opening the app for the first time brings up a screen like the following:
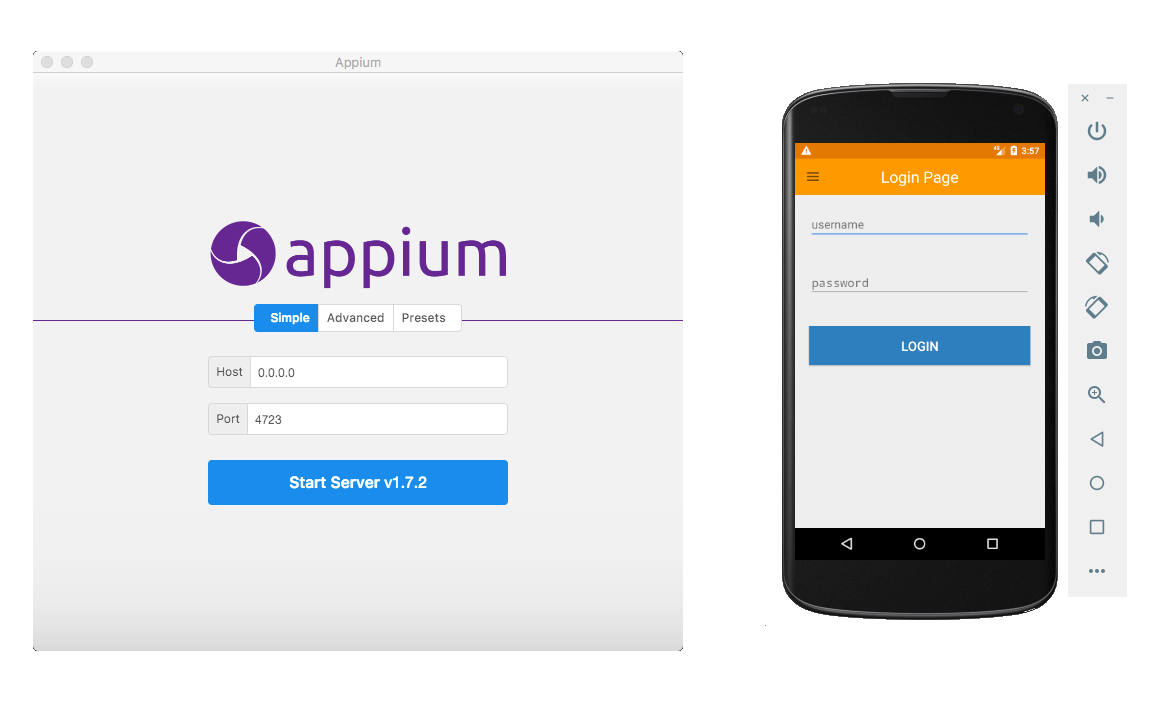
Choose Start Server v1.7.2 to start the Appium listener service.
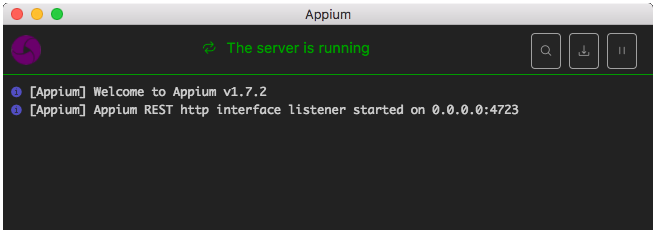
This console shows any logs that Appium is generating. If you were to send some commands to Appium at its default server address http://0.0.0.0:4723, these commands would be logged to the console.
Next, enter the Appium Inspector view to inspect the elements that are on the emulator’s screen right now. If you want to write Appium tests that interact with an Android device, you need to know how Appium sees these elements. The Inspector view is the best way to do this. It makes the test writing process more seamless by removing any guesswork. Choose the magnifying glass in the top-right corner to get started.
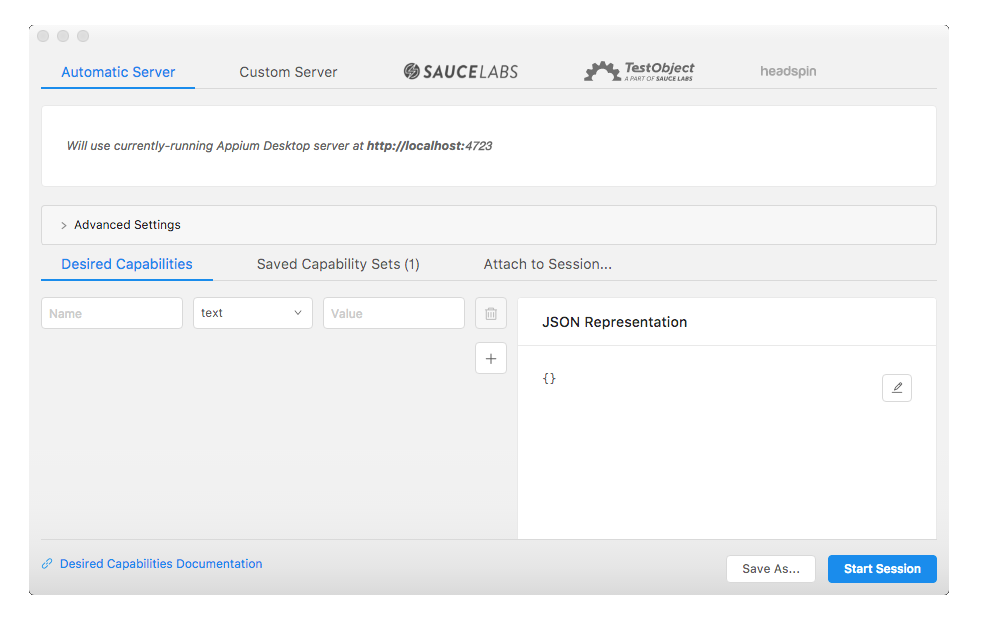
In this view, before you can inspect the device, you need to tell Appium a bit about the device you’re performing testing on, and the app you’re testing. You do this by sending a set of “desired capabilities” to the Appium server. This is good practice, because you’re going to need to set up the same desired capabilities later on in your test code. There’s a link at the bottom left that goes to the documentation about desired capabilities. For now, these are the desired capabilities that you’ll be using with your emulator:
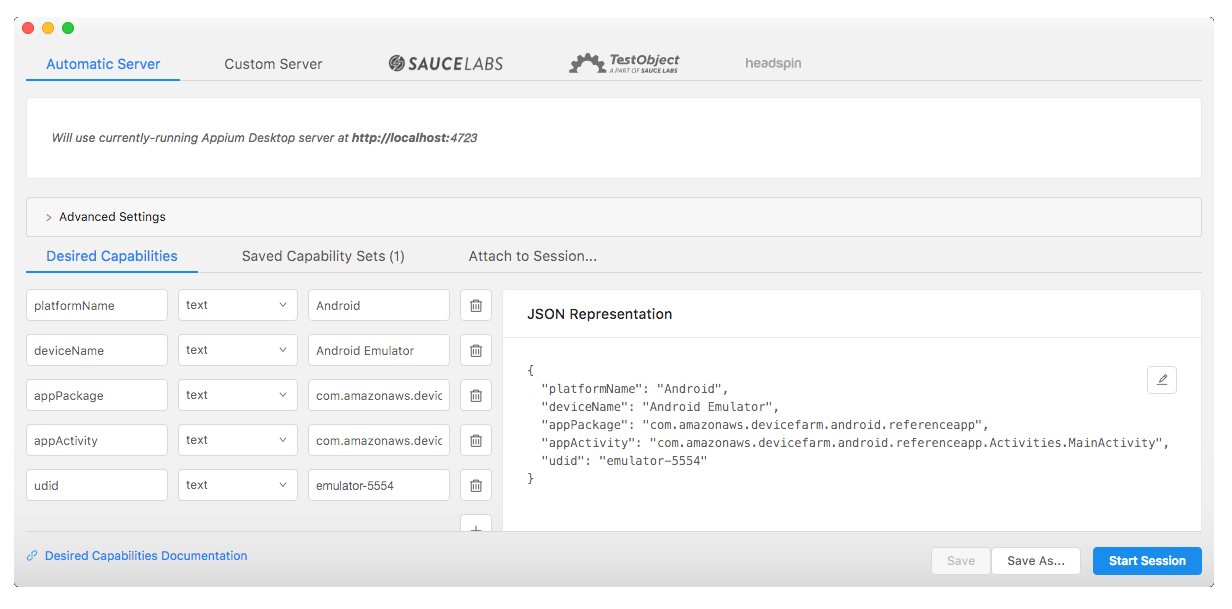
Set the platformName capability to Android, and set deviceName capability to Android Emulator. You need to do a bit of research for the last three values. You can get the first two values, appPackage and appActivity, from the app itself. It’s easy to find these values in the AndroidManifest.xml file of the source code of our app.

The appPackage value is the root namespace for the application, and is located on line 2:
The appActivity value is the activity that’s created when the app first starts. You can see this on lines 16–25. It’s identified with an intent-filter that includes android.intent.action.MAIN:
If you don’t have access to the source code, you can get the values from a compiled app using the adb tool.
Finally, you need the UUID for the device (in this case, an Android emulator). You can find this string by running adb devices in the terminal of Android Studio:
The string emulator-5554 is the UUID for the device.
Enter all five values into the desired capabilities, and then save these capabilities with the Save as… button to make testing easier in the future. Choose Start Session to start the Appium Inspector.
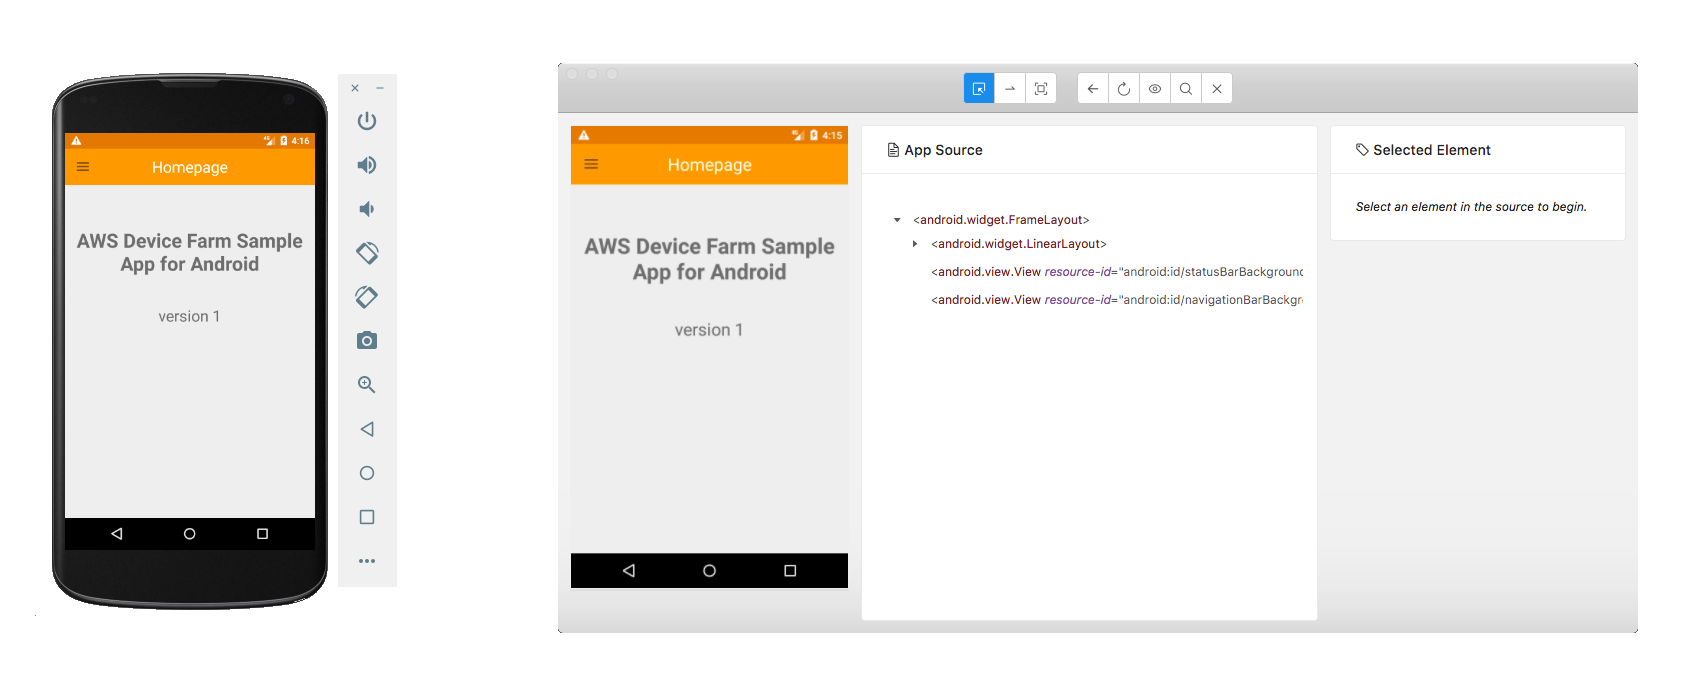
If everything went ok, you should see a hierarchy of elements that make up the screen. When writing automation tests for devices, we typically refer to this type of data as the source or dump of the screen of the device. This isn’t literally the source code of the app, but rather this is analogous to the source of an HTML page when it finishes loading in the web browser.
The element structure here is pretty legible. There are elements called android.widget.FrameLayout that represent the frame of an app, elements called android.widget.TextView that represent a block of text, elements called android.widget.ImageButton that represent a clickable image, and so on. If you’re working on an app with many custom UI elements defined in the app’s source code, you’ll see some elements that have a different class name than android.widget. By choosing these elements, you can see more diagnostic information in the Selected Element tab, on the right.
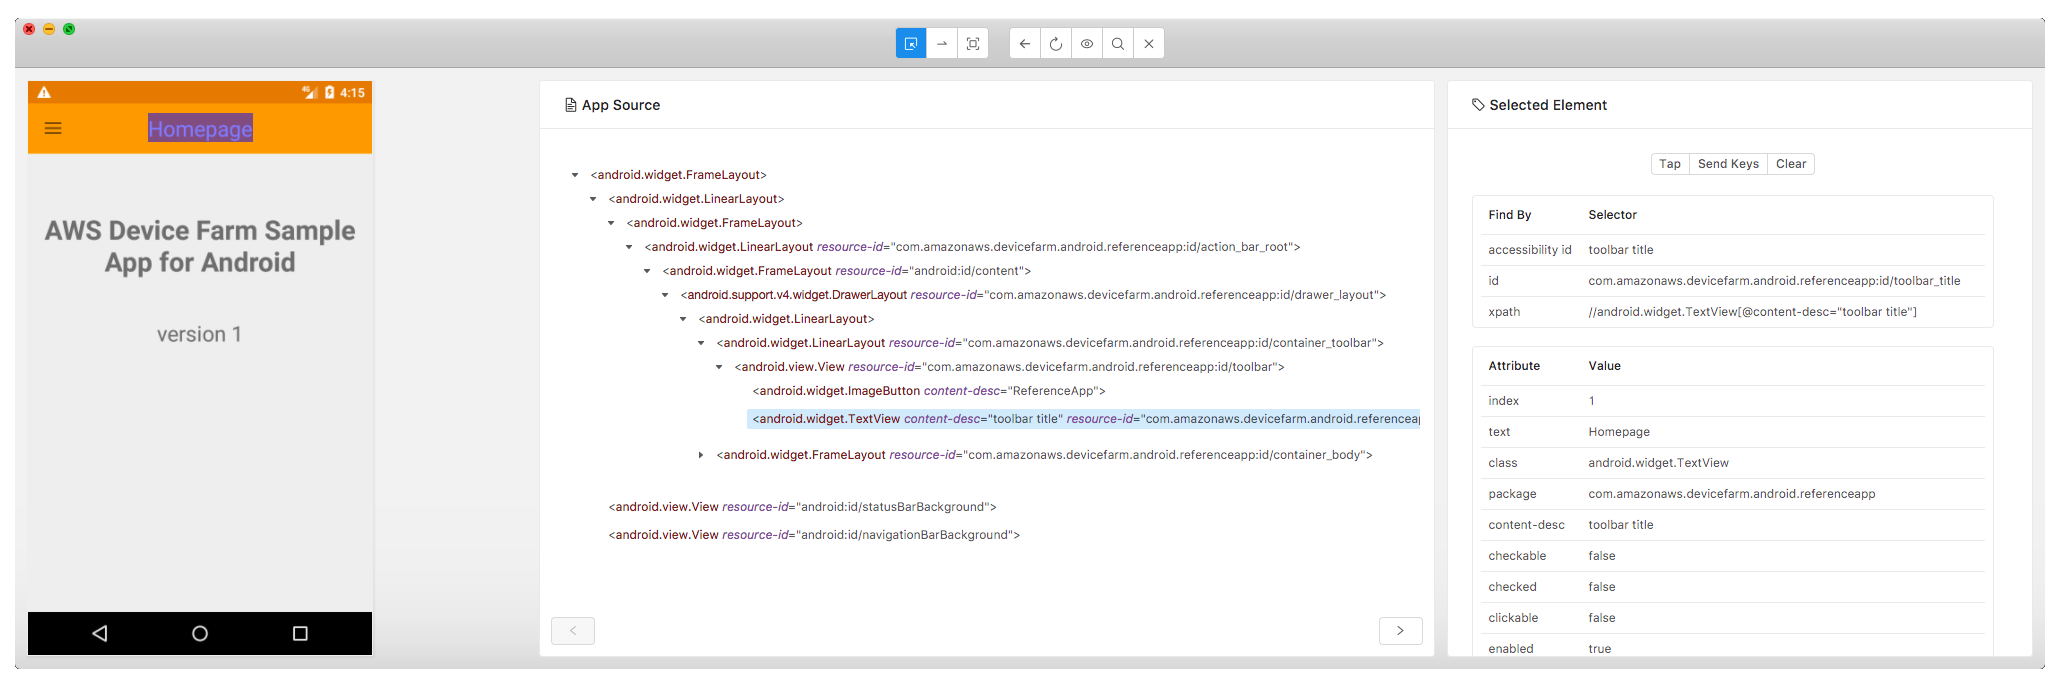
The data in the Find by Selector table and the Attribute Value table is the trick to writing effective Appium tests. These data points allow you to select our app’s element in the Java Appium test by finding it by a certain key-value pair, which the element matches. The two most common keys used by test writers are the “id” and “accessibility id” in the first table. The “text”, “class”, “resource-id”, and “content-desc” keys from the second table are also commonly used.
Now that you’ve gone over the element hierarchy of Appium, you can look at what Appium code looks like that (1) references these elements and (2) interacts with them. The building blocks of your TestNG and Cucumber tests look like this:
Writing TestNG tests that use Appium elements and Cucumber specifications
Now, let’s open up our sample tests in an integrated development environment (IDE)—preferably one with built-in support and highlighting for Maven projects, such as JetBrains IntelliJ. Maven is the Java build tool that you’ll use to install and bundle all of your dependencies. There are a few key settings in the Maven project that allow you to run tests in your desired environment. These settings are all preconfigured in our sample tests, but let’s go over them anyway, so that you can make sure that any tests you write are properly configured.
The first thing to do is to make sure that the following line is contained towards the top of your pom.xml file:
This line means that you’ll be building your Maven project into a single compressed JAR output file. This is necessary for Device Farm, but also makes running Appium tests simpler as well. For the same reason, make sure the following maven-jar plugin is in the plugins list:
Also, make sure that these dependencies are in the pom.xml:
The first dependency makes sure that Appium’s client software is included with your build, the second is for TestNG, the third is for Cucumber, and the last is for Cucumber’s TestNG plugin. Next, make sure that the following plugin is also in the plugins list:
This plugin makes sure that all of the dependencies for your project get included with the resultant JAR file. Check that the following plugin is included as well. This plugin is the assembly tool to parse your instruction file:
Then, make sure that the following instruction file is saved to src/main/assembly/zip.xml:
Now, you’re done setting up the project.
Finally, we’re going to set one more setting to make sure that the test connects to your emulator properly. Remember those “desired capabilities” that you entered earlier to view elements in the Appium Inspector? You need to set those same capabilities in your test. This is a step that’s only needed for local development. You don’t need these settings when you run your tests on Device Farm. Make sure you return here to comment out the relevant lines before you upload the tests to Device Farm.
Let’s look at the source code for the test to edit its capabilities. Go to src/test/java/Tests/AbstractBaseTest/TestBase.java, and look at lines 85–89:
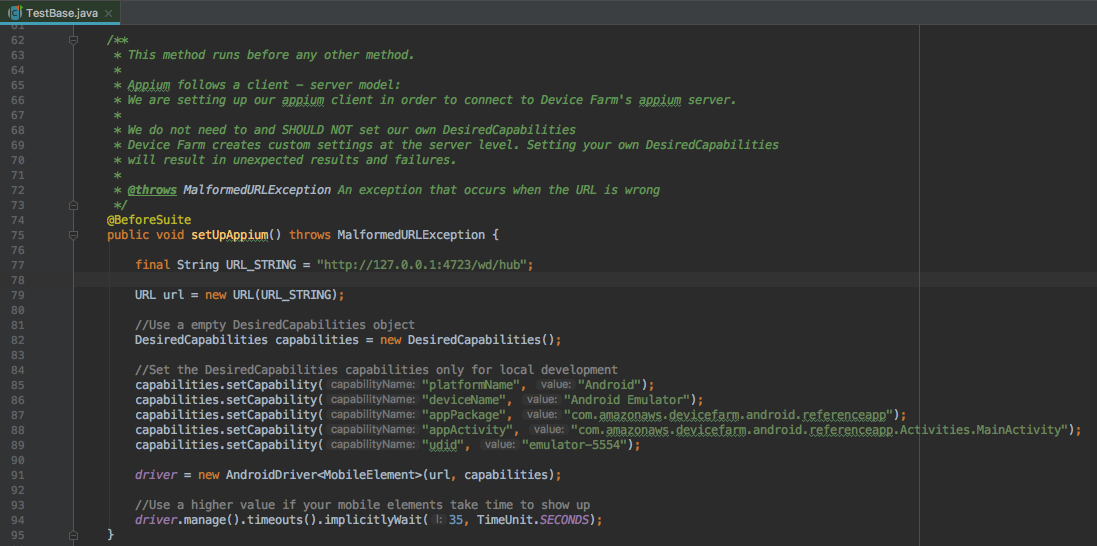
Do the capabilities look right in your sample tests? If not, modify them to look just like they did in the Appium Inspector so that you can connect to your emulator or device properly.
Now, let’s look at some real Appium code—in this case, for testing the login page. This is located in src/test/java/Pages/LoginPage.java:

Our example test structure adheres to Appium’s pagination model for testing. In this model, you separate the code for querying a page in an app with Appium from testing the results of that query with Cucumber/TestNG. In src/test/java/Tests/AbstractBaseTest/TestBase.java, there’s an example of a login page that uses Appium to find elements on the page and perform the login process.
See lines 58–68 of the login function for the best look at how Appium does its magic. You can see that the code goes through the process of choosing a user name field, filling it in with the text of the user name, choosing a password field, filling it in with the text of the password, and then choosing a login button. Each field and button corresponds to a real element on the screen of the app, just like you saw in the Appium Inspector.
In the login button definition from lines 31–32, you can see that the login button is found by using its Appium id selector. The following screenshot shows how to get that selector using Appium’s Inspector:

Well look at that—it shows the exact same id from the test in the Appium Inspector! So, if you wanted to write your own test on your own app, it’s not too hard to just get the id from the Appium Inspector and plug it into your Java code.
Now, let’s look at how to perform the testing itself by using TestNG and Cucumber on these Appium elements. Open up src/test/java/Tests/LoginTest.java:
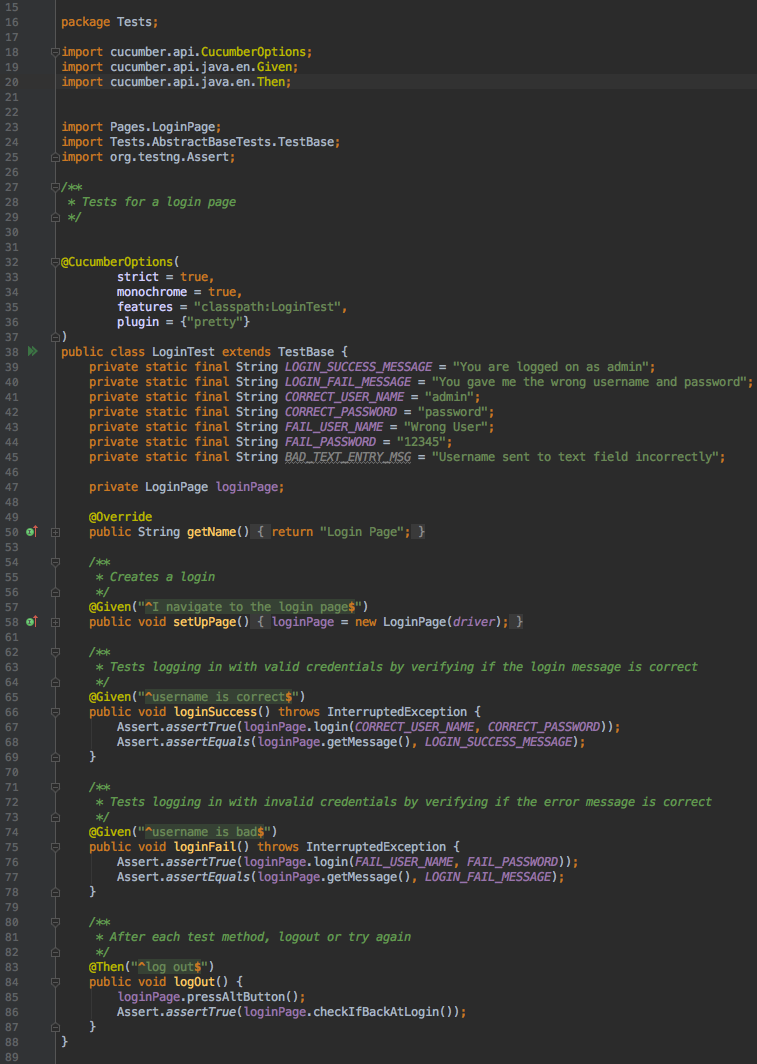
You’ll see a few familiar methods if you’ve written TestNG or Cucumber tests before. On the TestNG side, you see standard TestNG assertions. These perform the core of the testing functionality: asserting that certain things about the Appium output must be a certain way, or else the test will fail. If you check out the TestBase.java file from before, you see even more TestNG functions, with some annotated as @BeforeSuite and @AfterClass. These sorts of functions allow a sequence of events to occur when testing. This allows you to force TestNG to perform some methods before or after various points in your test.
Within a TestNG package, you structure each test method within suites and classes. Therefore, a method you annotate as @BeforeSuite would run before every new suite, @AfterClass would run after every new class, and so on. For more information about how to structure your TestNG test and annotate methods around it, see the TestNG documentation.
On the Cucumber side, you see some annotations like Given or Then, as well as the all-important annotation CucumberOptions. Given and Then annotations come from Cucumber’s model of how to convert natural language test specifications to code. These annotations are given a string as their parameter. That string is a regular expression that contains most of a sentence or phrase. Check out the src/test/resources/LoginTest/LoginTest.feature file to see what specifications these tests are referring to. This feature file is specified in the CucumberOptions directory as the value to the features key:

Check that out—a business specification for how the behavior of your login page should work, complete with phrases that would match the regular expressions in the annotations of your test!
This is the biggest advantage of Cucumber and why it’s such a great testing framework. Even though correlating your test code to explicit specifications adds short-term overhead to your test writing, this practice can save you from unnoticed mistakes in the long run, as specs change over time. By using the TestNG plugins for Cucumber that you added to pom.xml earlier, it’s easy for you to use Cucumber specifications and features within a TestNG suite of Appium tests.
Now that we’ve gone over the requirements for running tests and the code for how your tests work, you’re ready for a test run. Run the following from the root of the project directory (either in a terminal window or within your IDE’s terminal) to watch the tests run on your emulator:
And voila!
Deploying Appium/TestNG tests to Device Farm
Next, let’s run these tests on some real devices rather than just on an Android emulator. In just a few steps, you’ll be watching your sample test run automatically on devices in the cloud:
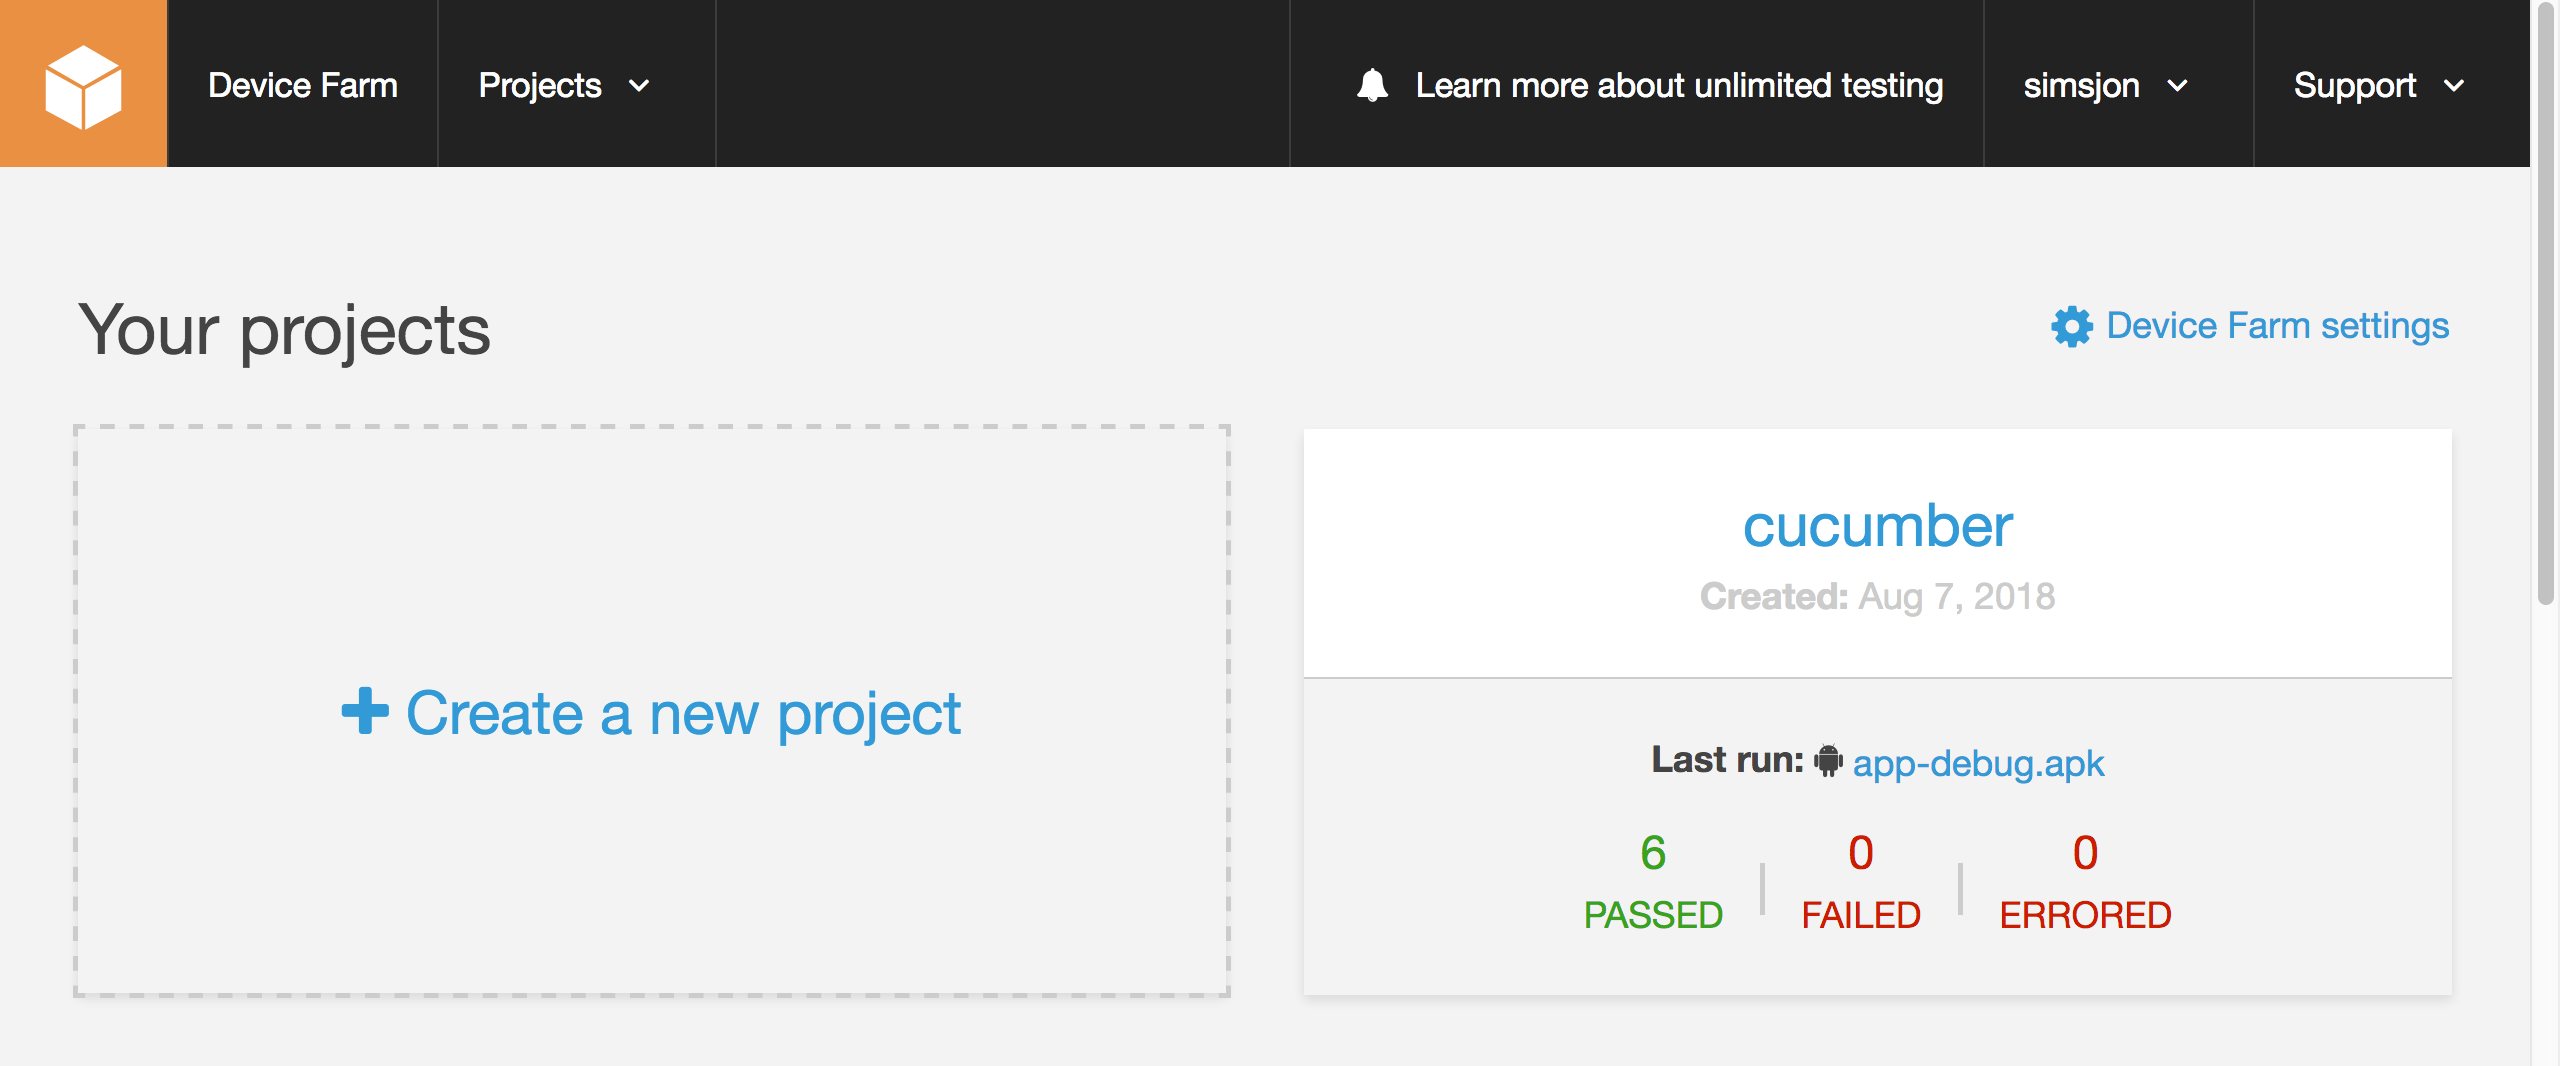
- Open the AWS Device Farm Console.
- Choose Start testing today if the screen is present.
- Choose Create a new project to set up a project. A project is a logical grouping of test runs that are usually organized around a single app or Android project.
- Choose Create a new run to set up your automation test run.

- Choose the button with the Android and iOS icons in it. This just means that you’re testing a native mobile app rather than a mobile web app.
- Upload the Device Farm sample app’s APK file. You can find this file inside the directory where you initially built it with Android Studio at app/build/outputs/apk/app-debug.apk.
- Choose Next to go to the Configure menu.
- Choose Appium Java TestNG as your test type.
- Upload a file called zip-with-dependencies.zip. You can find this in the target folder of your TestNG tests after you run the Maven command. This file is built and packaged from the instructional text file you saved earlier in your Maven project. It contains all of your dependencies for your project as Java class and JAR files—so everything running in Device Farm is just as it was on your local machine.
- Finally, choose Customize your test environment to see a glimpse into the inner workings of Device Farm:

Through this interface on the bottom half of the screen, you can see how the tests run on Device Farm servers, and then edit the run commands to best suit your needs!
This is awesome for a lot of reasons, but let’s demonstrate with a simple use case for now. Cucumber solves a big problem that test frameworks encounter by simplifying test output to complete natural language sentences. By using Device Farm’s custom execution environment settings, you can stop TestNG from polluting the beautiful Cucumber output by removing the “verbose output”.

- Choose Edit to edit the YAML configuration of commands that Device Farm runs.
- Scroll down to line 43, and remove the -verbose 10 option at the end of the main test runner command.
- Save this as a new YAML file configuration.
- Choose the Next step button to proceed to the Select devices page.

- Select which devices to run the tests against. In this case, let’s watch it run on all the recommended devices in Device Farm, so you don’t need to change any default settings. Choose Next to go to the Specify device state page.

- On the Specify device state page, you can change a lot of cool things about the device state, like the network profile and GPS location. You don’t need to change these settings for now, and can leave the default settings. Choose Next to go to the final review page.

- Finally, on the review page, choose Confirm and start the run!
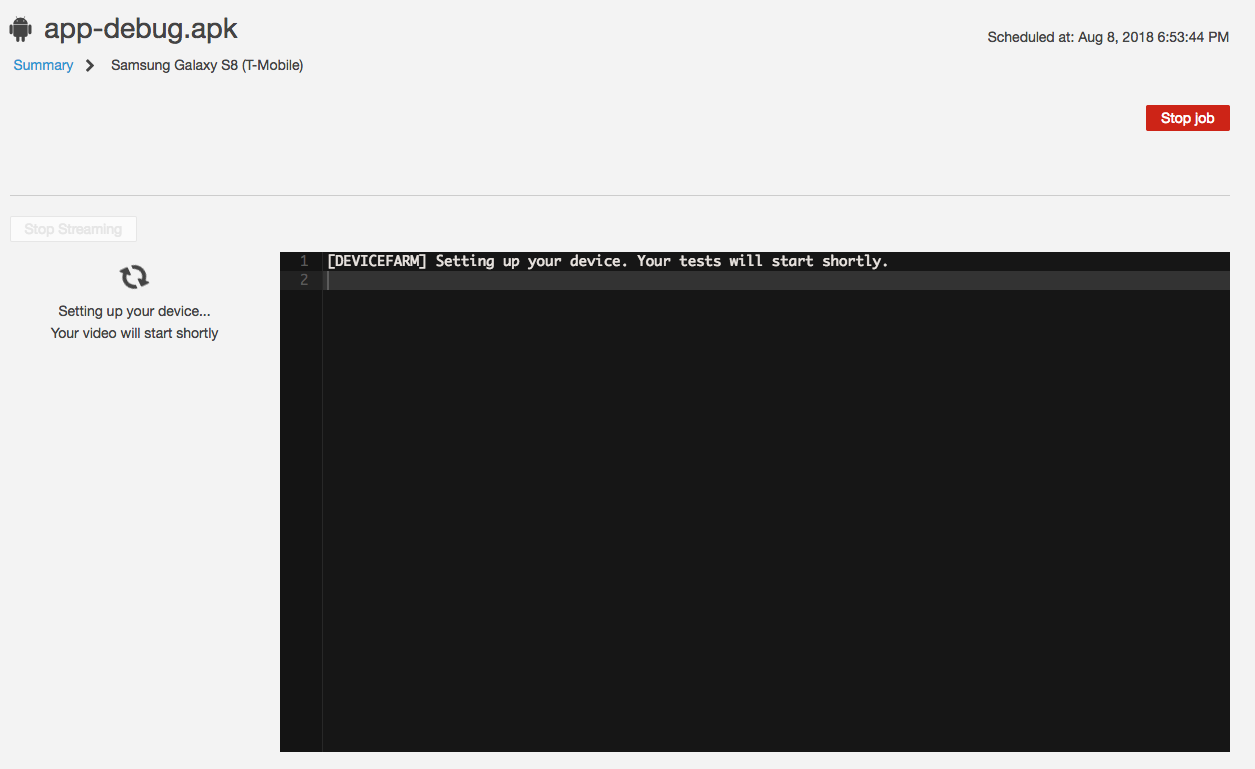
You can choose any of the devices on the main Run screen to watch the test in real time. Choosing a device brings up the device’s video and the corresponding logs produced from its test. This is what it looks like when the test first begins to set up:
And this is a screenshot of when the test begins to run:
And after the test is done, you can check out a detailed report of how the test went. You can also download the logs and video files that were produced during the run:

Next steps
That’s all for now! Stay tuned for more blog posts in the future about cool new ways to test mobile apps. To learn about ways you can meet your testing needs with Device Farm, see the Device Farm documentation. If you run into problems, find us on Stack Overflow and AWS Forums!
This post was written by Jon Sims. Jon is a Solutions Engineer on the AWS Device Farm team.