AWS Cloud Operations Blog
Monitor Amazon EKS Control Plane metrics using AWS Open Source monitoring services
Have you encountered situations where your Kubernetes API calls are constantly throttled by the control plane? Did you see the 429 HTTP response code “Too many requests” all over the place and have no clue on what’s wrong with your cluster? In this blog post, we will talk about monitoring some of the key metrics of the control plane that can help pro-actively identify the above mentioned situations using AWS Open source monitoring services.
The control plane of Kubernetes cluster makes global decisions about the cluster (for example, scheduling), as well as detecting and responding to cluster events (for example, starting up a new pod when a deployment’s replicas field is unsatisfied). As a result, monitoring the Control plane metrics is as important as monitoring your applications. These metrics can give you insights into control plane’s performance and help identify issues pro-actively. For example, API server metrics can help identify poorly written controllers that can overload API servers, affecting your applications’ availability. Similarly, collecting etcd metrics can help monitor the etcd size and ensure the database limit is not exceeded that can result in cluster entering a read-only state.
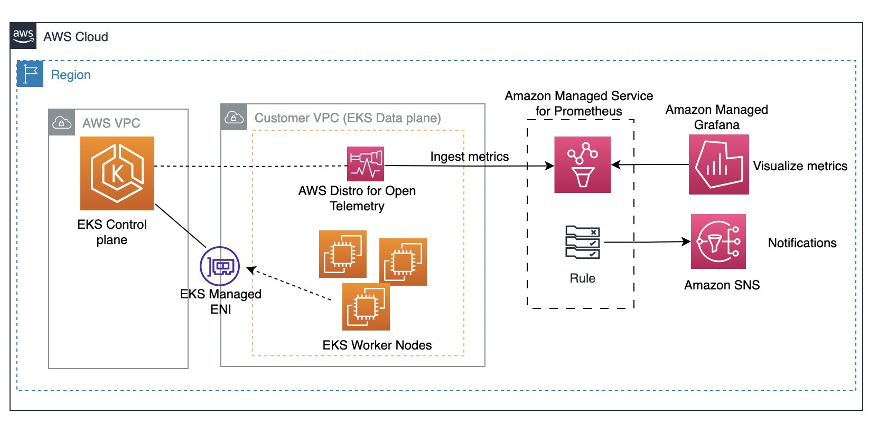
Amazon EKS Control plane exposes a number of metrics through the metrics endpoint that refers to the /metrics HTTP API. In this blog post, we will use AWS Distro for OpenTelemetry (ADOT) to scrape these metrics and use Amazon Managed Grafana to visualize them. ADOT is an AWS distribution based on the Cloud Native Computing Foundation (CNCF) OpenTelemetry project. It offers various advantages like, a native Kubernetes SD (service discovery) integration that can automatically discover and scrape metrics from K8s components, Native support for creating recording and alerting rules based on metrics etc. Amazon Managed Service for Prometheus is a managed service from AWS which can reliably store the metrics scraped by prometheus and customers does not have to worry about scaling. Amazon Managed Grafana provides visualization with Pre-built panels and dashboards for visualizing Prometheus metrics.
By leveraging ADOT, Amazon Managed Service for Prometheus and Amazon Managed Grafana, we get an end-to-end platform for monitoring, alerting, and visualizing EKS control plane metrics. ADOT’s tight K8s integration combined with Grafana’s rich visualizations provide observability into the health and performance of our clusters. We will be expanding the solution to include recording and alerting rules based on the control plane metrics, and send notifications to an SNS topic when alerts trigger.
Pre-requisites
Before starting, make sure you have the following:
- An Amazon EKS cluster running Kubernetes 1.25 or later. Follow the Amazon EKS Getting Started Guide to create a cluster.
- AWS CLI version 2. Install instructions are here.
- kubectl – Install instructions are here.
- eksctl – Install instructions are here.
- Github – Install instructions are here
Solution Overview
The ADOT collector scrapes the control plane metrics from the API server endpoint. Using the ADOT’s pipeline configuration, we will ingest the metrics collected to Amazon Managed Service for Prometheus. We will be configuring recording and alert rules in the workspace to send notifications to SNS topic. Finally, using the Amazon Managed Grafana we will be creating the dashboards for the control plane metrics. The techniques can also be extended to track worker nodes, services, and applications. Overall, Prometheus and Grafana prove to be key for cloud-native Kubernetes monitoring and alerting. The flow of this solution is as below:
Step 1: Create an Amazon Managed Service for Prometheus workspace
The Amazon Managed Service for Prometheus workspace stores the API server’s Prometheus metrics collected from the ADOT operator. A workspace is a logical and isolated Prometheus server dedicated to Prometheus resources such as metrics. A workspace supports fine-grained access control for authorizing its management, such as update, list, describe, and delete, as well as ingesting and querying metrics. In this step we will create a workspace for Amazon Managed Service for Prometheus. You start by setting a few environment variables:
export AWS_REGION=<Your AWS REGION>
export EKS_CLUSTER_NAME=<Your EKS Cluster Name>
export SERVICE=prometheusservice
export RELEASE_VERSION=`curl -sL https://api.github.com/repos/aws-controllers-k8s/$SERVICE-controller/releases/latest | grep '"tag_name":' | cut -d'"' -f4`
Use AWS CLI to create the workspace using the following command:
aws amp create-workspace --alias blog-workspace --region $AWS_REGION
Step 2: Deploy ADOT Add-on
Let’s deploy the AWS Distro for Open Telemetry Collector as an EKS Addon to ensure the process is smooth. For this as a pre-req, lets install Cert-manager.
kubectl apply -f https://github.com/cert-manager/cert-manager/releases/download/v1.8.2/cert-manager.yamlVerify that cert-manager is ready using the following command.
kubectl get pod -w -n cert-managerAnd then associate OIDC provider to your EKS cluster as below
eksctl utils associate-iam-oidc-provider --region=$AWS_REGION --cluster=$EKS_CLUSTER_NAME --approveWe will be deploying the ADOT collector to run under the identity of a Kubernetes service account. IAM roles for service accounts (IRSA) lets you associate the AmazonPrometheusRemoteWriteAccess role with a Kubernetes service account, thereby providing IAM permissions to any pod utilizing the service account to ingest the metrics to Amazon Managed Service for Prometheus. Let’s create an IAM role and Kubernetes Service Account so that EKS can send metrics to Amazon Managed Service for Prometheus
eksctl create iamserviceaccount \
--name adot-collector \
--namespace default \
--region $AWS_REGION \
--cluster $EKS_CLUSTER_NAME \
--attach-policy-arn arn:aws:iam::aws:policy/AmazonPrometheusRemoteWriteAccess \
--approve \
--override-existing-serviceaccounts
Check ADOT add-on version, here we are running EKS v1.27.
aws eks describe-addon-versions --addon-name adot --kubernetes-version 1.27 --query "addons[].addonVersions[].[addonVersion, compatibilities[].defaultVersion]" --output textThe above command should give you the list of available versions as below.
v0.80.0-eksbuild.2      True
v0.80.0-eksbuild.1      False
v0.78.0-eksbuild.2      False
v0.78.0-eksbuild.1      False
v0.76.1-eksbuild.1      False
v0.74.0-eksbuild.1      False
Let’s create the ADOT Operator Add On with the latest version
aws eks create-addon --addon-name adot --addon-version v0.80.0-eksbuild.2 --cluster-name $EKS_CLUSTER_NAMEVerify that ADOT Operator add-on is ready using the following command.
kubectl get po -n opentelemetry-operator-systemNAME READY STATUS RESTARTS AGE
opentelemetry-operator-controller-manager5b89b7df46-4z96l 2/2 Running 0 10dStep 3: Scrape control plane metrics using AWS Distro for OpenTelemetry Collector
Next, we will have to deploy a collector that can scrape the API server’s metrics. Amazon Managed Service for Prometheus does not directly scrape operational metrics from containerized workloads in a Kubernetes cluster. You must deploy and manage a Prometheus server or an OpenTelemetry agent, such as the AWS Distro for OpenTelemetry Collector (ADOT) to perform this task. The ADOT-Amazon Managed Service for Prometheus pipeline lets us use the ADOT Collector to scrape a Prometheus-instrumented application, and then send the scraped metrics to Amazon Managed Service for Prometheus.
The API server is already instrumented to provide a metrics endpoint to monitor the Kubernetes API server. We will be scraping the metrics from this endpoint using ADOT and will be remote writing these metrics to Amazon Managed Service for Prometheus workspace. Flow control in the context of the Kubernetes API server refers to mechanisms for throttling and queuing requests to prevent the API server from being overwhelmed and maintain stability. Some of the metrics of interest are as below:
apiserver_flowcontrol_request_wait_duration_seconds– Measures the time a request waits in the flow control queue before being dispatched. This indicates if requests are being throttled by flow control.apiserver_flowcontrol_request_execution_seconds– Measures the time a request takes to actually complete after being dispatched. This shows if the API server is slow to respond to requests.apiserver_flowcontrol_dispatched_requests_total– Counts the number of requests dispatched from the flow control queue. This helps track overall throughput.apiserver_flowcontrol_request_concurrency_limit– The maximum concurrency limit enforced by flow control. This limit can be configured and tuned as needed.apiserver_flowcontrol_current_inqueue_requests– The current number of requests waiting in the flow control queue. Indicates backlogapiserver_storage_size_bytes– Etcd database size
In summary, these metrics allow you to monitor flow control limits, queuing, concurrency, and execution times for the Kubernetes API server. This helps ensure the API Server can handle load and scale appropriately without overwhelming backend components like etcd.
There are also other metrics such as apiserver_flowcontrol_rejected_requests_total that can be monitored to check the impacted FlowSchemas and PriorityLevelConfigurations if any of the requests to API server is being dropped due to APF.
For a complete list of APF metrics please refer to APF Metrics.
Tuning flow control and tracking these metrics helps maintain stability and performance of the API as usage grows. The API server is a critical Kubernetes component, and monitoring the component is important for measuring the health and capacity of a Kubernetes cluster. You need kubectl and eksctl CLI tools to run the script. They must be configured to access your Amazon EKS cluster.
export WORKSPACE=$(aws amp list-workspaces | jq -r '.workspaces[] | select(.alias=="apiserver-amp").workspaceId')
export REMOTE_WRITE_URL="https://aps-workspaces.$AWS_REGION.amazonaws.com/workspaces/$WORKSPACE/api/v1/remote_write"
export SNS_TOPIC=<your SNS topic>
export REMOTE_WRITE_URL="https://aps-workspaces.$REGION.amazonaws.com/workspaces/$WORKSPACE/api/v1/remote_write"
Now let’s use the below YAML file, replacing the values, with the scrape configuration to extract API server metrics and deploy the ADOT collector.
curl -O https://raw.githubusercontent.com/aws-observability/aws-otel-community/master/sample-configs/operator/collector-config-amp.yaml
sed -i '' "s/<YOUR_AWS_REGION>/$AWS_REGION/g" collector-config-amp.yaml
sed -i '' "s,<YOUR_REMOTE_WRITE_ENDPOINT>,$REMOTE_WRITE_URL,g" collector-config-amp.yaml
kubectl apply -f collector-config-amp.yaml
After the ADOT collector is deployed, it will collect the metrics and ingest them into the specified Amazon Managed Service for Prometheus workspace. The scrape configuration is similar to that of a Prometheus server. We have added the necessary configuration for scraping the API server.
Step 4: Setup Alert Manager in Amazon Managed Service for Prometheus to send notifications (Optional)
Let’s configure recording rules and alerting rules for the API server metrics captured and send notifications when the value exceeds the threshold specified. We will leverage Alert Manager’s SNS receiver to send notifications to the SNS topic. Recording rules let you precompute frequently needed or computationally expensive expressions, and then save their result as a new set of time series. Then, querying the precomputed result will often be much faster than executing the original expression whenever it is needed. You could get the files required from the Github repo here. Let’s upload the files to Amazon Managed Service for Prometheus workspace:
base64 -i apiserver-rules.yaml -o apiserver-rules-b64.yaml
base64 -i apiserver-alerts.yaml -o apiserver-alerts-b64.yaml
aws amp create-rule-groups-namespace --data file://apiserver-rules-b64.yaml --name apiserver-rules --workspace-id $WORKSPACE --region $AWS_REGION
aws amp create-rule-groups-namespace --data file://apiserver-alerts-b64.yaml  --name apiserver-alerts --workspace-id $WORKSPACE --region $AWS_REGION
Alerting rules configured will send alerts to the Alert Manager, which can route notifications to SNS via the SNS receiver. Amazon Managed Service for Prometheus’s Alert Manager currently supports SNS as its destination. In turn, this can send notifications to different destinations such as Slack, PagerDuty, OpsGenie, etc. The following example YAML, fetched from the Github repo, is an alert manager definition that sends notifications to SNS. Make sure you have created the SNS topic and subscriptions before proceeding by following this link.
base64 -i alertmanager.yaml -o alertmanager-b64.yaml
aws amp create-alert-manager-definition --data file://alertmanager-b64.yaml --workspace-id $WORKSPACE --region $AWS_REGION
Step 5: Visualize API Server metrics using Amazon Managed Grafana
You could create an Amazon Managed Grafana workspace by following this link. Post that, connect the Amazon Managed Service for Prometheus workspace as a data source as described here. You could create custom dashboards by creating panels as described here. For now we have created a custom dashboard for you to get started with. The file can be downloaded as apf-grafana.json from the repo. A screenshot of the dashboard is shown below. The dashboard contains panels to monitor some of the key control plane metrics discussed in this blog post. Feel free to add metrics of your interest.

Conclusion
In this post, we explained why monitoring the Kubernetes control plane is important and went through the steps to set up monitoring and alerting for Amazon EKS control plane metrics using AWS Distributed OpenTelemetry(ADOT), Amazon Managed Service for Prometheus and Amazon Managed Grafana. To Summarize, The ADOT collector provides an easy way to scrape metrics from EKS and forward them to Amazon Managed Service for Prometheus. With Amazon Managed Service for Prometheus, we don’t need to manage Prometheus servers ourselves. Amazon Managed Service for Prometheus offers a fully managed Prometheus backend that lets you store metrics reliably. With the help of Recording rules and Alert Manager configuration, we showed how you can capture the critical metrics of EKS control plane and send notifications. Finally, we visualized these metrics using Amazon Grafana. Some key metrics like API server latency, request saturation, error rates, etcd_size etc. provide good insights into control plane health. The techniques used here can also be leveraged to monitor EKS worker nodes, Kubernetes services, and application metrics.
Further Reading
To learn more about AWS Observability services, please check the below resources:
- Hands-on experience with AWS Observability Workshop
- AWS Observability Best Practices Guide
- AWS Observability Accelerator for CDK
- AWS Observability Accelerator for Terraform
- Free course on AWS Skill Builder – Observability
About the authors