AWS Cloud Operations Blog
Setting up monitors for .NET Application and Microsoft SQL Server using Amazon CloudWatch Application Insights
Many Windows-based applications are .NET applications using Windows SQL Server on the backend to retrieve and persist data. On the journey to the cloud, these applications are often re-hosted with a lift-and-shift approach. When such an application is hosted on the Amazon Elastic Compute Cloud (Amazon EC2) Windows platform, although native Windows-based tools are available to monitor the health of these applications at a server level, getting a complete view across the different components and servers deployed as part of the solution is a challenge. Amazon CloudWatch Application Insights makes it possible to monitor resources across different EC2 instances, providing a powerful dashboard view into the health of the entire solution.
CloudWatch Application Insights can help enterprise users set up monitoring for their applications in a unified manner on AWS with minimal effort. In addition to the ease in getting started, automated functions set up collection and analysis of recommended metrics (platform, OS, and other agent-specific metrics), application and operating system logs, dynamic alarms, and automated detection of problems, combining insights from Amazon CloudWatch, X-Ray, AWS Health, and other events.
In this post, we show you how to configure CloudWatch Application Insights to monitor a use case and simulate problem scenarios to test the implementation. The deployed scenario is a load balanced web application with SQL Server on the backend, each hosted on a different EC2 instance.
Solution overview
In the following sections, we look at how you can easily start monitoring a .NET application using SQL Server, running on a group of EC2 instances using CloudWatch Application Insights. The deployed configuration has two load-balanced EC2 instances hosting the sample AdventureWorks application, and each accesses a SQL Server database hosted in a different EC2 instance. We simulate that the application isn’t working and that we need to quickly identify, isolate, and resolve the issue. In this use case, we discuss the end-to-end scenario of setting up monitors for CloudWatch Application Insights and using CloudWatch Application Insights to configure, isolate, and resolve the issue with the application.
The following diagram illustrates the components of the solution, which is deployed using an AWS CloudFormation template.

Overview of the sample solution deployed
We walk you through the following high-level steps:
- Set up and configure CloudWatch Application Insights for the application.
- Simulate a problem scenario and observe the issue on the CloudWatch Application Insights dashboard.
- Run through a sequence of steps to identify the issue and dig deeper for details.
- We also discuss what steps are required in the absence of CloudWatch Application Insights.
To implement this solution, we use the following AWS services:
- Amazon EC2
- Application Load Balancer
- AWS CloudFormation
- CloudWatch
Prerequisites
For this walk through, you should have the following prerequisites:
- An AWS account
- An EC2 key pair
Deploying the resources for the use case
To make sure that the use case is ready to test out-of-the-box, we use this CloudFormation template to deploy the following:
- An EC2 instance hosting a Microsoft SQL Server database.
- A load-balanced autoscaling group, with 2–4 instances depending on the system load, each hosting the sample AdventureWorks web application.
This takes approximately 10 minutes to complete, with most of that time spent provisioning the services.
After you take care of the prerequisites, complete the following steps:
- In the AWS Management Console, choose the Region selector and switch to the US East (N. Virginia) Region.
- In the AWS CloudFormation console, choose Create stack.
- On the Select template page, choose Next.
- On the Specify details page, enter a name for your stack, such as ApplicationInsightsTest.
- Under Parameters, upload this template called Sampleapp.yml.
- Choose Next.
- Create or import an existing key pair that you can use to log in to the EC2 instance if required.
- Enter a password for SQL Server.
- Choose Next.
- Review your settings and select the check box acknowledging that the template may create AWS Identity and Access Management (IAM) resources.
- Choose Create stack.
You can monitor the status of the stack deployment on the Events tab of the CloudFormation stack. When the stack is deployed successfully, proceed to the next section.
Setting up CloudWatch Application Insights
To set up and configure CloudWatch Application Insights, complete the following steps:
1. On the console, navigate to AWS Resource Groups.
2. Choose Create Resource Group.

AWS Resource groups menu item
3. For Group type, select CloudFormation stack based.

Create query-based group dialog
4. For Group name, enter a name, for example ApplicationInsightsResourceGroup.
5. Choose Create group.
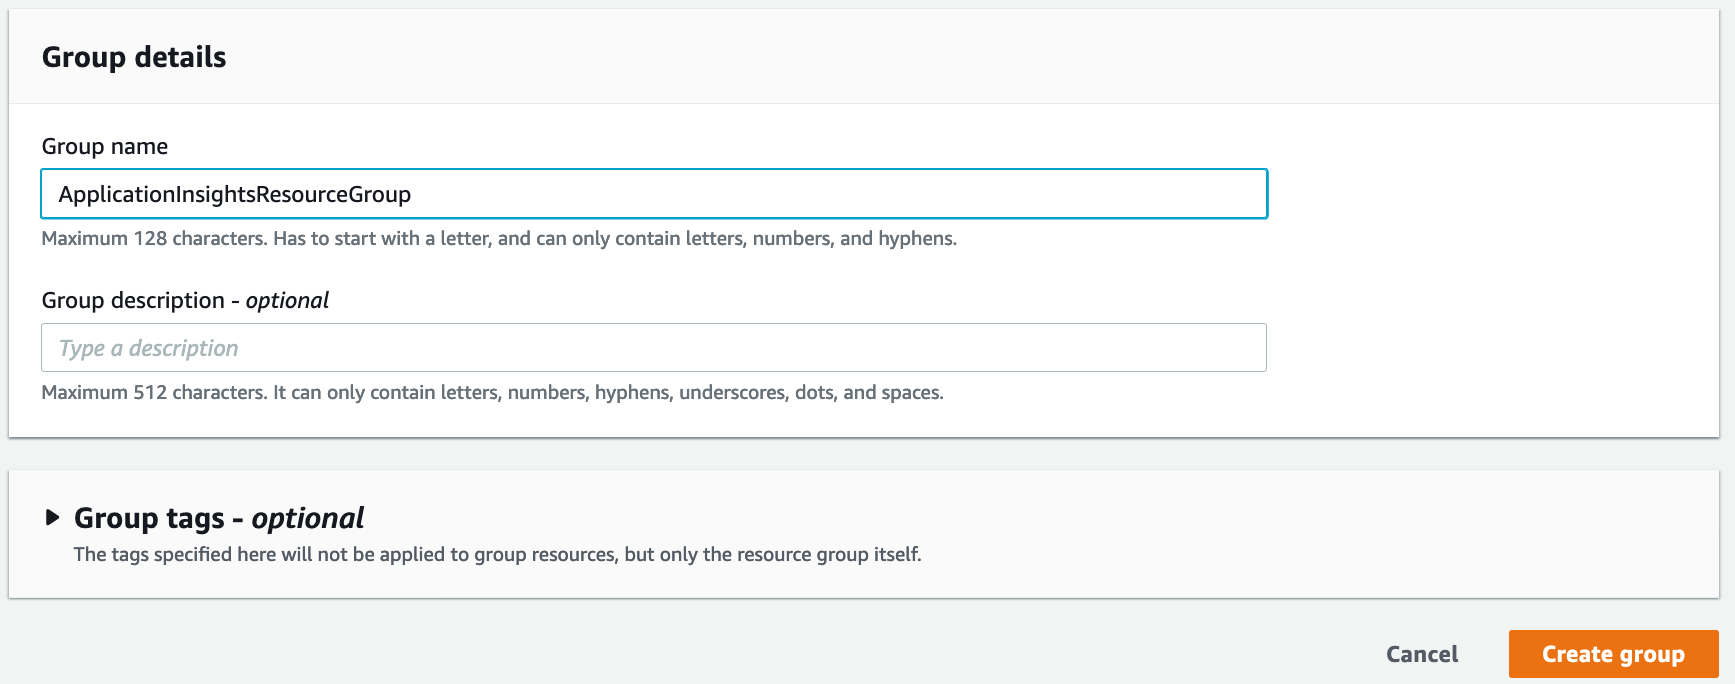
Entering group details to create a group
6. On the CloudWatch console, choose Settings.
7. In the Application Insights section, choose View applications.

Application Insights section within CloudWatch settings
8. Choose Add an application.
9. For Resource Group, choose the resource you created earlier.
10. Choose Add application.
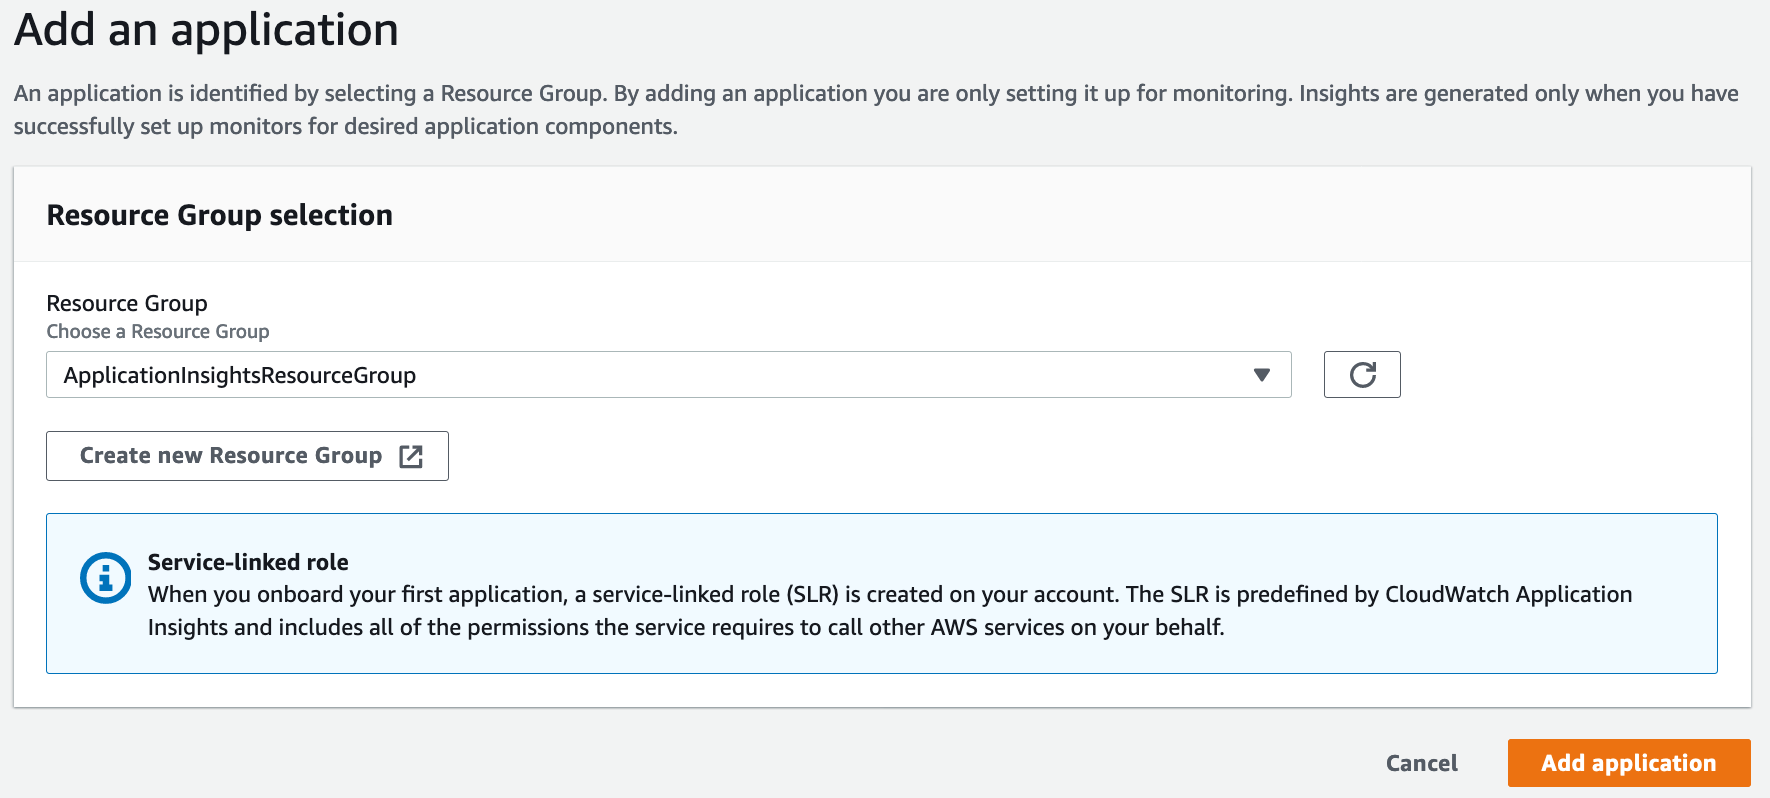
Adding an application to be monitored
11. Refresh to see the managed monitoring and application components

Application Components listed
12. Select the Application Load Balancer group component.
13. Choose Manage monitoring.

14. Select Enable monitoring.

Monitoring enabled for the application
15. For Application log 2, choose Remove.

Removing the Application Log 2
16. Choose Save.
17. Repeat these steps to enable monitoring for the second server and SQL Server instance.
18. For Metrics, enter the following metrics to monitor for SQL Server:
- CPUUtilization
- StatusCheckFailed
- Memory % Committed Bytes in Use
- Memory Available Mbytes
- Network Interface Bytes Total/sec
- Paging File % Usage
- Physical % Disk Time
- Processor % Processor Time
- SQLServer:Buffer Manager Buffer cache hit ratio
- SQLServer:Manager Page life expectancy
- SQLServer:Genearl Statistics Processes blocked
- SQLServer:General Statistics User Connections
- SQLServer:Locks Number of Deadlocks/sec
- SQLServer:SQL Statustics Batch Requests/sec
- System Processor Queue Length
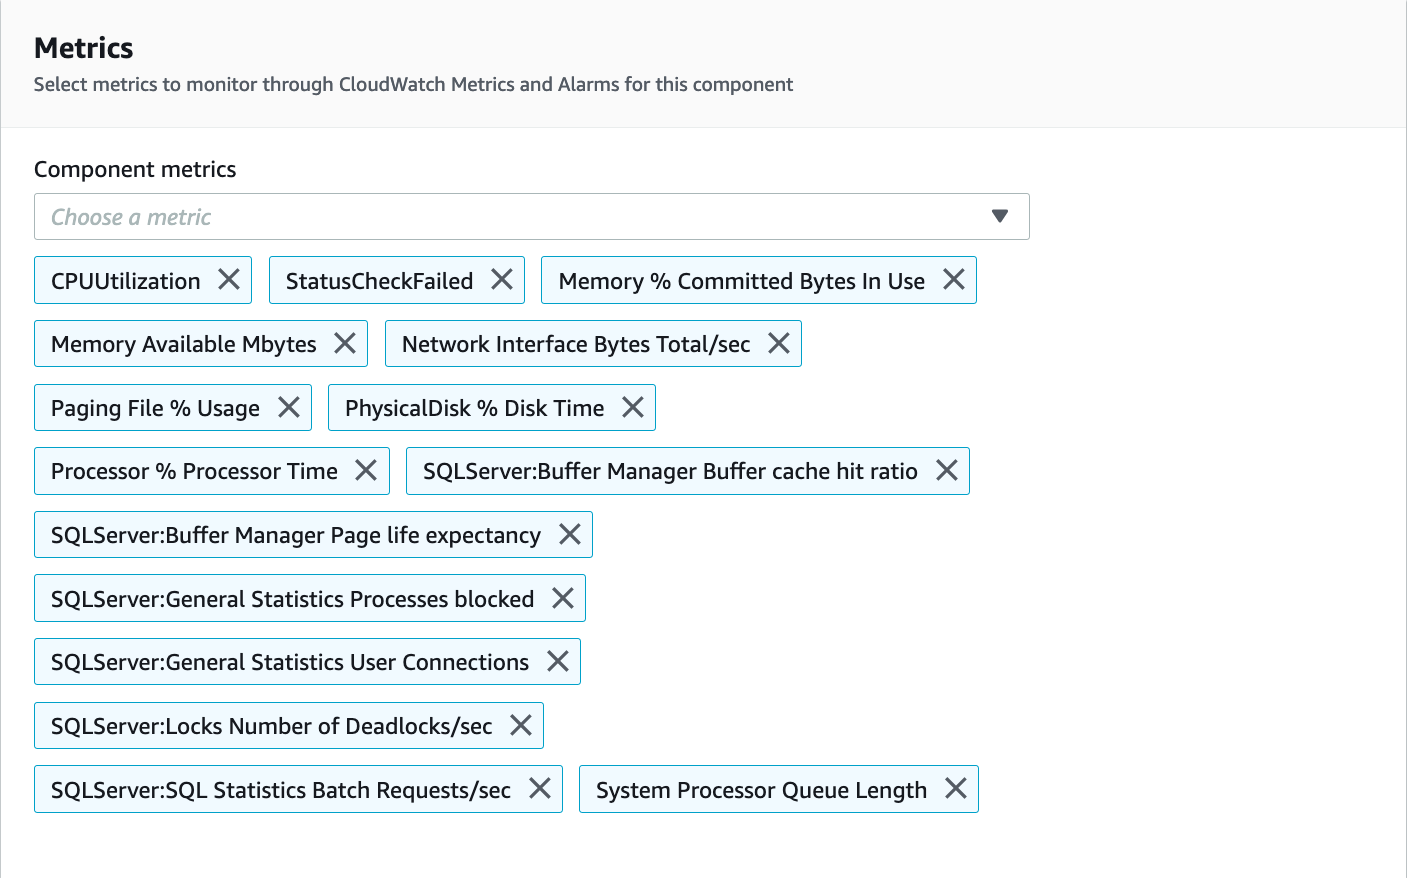
List of SQL Server Metrics monitored
After you enable monitoring for both load-balanced servers and the SQL Server instance, the resource group appears on the CloudWatch console as Enabled.
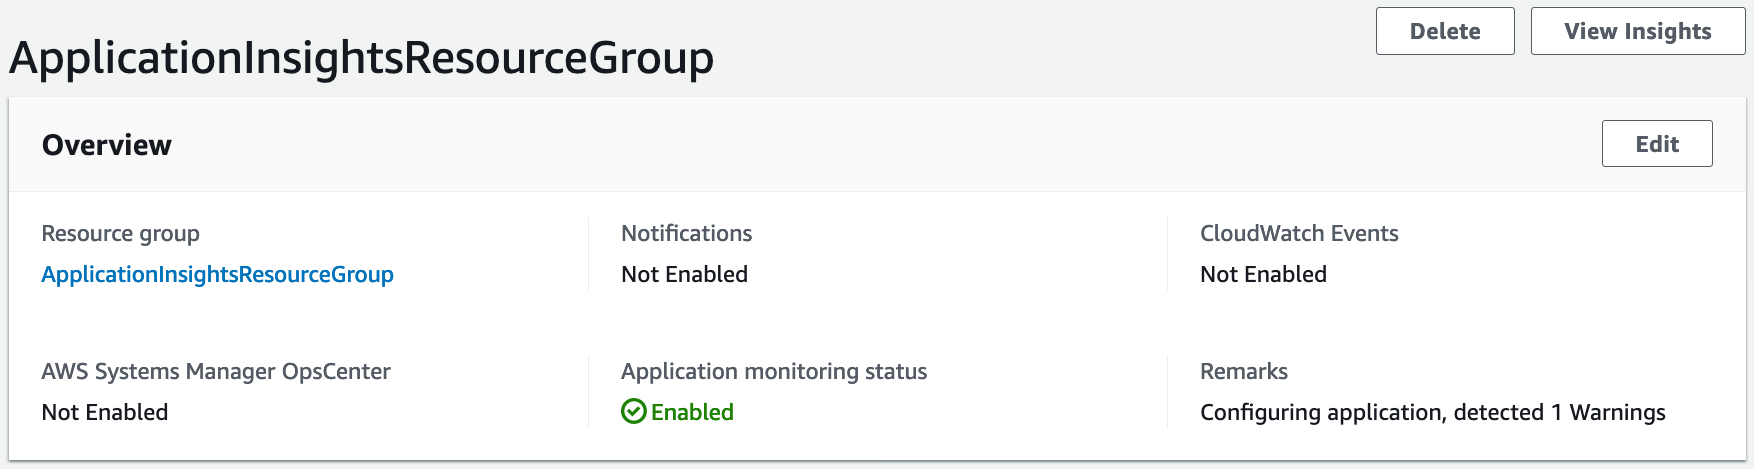
Application Insights resource group enabled for monitoring
Simulating a problem and monitoring with CloudWatch Application Insights
For this use case, we introduce problems in the ASP .NET application (which is backed by a SQL Server database). We then observe these issues on the dashboard.
To simulate both problems, connect to the Amazon EC2 machine hosting the database server (M5 instance type) using the key pair you chose when creating the CloudFormation stack.
SQL Memory pressure
In this first problem, the SQL Server database begins to malfunction because of a high volume of SQL queries leading to high memory consumption on the SQL Server database. This leads to application performance degradation and possibly timeout errors on the web servers and load balancer. To simulate this problem, complete the following steps:
- Launch SQL Server Management Studio.
- Log in using Windows Authentication:
- Open the server name drop-down menu and choose <Browse for more..>.
- Choose the database engine and the name of the PC.
- Select Ok and then select Connect.
- Choose the database server (right-click) and choose Properties.
- Lower the maximum memory for SQL queries to 256 KB.
- Lower the minimum memory to 64 KB.
- In a new query window, enter the following SQL query:
SELECT count(*) FROM [AdventureWorks2016].[Sales].[Customer] - Return to the CloudWatch dashboard to see the memory error.

SQL Memory Error being displayed in Microsoft SQL Management Studio

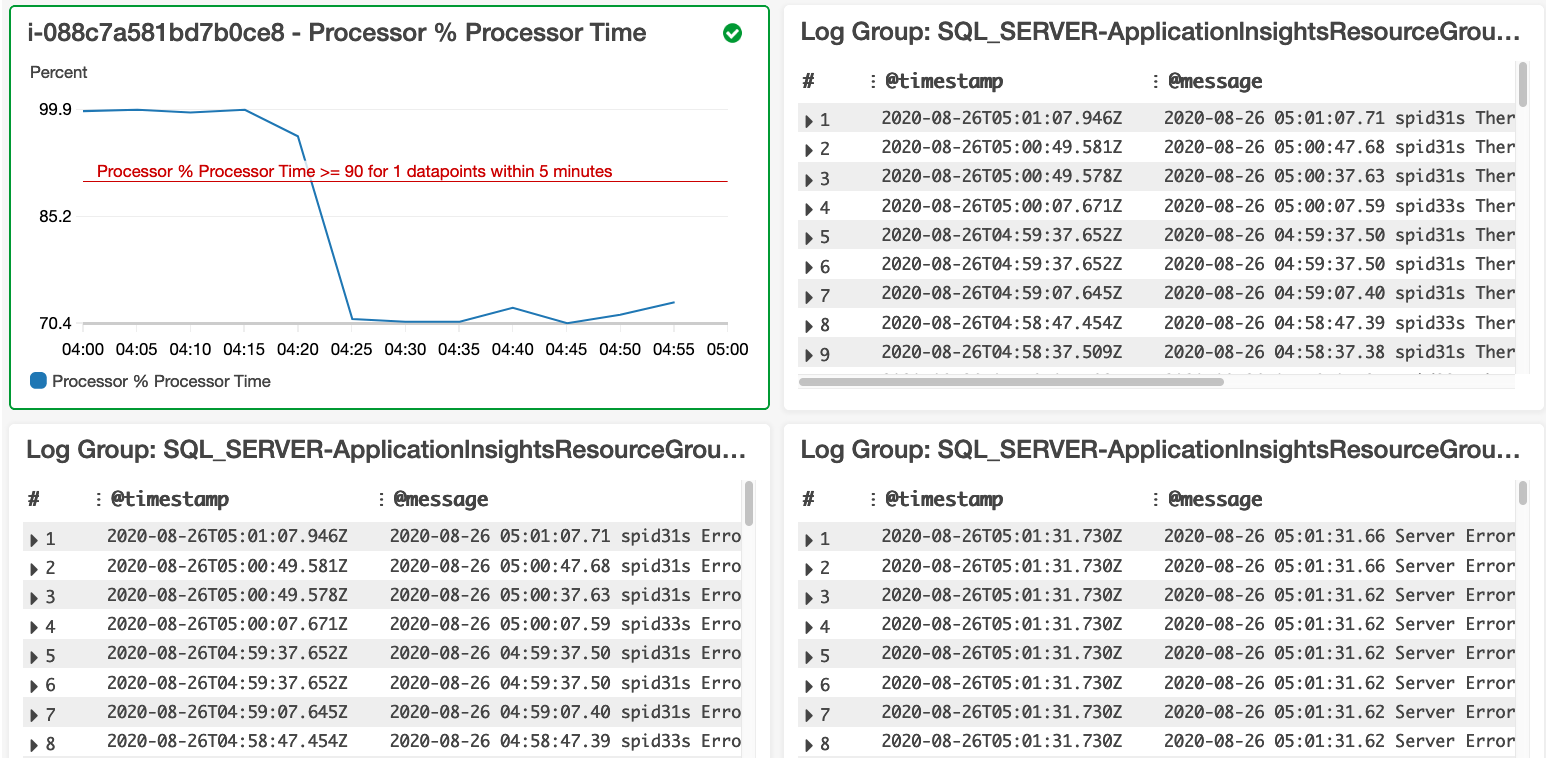
Memory error displayed in Log group

Error displayed in Log file
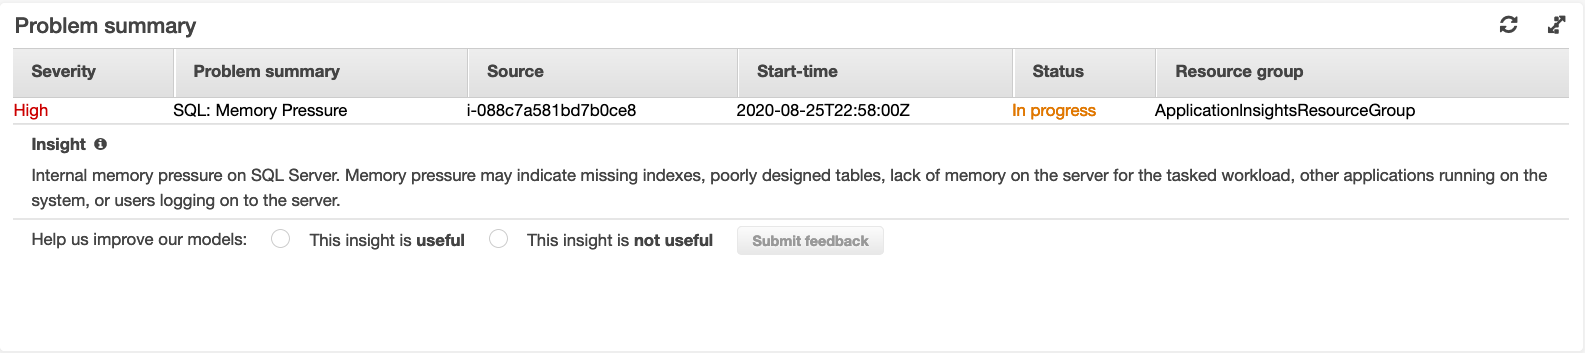
SQL Memory pressure error displayed in CloudWatch dashboard
HTTP 500 error: Unhandled HTTP request
For this error, you simulate an HTTP 500 error for an unhandled HTTP request.
- In the AWS CloudFormation console, choose the stack you launched earlier – ApplInsightsStack.
- On the Outputs tab, choose the URL value for WebsiteURL.
- To navigate to the customer details page of the sample AdventureWorks web application, add /SalesOrderDetails/edit/5 to the URL. For example, http://YourURL.us-east-1.elb.amazonaws.com/sampleapp/SalesOrderDetails/edit/5.
- Refresh the URL so the site pushes an error.
- Navigate to the CloudWatch dashboard to see the HTTP 500 error.
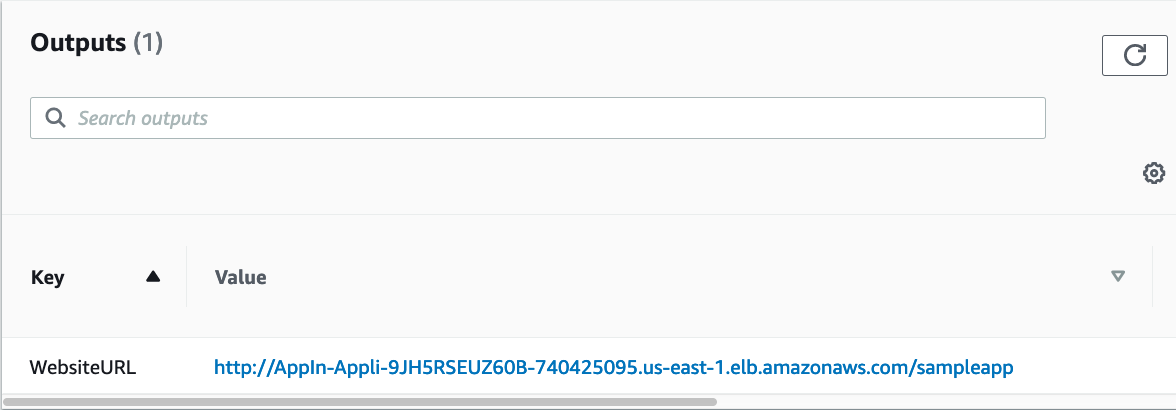
Website URL displayed as output
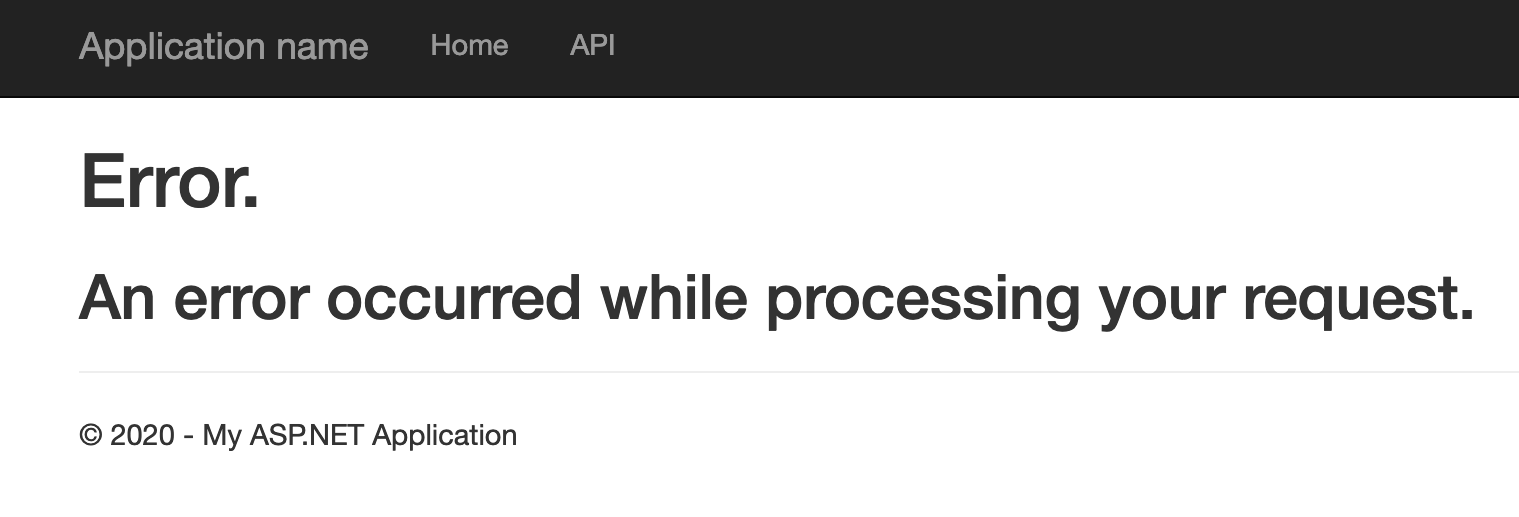
Refreshing the URL displays the error
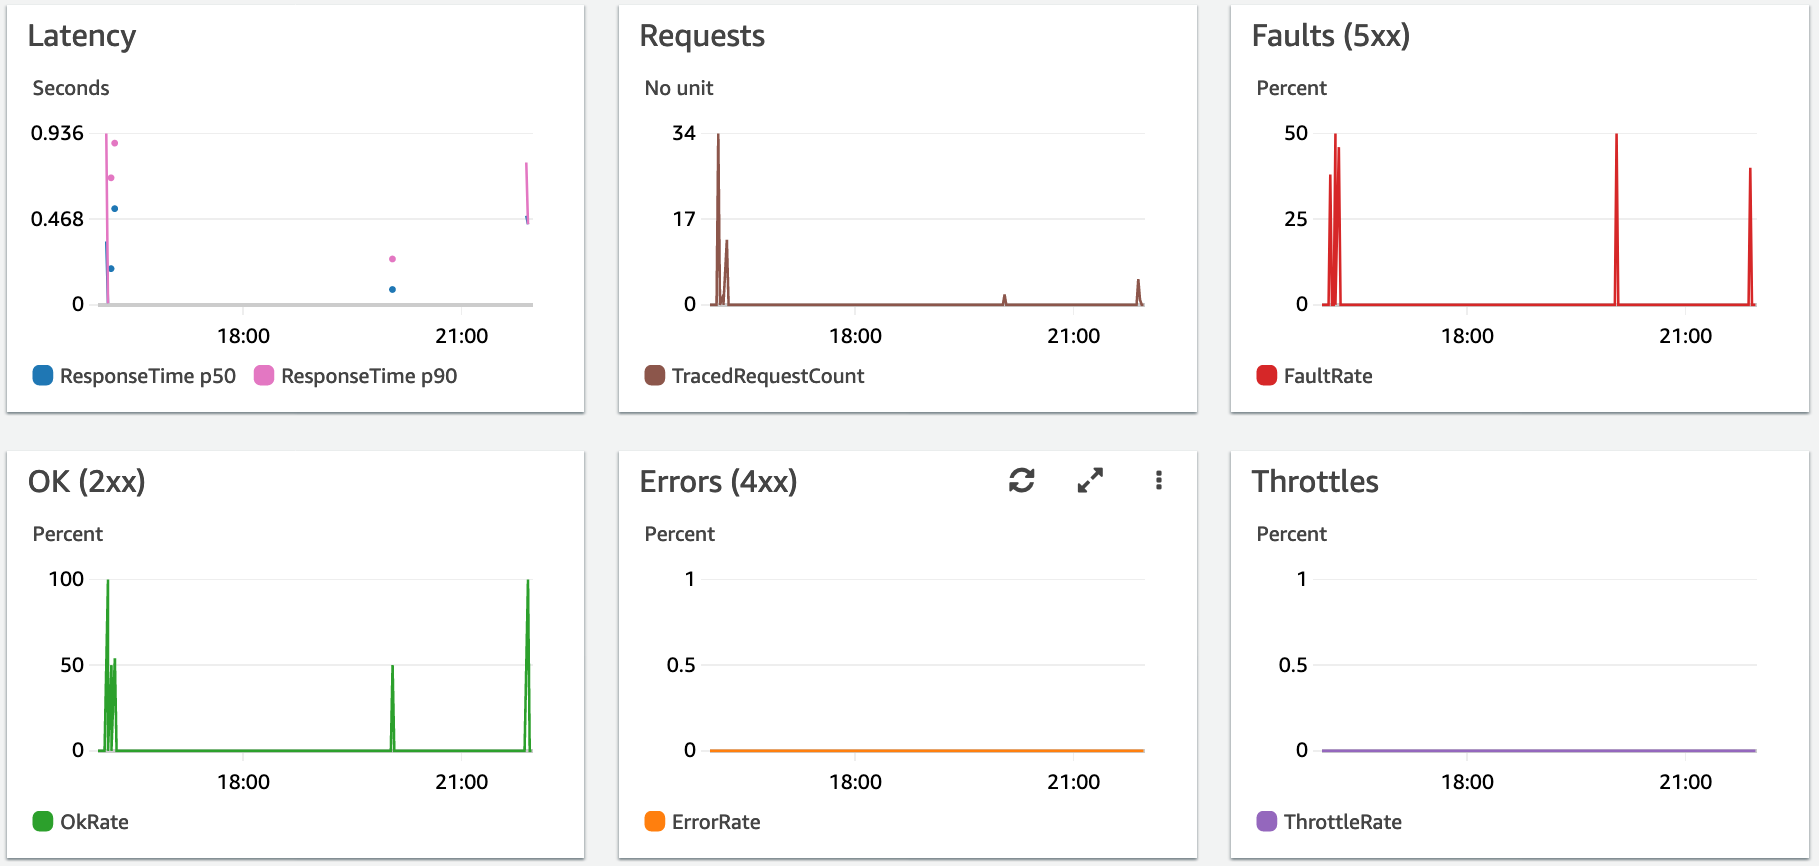
The following chart displays the HTTP 500 errors.

ALB Backend 5xx error displayed in the CloudWatch dashboard

ALB Backend 5xx error displayed as chart
The following screenshot shows the X-Ray service node details.

X-Ray service node details
The following screenshot shows the ServiceLens dashboard view.
ServiceLens dashboard view
The following screenshot is the IIS error log written on the .NET application instances. When the EC2 instance is configured to be monitored using CloudWatch Application Insights, a CloudWatch agent is correspondingly configured on the instance to publish the logs to CloudWatch.

Error 500 in IIS error log on the .NET application instances
The following chart shows both issues mentioned above:
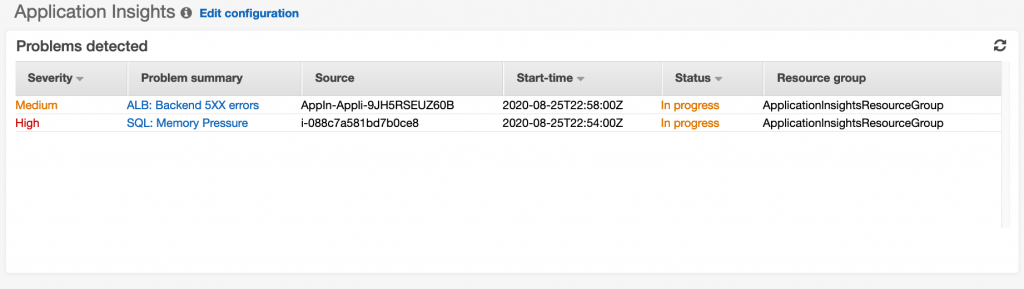
Both SQL Memory pressure error as well as Http 5xx errors shown in CloudWatch dashboard
Conclusion
In this post, we saw how to start monitoring your Windows workloads using CloudWatch Application Insights. CloudWatch Application Insights continuously monitors metrics and logs to detect and correlate anomalies and errors. The CloudWatch Application Insights dashboard helps you determine remedial actions to fix issues and provide alerts using built-in intelligence and automation. It can help you keep your application healthy and—most importantly—prevent any impact on your end-users.
Without this tool, identifying and tracking down this issue takes a lot of manual effort. This can be time-consuming and may lead to further downtime, especially in production scenarios where time is of the essence. For this use case, you would have to log in to the EC2 instance and check the SQL Server error logs to determine that it’s a SQL memory pressure issue.
CloudWatch Application Insights also helps by correlating problems using intelligent problem-detection patterns to display them in the dashboard quickly. CloudWatch Application Insights simplifies monitoring of the application and allows you to quickly identify problems within your application.
CloudWatch Application Insights continues to enhance observability for additional workloads and AWS resources. You can now get extended monitoring support for MySQL, SQL Server High Availability (HA), AWS Lambda, and Amazon DynamoDB. Additionally, if you deploy new SQL Server HA workloads using AWS Launch Wizard, you can enable CloudWatch Application Insights with a single click.
References
For more information about CloudWatch Application Insights, see:
- How Amazon CloudWatch Application Insights works
- Setting up your application for monitoring
- Logs and metrics supported by Amazon CloudWatch Application Insights

Saleha Haider is a Senior Partner Solutions Architect at AWS.