AWS Cloud Operations Blog
Use Contributor Insights to analyze AWS Network Firewall
AWS recently launched AWS Network Firewall, a stateful, managed network firewall that provides intrusion detection and prevention for Virtual Private Cloud (Amazon VPC).
In a large-scale enterprise environment, it can be difficult and time-consuming to inspect multiple log groups and log streams. Investigating a security incident across a Network Firewall fleet that spans different VPCs and multiple AWS accounts is a complex task and can be often challenging to diagnose in real time.
Which network segments are affected? Are there any common patterns for your application (for example, top domains or common IP addresses or ports that it talks to)? Perhaps you added a rule group to your Network Firewall and now want to know if any of your applications are experiencing issues. The data points you need to help answer these questions are buried in logs that engineers query for ad-hoc measurements or build custom dashboards to help track.
In this post, I show how you can use Contributor Insights to analyze log data and create time-series visualizations to provide a view of the top contributors influencing Network Firewall. This helps you to perform ongoing analysis for your firewall by easily surfacing outliers, top domains, top IP addresses, and more. You can use the data you gather to optimize your Network Firewall configurations. You can use Amazon CloudWatch Logs Insights to search and further analyze your firewall log data interactively. Being able to query your firewall logs can assist you in efficiently responding to operational issues. In addition to logs, Contributor Insights rules can also be used to create CloudWatch metrics, alarms, and dashboards.
Architecture
AWS Network Firewall offers two types of logs. Flow logs send logs for all network traffic that the stateless engine forwards to the stateful rules engine. Alert logs send logs for traffic that matches any stateful rule whose action is set to Alert or Drop. The information received from these two log types can be used to identify different network behaviors of your firewall.
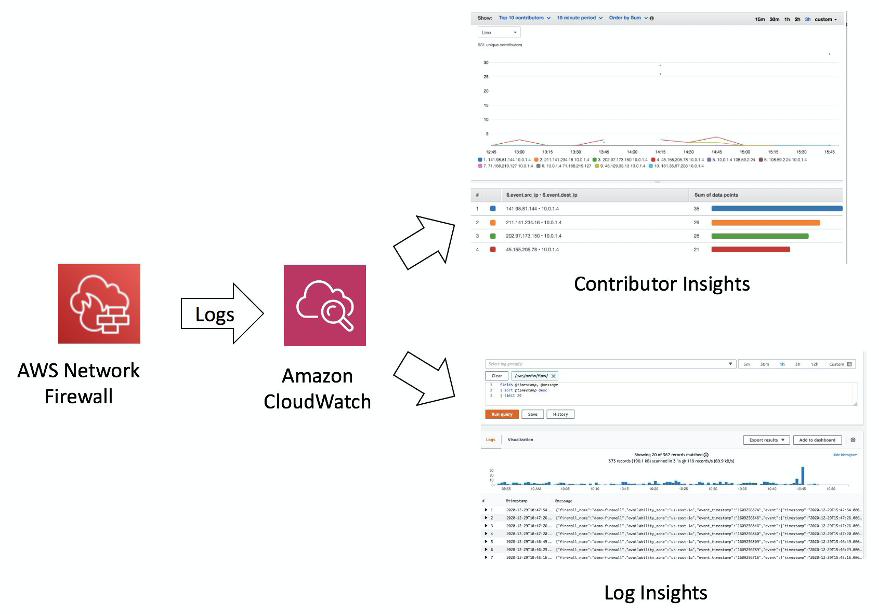
Figure 1 : AWS Network Firewall logs ingested into CloudWatch and analyzed through Contributor Insights and CloudWatch Logs Insights.
Deployment steps
The solution described in this blog post is deployed using the following three steps:
- Create groups in CloudWatch Logs.
- Configure Network Firewall to send logs to those groups.
- Configure Contributor Insights.
In this post, I show different ways to configure Contributor Insights for common scenarios with AWS Network Firewall. I also discuss how you can configure CloudWatch Logs Insights for a Contributor Insights rule.
Create a CloudWatch Logs group
In the Amazon CloudWatch console, create two log groups: flow logs and alert logs.
- In the CloudWatch console, from the left navigation pane, choose Logs and then choose Log groups.
- On the Log groups page, choose Create log group.
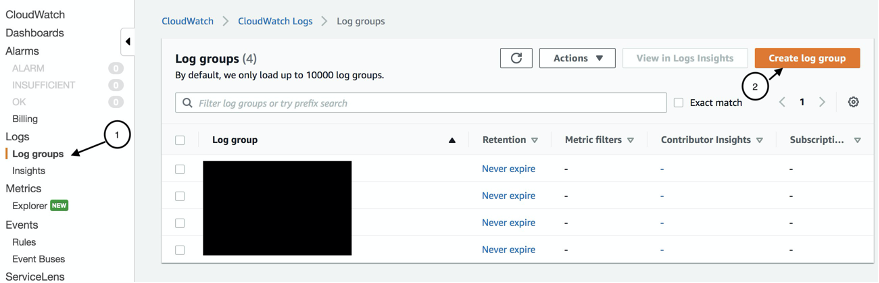
Figure 2 : Log groups page in the CloudWatch console
3. In Log group name, enter a name for the log group (for example, /aws/nwfw/flow/).
4. For Retention setting, choose Never expire, and then choose Create.
5. Repeat these steps to create alert log group (for example, /aws/nwfw/alert/).
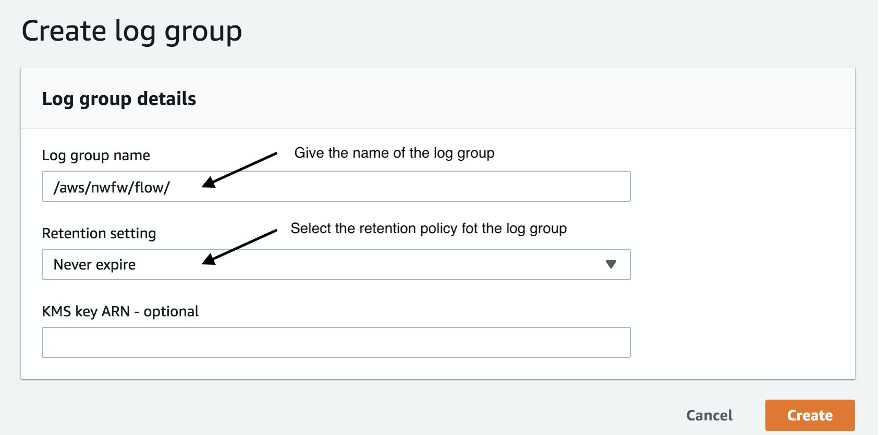
Figure 3 : Create log group page
Configure Network Firewall to send logs to the CloudWatch Logs group
- In the navigation pane of the Amazon VPC console, under Network Firewall, choose Firewalls.
- In the Firewalls page, choose the name of the firewall that you want to edit.
- On the details page, under Log type, select the Alert and Flow check boxes.
- Under Log destination for alerts, choose CloudWatch log group, and enter the name for the alert log group.
- Under Log destination for flows, choose CloudWatch log group, enter the name for the flow log group, and then choose Save.
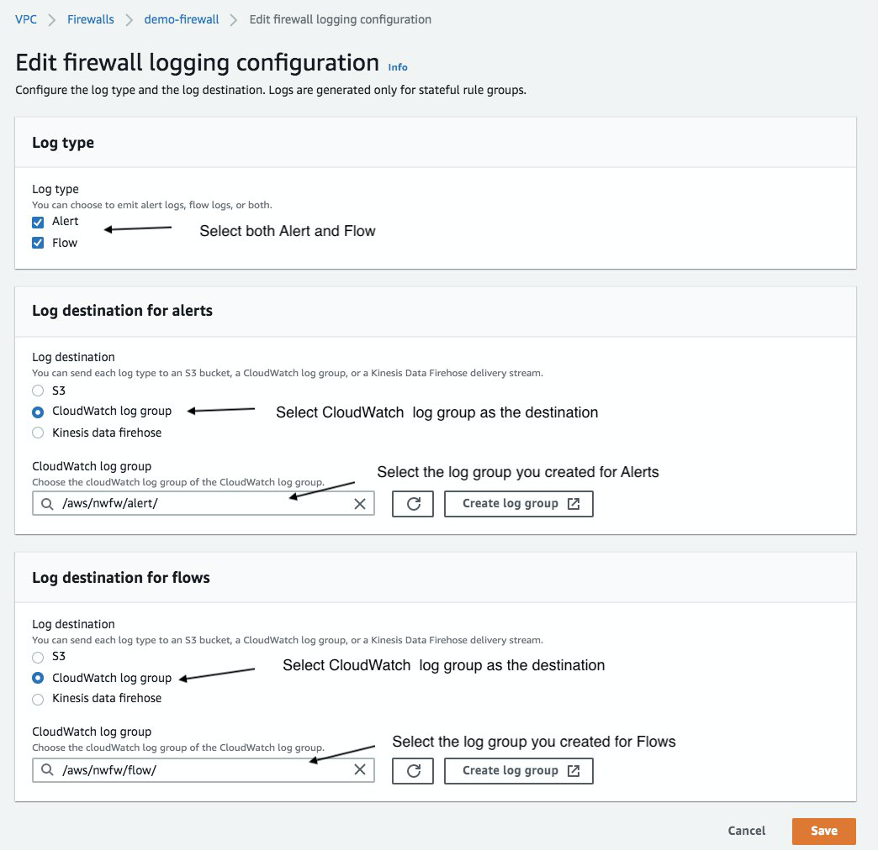
Figure 4 : Edit firewall logging configuration
Configure Contributor Insights
You can configure Contributor Insights using a built-in sample rule or a rule you create from scratch.
Scenario-1: Contributor Insights rule using built-in samples
- In the CloudWatch console, choose Contributor Insights and then choose Create rule.
- Choose Sample rule.
- Choose Network Firewall Flow logs or Network Firewall Alert logs, and then choose one of the existing rules from the dropdown.
- Enter a name and log group for the rule and then choose Create.
Scenario-2: Custom rule for the top flows between source and destination IP addresses based on bytes of data exchanged
For this scenario, you use the Network Firewall flow logs. To identify which fields to use for your Contributor Insights rule, check the sample JSON entry from the log event in the flow logs.
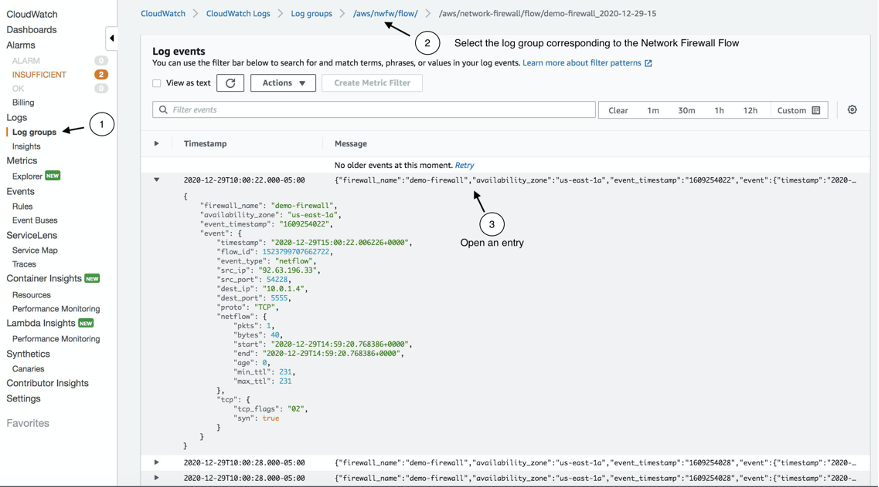
Figure 5 : JSON entry from the flow logs
- In the CloudWatch console, choose Contributor Insights and then choose Create rule.
- In the Create rule wizard, choose Custom rule.
- For Rule name, enter a name.
- Under Log group(s), select the name of the Network Firewall flow log group you created earlier (in my example, /aws/nwfw/flow/).
- For Log format, choose JSON.
- Under Contribution, enter a contributor type that you want to report on. Enter event.src_ip and event.dest_ip.
- For Aggregate on, choose SUM and then enter event.netflow.bytes.
- Select Create rule in enabled state and then choose Create.
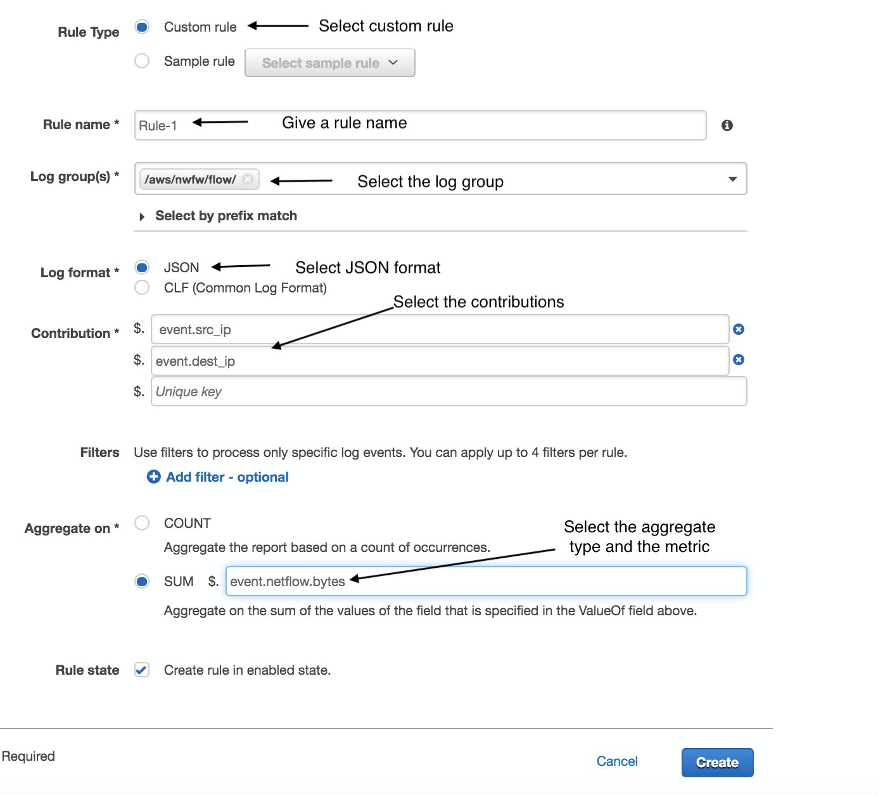
Figure 6 : Create a custom rule
You can then visualize the rule using a graph. The upper half shows the time series. The lower half shows a ranking of the top 10 contributors over the specified time period.
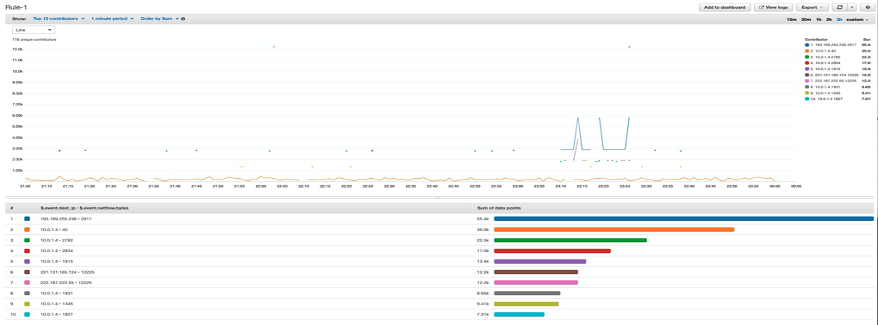
Figure 7: Top 10 contributors
Scenario-3: A custom rule for the top URLs blocked by AWS Network Firewall
For this scenario, you use the Network Firewall alert logs. To identify which fields to use for your Contributor Insights rule, check the sample JSON entry from the log event of the alert logs.
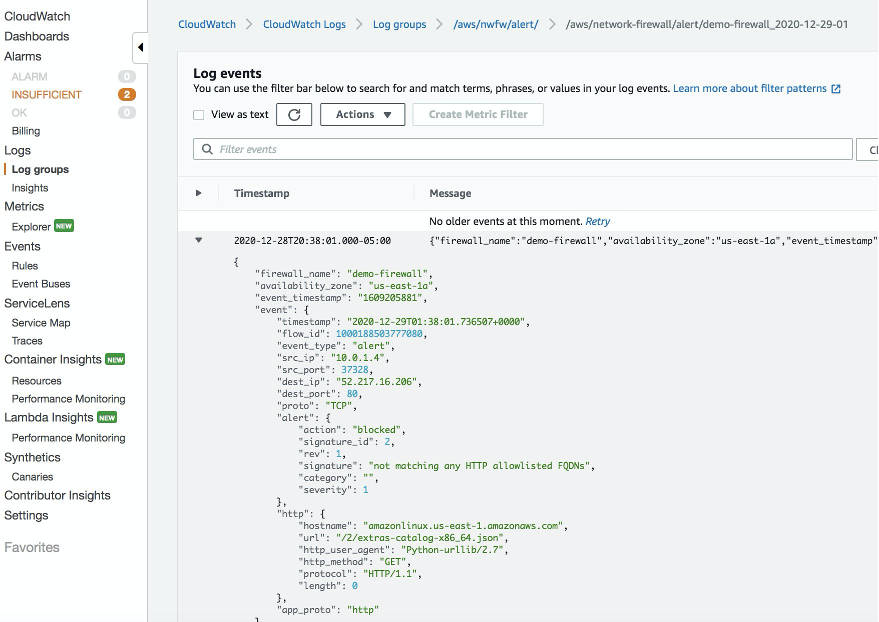
Figure 8: JSON entry from the alert logs
- In the CloudWatch console, choose Contributor Insights and then choose Create rule.
- For Rule name, enter a name.
- Under Log group(s), select the name of the Network Firewall alert log group (in my example, /aws/nwfw/alert/).
- For Log format, choose JSON.
- Under Contribution, enter a contributor type that you want to report on. Enter event.alert.action, event.alert.signature, and event.http.hostname.
- Under Filters, in Match, enter event.alert.action. From Condition, choose In and then enter blocked.
- For Aggregate on, choose Count.
- Select Create rule in enabled state and then choose Create.
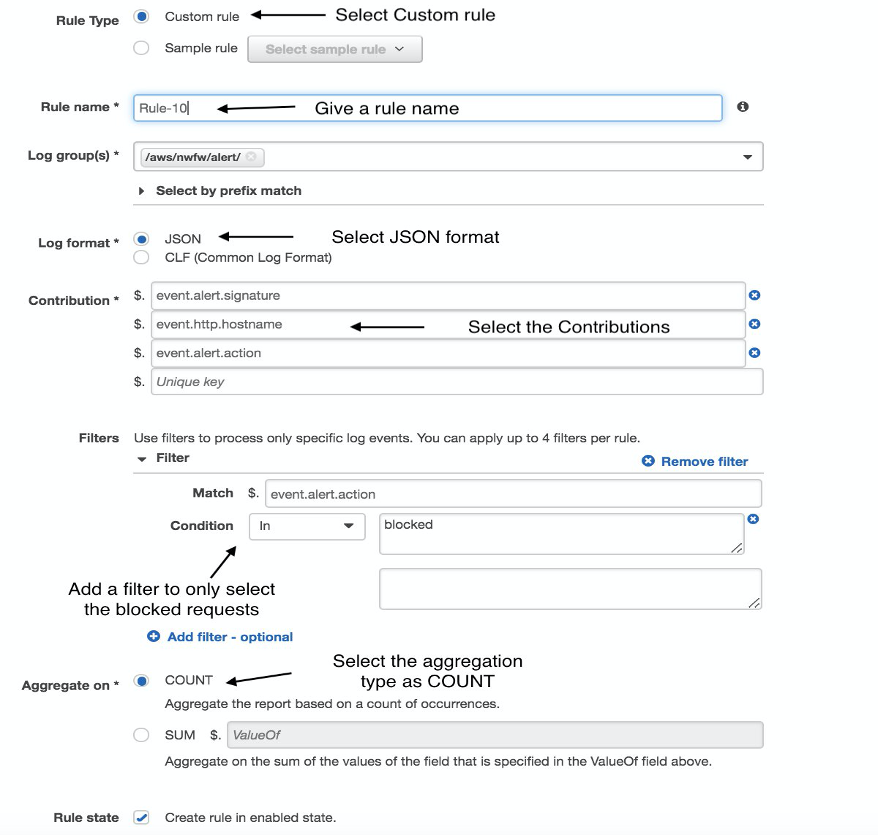
Figure 9: Create a custom rule
You can optionally interactively search and analyze your firewall logs using CloudWatch Logs Insights. For example, in scenario-3 in which you create a rule to get the top URLs blocked by AWS Network Firewall, Contributor Insights might surface URLs that warrant further investigation. Using CloudWatch Logs Insights you can query your Network Firewall logs in CloudWatch Logs and narrow your investigation to specific hostnames or URLs.
The following query is written to extract the log entries corresponding to outbound traffic to “google.com“ that is being blocked. This is blocked by a URL deny list so we narrow the search to event.alert.signature = “matching HTTP denylisted FQDNs” and event.http.hostname=”google.com”. After you run the query, you can get the details of the message and the timestamp.
Fields @timestamp, @message
| sort @timestamp desc
| filter event.alert.signature = “matching HTTP denylisted FQDNs” and event.http.hostname=”google.com”
| limit 20

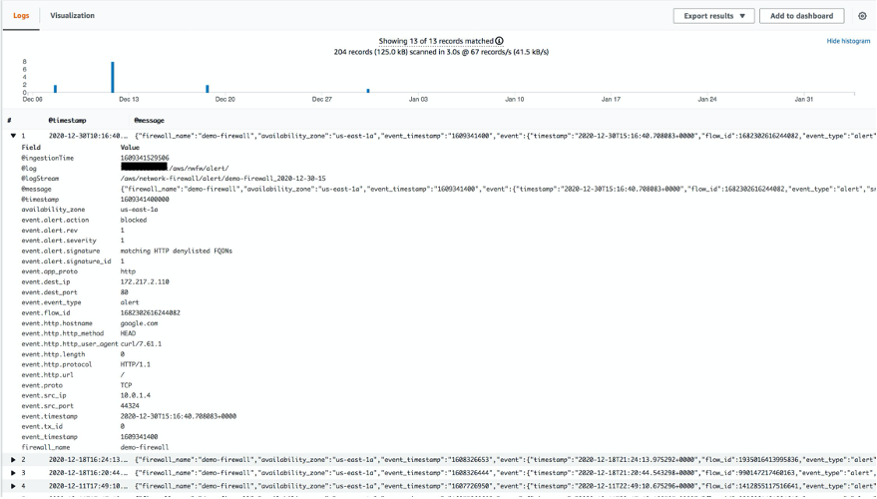
Figure 10: Fields of record that matched log insight query filtering requests to google.com
You can also get more specific details from the query such as the source IP address and the port of the instance that tried to access google.com. You can also add these rules to the CloudWatch dashboard and create CloudWatch alarms from them.
To add the Contributor Insights rule to the dashboard
- In the CloudWatch console, from the left navigation pane, choose Contributor Insights.
- Choose the rule you want to add to the dashboard, and then choose Add to dashboard.
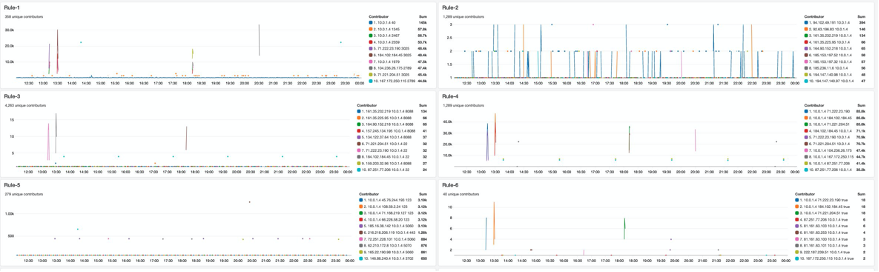
Figure 11 : Multiple Contributor Insights rules added to a CloudWatch dashboard.
To create alarms for your Contributor Insights metrics
In the scenario in which you create a rule to get the top 10 URLs blocked by AWS Network Firewall, you might want to graph how many unique URLs are being blocked over time and trigger an alert if this number exceeds a certain threshold.
- In the CloudWatch console, from the left navigation pane, choose Contributor Insights and then choose the rule.
- Choose Actions and then choose View in Metrics.
- Choose Unique Contributors. The metric will be graphed in CloudWatch metrics.
- Choose the alarm icon in the row of the metric. For example, you might want to create an alarm when there are more than 10 unique blocked URLs observed per minute.
- Choose Create.
For more information, see Graphing Metrics Generated by Rules in the Amazon CloudWatch User Guide.
Cleanup
To avoid ongoing charges, delete the resources you created. Go to the AWS Management Console, identify the resources you created (the AWS Network Firewall, Contributor Insights rules, CloudWatch Logs Insights rules, and alarms) and delete them.
Conclusion
In this post, I showed how you can use Contributor Insights to analyze flow and alert logs from AWS Network Firewall. I showed you how to create custom rules to analyze the logs in real time. I hope this post is helpful and I look forward to hearing about how you use this feature.
You can read more about Contributor Insights in the documentation.
About the Author

Shiva Vaidyanathan
Shiva Vaidyanathan is a Senior Cloud Infrastructure Architect at AWS. He provides technical guidance, design and lead implementation projects to customers ensuring their success on AWS. Prior to joining AWS, he has worked on several research projects on how to perform secure computing in public cloud infrastructures. He holds a MS in Computer Science from Rutgers University and a MS in Electrical Engineering from New York University.

Damindra Bandara
Damindra Bandara is a Senior Security Consultant in AWS Professional Services specializing in Network and Edge Security. She helps enterprise customers to migrate their highly sensitive workloads to AWS cloud securely. She holds an MSc. in Information Security and a Ph.D. in Information Technology from George Mason University, Fairfax, VA.