AWS Open Source Blog
AWS Distro for OpenTelemetry is now generally available for metrics
At the end of 2021 we made traces in OpenTelemetry generally available (GA) and then the focus in the Cloud Native Computing Foundation (CNCF) OpenTelemetry project moved to metrics. We worked upstream in the community to implement metrics in SDKs and ensure compatibility with Prometheus as well as to stabilize the collector to support metrics. Now, we‘re excited to share that in the OpenTelemetry upstream we have declared metrics ready for use this week and with it we make metrics GA in our AWS Distro for OpenTelemetry (ADOT) as well, including production-ready metrics support, that is, eligible for Enterprise Support.
Ready for use for metrics in OpenTelemetry means that the specification, the APIs and SDKs, as well as other components that author, capture, process, and otherwise interact with metrics now have the full set of OpenTelemetry metrics functionality and will not introduce any breaking changes.
Some highlights of the ADOT release we just shipped include:
- The ADOT collector is now production-ready for metrics, check out the v0.18 release notes for details.
- Integration with AWS services: in addition to sending traces to AWS X-Ray, you can now send metrics to Amazon Managed Service for Prometheus.
- We support metrics for the Java, .NET, and Python SDKs in ADOT.
Let’s now have a look at how we got here and how you can benefit from OpenTelemetry and ADOT for your workloads in AWS.
Instrumentation
The OpenTelemetry Metrics specification design emphasis was on supporting existing metrics instrumentation protocols and standards such as the Prometheus exposition format. This enables you to use the ADOT collector as a drop-in replacement for an in-cluster Prometheus to scrape targets as well as ingest metrics into Amazon Managed Service for Prometheus, using the Prometheus Remote Write Exporter.
When it comes to the task of instrumenting your own code, you have two options, in principle:
- Use the native OpenTelemetry SDKs (Java, .NET, and Python).
- Use one of the Prometheus client libraries.
We worked upstream in the context of the OpenTelemetry Prometheus Working Group to make sure OpenTelemetry is Prometheus compatible. This means that if you already have code that is instrumented with one of the Prometheus libraries, you can use the Prometheus Receiver in an ADOT collector pipeline to process metrics, without code changes. The same applies to Prometheus exporters you may have deployed.
Walkthrough
Now that we’re on the same page concerning instrumentation, let’s have a look at an example of the ADOT collector in action, scraping Prometheus metrics from a sample Go program we instrument using the respective Prometheus library and self-scraping the ADOT collector.
To demonstrate the Prometheus compatibility, assume you have a Go application that you instrumented with the Prometheus client library to expose certain metrics. Focusing on the relevant parts in the Go code:
    // invokeCounter is a Prometheus counter incremented when this
    // ho11y instance is invoked
    invokeCounter = promauto.NewCounterVec(
        prometheus.CounterOpts{
            Name: "ho11y_total",
            Help: "Total ho11y invokes.",
        },
        []string{"http_status_code"},
    )
    ...
    // increment counter metric for invocation:
    invokeCounter.WithLabelValues(strconv.Itoa(http.StatusOK)).Inc()
You can then set up the ADOT collector as a drop-in replacement for an in-cluster Prometheus to ingest the metrics into Amazon Managed Service for Prometheus and visualize them in Amazon Managed Grafana.
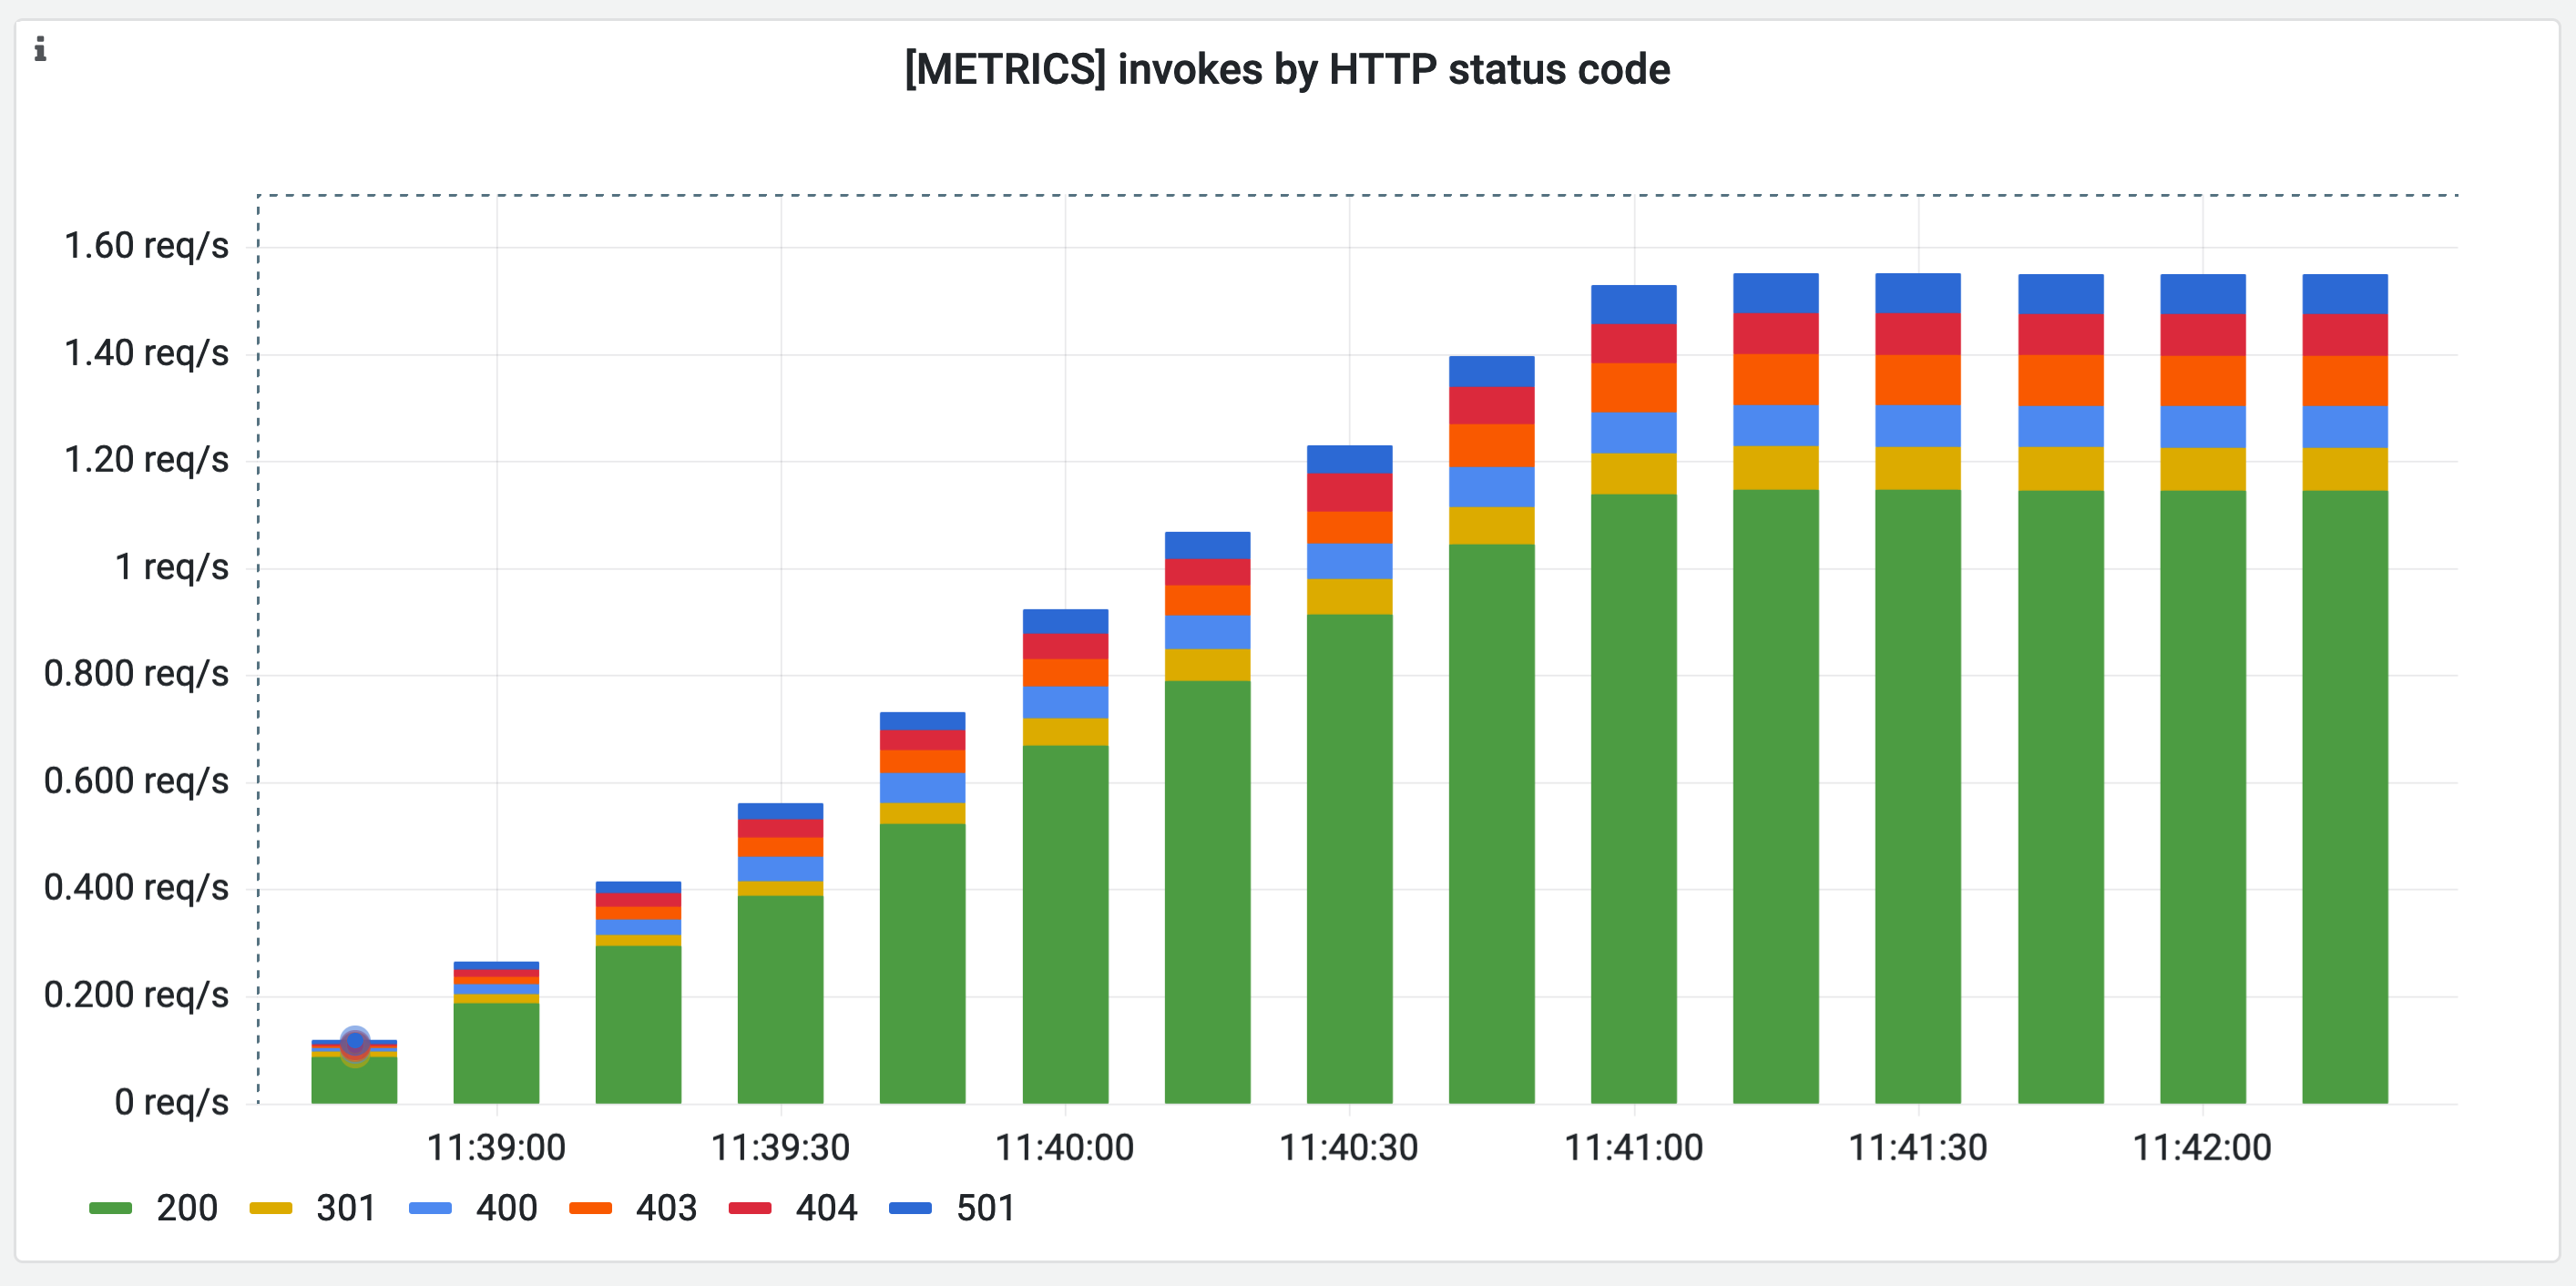
Using the following PromQL query:
sum by(http_status_code) (rate(ho11y_total[5m]))
The resulting panel in Grafana, with a time series visualization looks as follows:
In addition to your application metrics, you can get insights into the ADOT collector. Our collector exposes its metrics on port 8888 in Prometheus exposition format by default. By adding the collector to the scrape config with an additional job (note that the regex needs to be adapted to the label you’re using):
          - job_name: adot
            kubernetes_sd_configs:
            - role: pod
            relabel_configs:
            - action: replace
              regex: ([^:]+)(?::\d+)?
              replacement: $${1}:8888
              source_labels: [__address__]
              target_label: __address__
            - action: replace
              source_labels: [__meta_kubernetes_namespace]
              target_label: k8s_namespace
            - action: replace
              source_labels: [__meta_kubernetes_pod_name]
              target_label: k8s_pod
            - action: keep
              source_labels: [__meta_kubernetes_pod_label_app]
              regex: aws-adot
If you use the above scrape config for the Prometheus receiver and in addition enable fine-grained telemetry output in the ADOT collector like so:
   service:
      telemetry:
        logs:
          level: debug
        metrics:
          level: detailed
Then you can gather the ADOT health and performance collector metrics and visualize them in Amazon Managed Grafana, for example, with a dashboard we put together for you to use as a starting point:

With the short hands-on exploration of the ADOT collector for metrics handling done, let’s move on to what’s up next.
Next steps
If you’re currently using Prometheus (in server or agent mode) to scrape metrics in-cluster, consider migrating to the ADOT collector. This allows you to collect both traces and metrics with one agent and ingest them into various backends, readily configurable to change destinations by applying a configuration change to the ADOT collector. The same applies to instrumentations in code bases written in Java, .NET, or Python as well as in any place where you use Metrics over OTLP.
As for upstream activities in OpenTelemetry, logging is the next focus area. In this context, consider joining us in the Log Special Interest Group (SIG) meetings on Wednesdays. Beyond logging, major new projects include formalizing and implementing client instrumentation and investigations into eBPF as well as extending OpenTelemetry to support additional signal types beyond logs, metrics, and traces, such as profiles.