AWS Open Source Blog
Testing the OpenTelemetry C++ Prometheus Exporter
In this post AWS intern Eric Hsueh shares his experience working on OpenTelemetry. OpenTelemetry aims to be the industry standard in collecting telemetry data, which includes metrics, tracing, and logs.
Together with fellow AWS intern Cunjun Wang, we developed a C++ Prometheus Exporter as a contribution to the C++ repository of the open source project OpenTelemetry. You can learn more about our work on the exporter in the blog post “AWS adds a C++ Prometheus Exporter to OpenTelemetry.” Early on, we realized testing our exporter would be crucial to our ability to deliver a high-quality product to users. We had to certify that each individual component of our exporter worked, and that it worked in tandem with the C+ Metrics SDK. To achieve this goal, we learned as much as possible about testing.
Details
Overview
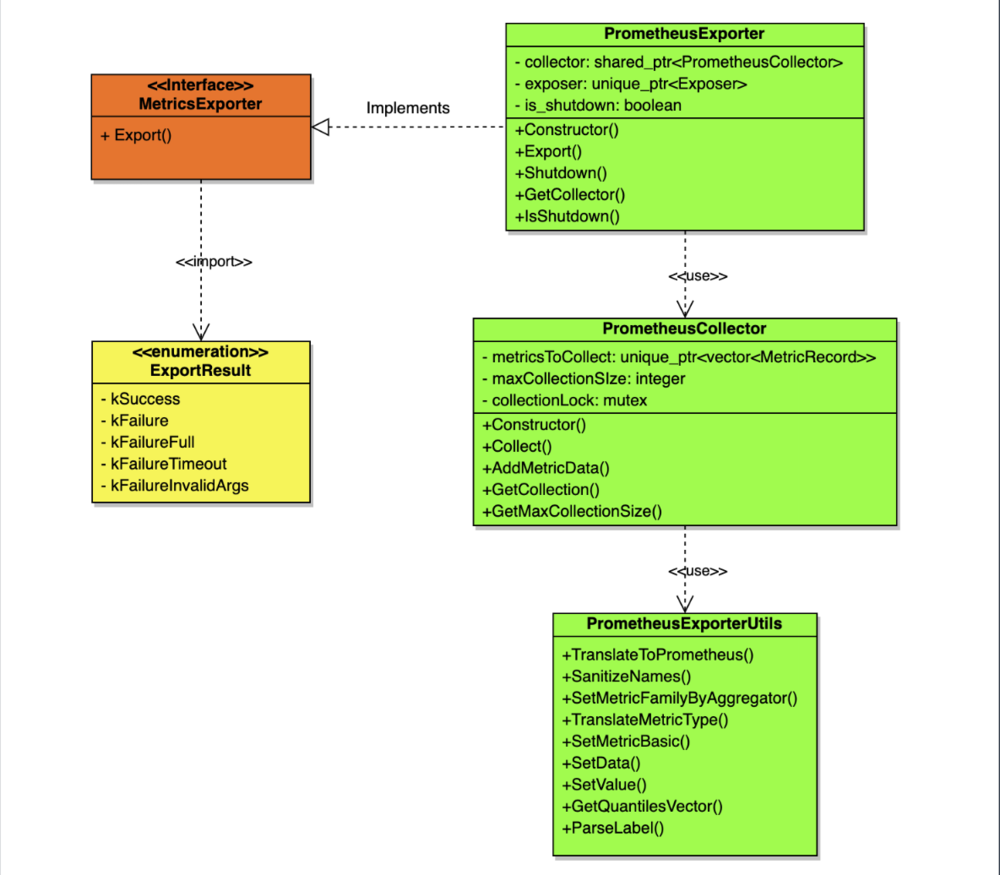
The Prometheus Exporter consists of three major components (highlighted in green in the preceding diagram). Our PrometheusExporter class implements the MetricsExporter interface, and provides an Export() function to export metric data. It also provides a Shutdown() function to maintain a shutdown status. The PrometheusCollector class contains an intermediate collection, metricsToCollect, that stores exported data. It then waits for a Prometheus instance to scrape data by calling the provided Collect() function. PrometheusExporterUtils contains helper functions that translate OpenTelemetry metrics data to Prometheus data.
Unit testing
Software unit testing validates that each unit of the software works as designed. Unit definition is up to the developer, and for our Prometheus Exporter, defining units in terms of functions was best. Simpler functions may only have one unit of functionality to test, but functions that are more complex may have multiple tests. For example, testing the Shutdown() function for our PrometheusExporter class only required one unit test. Testing our AddMetricsData function for our PrometheusCollector class, however, required multiple tests due to the variety of data it must handle.
We followed a test-driven development (TDD) methodology to build our software. A TDD approach to development means that you write your tests (often unit tests) first and then write enough code to pass that test. Pairing TDD with unit testing is an efficient yet methodical approach that produces quality code.
Before we began the coding phase of our exporter, we decided to do a demo on the Google Test framework. Specifically, we wanted to demo its use in the context of the OpenTelemetry C++ repository. The following day, we gave a successful internal demo and received positive feedback on it. Eventually, we filed an issue to the repository asking to add a demo for the benefit of new developers on the project. A pull request to add the demo itself is in the works as well.
For our Prometheus Exporter, we aimed to have 100% test coverage in our tests. This was important to conform to open source practices and ensure high quality of our code. We also wanted to be able to cover all use cases and error possibilities.
The first step in testing our exporter was to make sure each individual component worked. We thoroughly unit tested our exporter using the Google Test framework and followed a TDD methodology to achieve this. Each of our three main classes in the Prometheus Exporter consists of many member functions that each require thorough testing. I took responsibility for testing the PrometheusExporter class along with the AddMetricData() function in the PrometheusCollector. After we concluded all our testing, our test code ended up being well more than half of the total code we wrote.
Integration testing
Performing integration testing of software involves testing individual units together as a group to expose any faults that come with combined unit interactions. Like unit testing, the way you group units is up to the developer. For our Prometheus Exporter, we treated our exporter as a whole, that is, as a combination of our three classes.
For our exporter, we needed to validate two things through our integration testing. The first validation was certifying that our exporter worked in tandem with the C++ Metrics SDK. The second validation was certifying that all forms of data passed through our exporter correctly translated to Prometheus. Initially, we thought one pipeline would be enough for both validations, but we quickly realized that we needed to create two separate pipelines, one for each item.
In OpenTelemetry, six different kinds of aggregators are used for six different metrics instruments. These aggregators are part of a Record created for exporting to Prometheus. Referring to the specification, we found that the six metrics instruments each use a default aggregation. However, the default aggregation mapping is not one-to-one for instruments. This means that although the code for the four aggregators exists, it leaves them unused in the C++ Metrics SDK. To resolve this problem, we dedicated our first pipeline to testing the use of our exporter in tandem with the C++ Metrics SDK. This let us test two of the six aggregators as well. Our second pipeline started at our Prometheus Exporter and tested the validity of the four remaining types of aggregators. We achieved this by manually creating and exporting records instead of the C++ Metrics SDK.
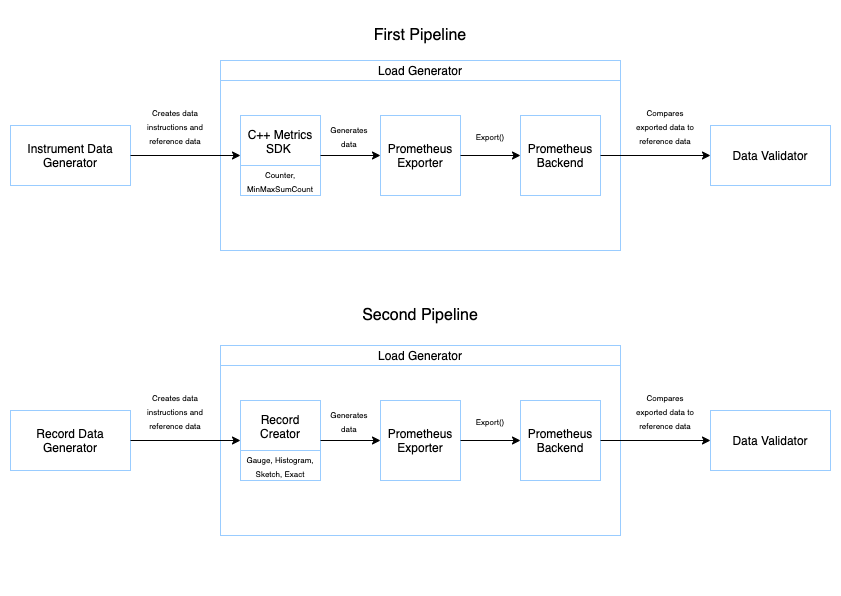
To create our pipelines, we split each into three parts: the data generator, the load generator, and the data validator.
The data generator consists of a Jupyter notebook that outputs two .csv files. The first .csv file contains instructions from which our load generator reads and generates data. The file for the first pipeline consists of lines of metrics instruments to create. The file for the second pipeline creates data to generate a record on each line. The second .csv file that the notebook generates is a reference data file that the data validator for each pipeline uses.
The load generator is the second part. It consists of the necessary components to:
- Read a data file.
- Create data, either with instruments through the SDK, or by manually creating records.
- Pass it to the Prometheus Exporter.
- Export it to the Prometheus backend.
The final part of the pipeline is the data validator. This Python script queries data from the Prometheus backend and compares it to the reference data created by the data generator. Once data validation completes, testing is finished and the results verify that our Prometheus Exporter works.
Lessons learned
Throughout the testing process, we learned about the development process of building out and testing a component for open source projects like OpenTelemetry. Alhough we unit tested before, and had previous experience with Google Test, picking it up and using it within a large-scale project was entirely different. We had to come up with test strategies and discuss and review them before doing any actual testing. In doing so, we were able to make it easier on ourselves when it came time to write code. Learning about Google Test’s usage within the repository exposed us to tools like Bazel and CMake, which helped us write tests and code. The fact that our project was open source was valuable as well, teaching us a lot about the importance of transparent discussion, documentation, and communication. It was a great experience to be able to work on the Prometheus Exporter and a great experience to intern at AWS.
Future enhancements
Although we were able to unit test fully and complete integration testing, we were not able do any performance testing. Performance testing involves monitoring speed, resource usage, and other attributes of a system or program. As a future enhancement, we would include this type of testing for our Prometheus Exporter. We would use the Google Benchmark framework already found within the OpenTelemetry C++ repository. It has a similar structure to the Google Test framework, and converting unit tests to benchmarked routines can be done without a lot of hassle. Performance testing can measure the performance of exporting, collecting, and data translation. Additionally, creating benchmarks for each component will help us determine which pipeline areas to optimize further.
References
- Learn more about the OpenTelemetry project on the website.
- Learn more about Prometheus on the website.
- Learn more about the OpenTelemetry observability with the metrics functionality in the GitHub.
- Our Prometheus Exporter design documents are in our document repository.
- Learn how to get involved in the OpenTelemetry community

ERIC HSUEH
Eric Hsueh is a senior pursuing a Bachelor’s degree in Computer Science at the University of California, Irvine. He is currently interning as a software engineer at Amazon Web Services, and is interested in machine learning and observability.
The content and opinions in this post are those of the third-party author and AWS is not responsible for the content or accuracy of this post.