Containers
Amazon Elastic Container Service (ECS) Auto Scaling using custom metrics
Introduction
Amazon ECS eliminates the need to install, operate, and scale your own cluster management infrastructure.
Customers are using horizontal scalability to deploy and scale their microservices applications running on Amazon ECS. They use the Application Auto Scaling service to automatically scale based on metrics data. Amazon ECS typically measures service utilization based on average CPU and memory utilization and publishes them as predefined CloudWatch metrics, namely, ECSServiceAverageCPUUtilization and ECSServiceAverageMemoryUtilization. Application Auto Scaling uses these predefined metrics in conjunction with scaling policies to proportionally scale the number of tasks in a service. However, there are several use cases, such as having a flow of requests, and you have workers downstream pulling these requests for processing. In such a use case, you may want to scale the workers to stay abreast with the changing rate of receiving new requests. Customers may want to pick relevant scaling metrics to their use cases to trigger when and to what degree a scaling action should be executed.
There are many custom metrics you can track and measure, such as the average response time, new requests rate, SQS queue buffer depth, or any other custom metric that tracks some aspect of the application. These custom metrics could be, in some scenarios, better suited to trigger scaling actions than the predefined metrics.
In this post, we demonstrate how to scale an Amazon ECS service in response to changing load in an Amazon Simple Queue Service (Amazon SQS) queue, a fully managed message queuing service that enables you to decouple and scale microservices, distributed systems, and serverless applications.
Example scenario
In this scenario, we assumed an asynchronous web application running on a fleet of Amazon ECS tasks that belong to an Amazon ECS service for high availability and auto scaling. This application lets users upload their vouchers to check the remaining balance and validity before using them online. Each voucher check process typically needs to communicate back with a database to fetch the relevant results before they can be returned to the user. Amazon ECS service is configured to handle typical upload rates. The service will automatically replace unhealthy tasks in order to maintain the desired number of tasks. The application keeps the voucher metadata in an SQS queue to be processed. It processes the voucher and then returns the validity status and balance where they can be viewed by the user.
This architecture works well if the number of vouchers’ uploads doesn’t vary over time. However, if the number of uploads changes over time, you might consider using a more dynamic scaling mechanism to scale the capacity of the Amazon ECS service to maintain an acceptable amount of latency for messages waiting in the Amazon SQS queue. This maximum acceptable latency could be derived from your application’s desired service-level agreement (SLA) to maintain a reliable user experience. If you use a target tracking scaling policy based on a custom Amazon SQS queue depth metric, dynamic scaling can adjust the capacity of the Amazon ECS service in response to load changes more effectively.
The issue with using a CloudWatch metric like ApproximateNumberOfMessagesVisible in Amazon SQS queue, is that the number of messages in the queue might not change proportionally to the capacity of the ECS service. That’s because the number of messages in the SQS queue does not solely define the number of ECS tasks needed. In general, the number of tasks in an ECS service can be driven by multiple factors such as how long it takes to process a message and the acceptable amount of latency (that is, queue delay).
The solution
The solution is to use a backlog per task custom metric, with the target value being the acceptable backlog per task to maintain. You can calculate these numbers as follows:
- Backlog per task – To calculate your backlog per task, start with the ApproximateNumberOfMessages queue attribute to determine the length of the SQS queue (that is, the number of messages available for retrieval from the queue). Then divide that number by the fleet’s running capacity, which for an ECS service is the number of tasks in the “Running” state, to get the backlog per task.
- Acceptable backlog per task – To calculate your target value, first determine what your application should accept in terms of latency. Then take the acceptable latency value and divide it by the average time that an ECS task takes to process a message.
To illustrate with an example, let’s say that the current ApproximateNumberOfMessages is 1,500, and the fleet’s running capacity is 10 ECS tasks. If the average processing time is 0.1 seconds for each message and the longest acceptable latency is 10 seconds, then the acceptable backlog per task is 10 / 0.1, which equals 100 (messages/task). This means that 100 is the target value for your target tracking policy. If the backlog per task is currently at 150 (1500/10), your fleet scales out, and it scales out by five tasks to maintain proportion to the target value.
Deployment steps
The following steps demonstrate how to publish the custom metric, create the target tracking scaling policy, and configure your ECS service to scale based on these calculations.
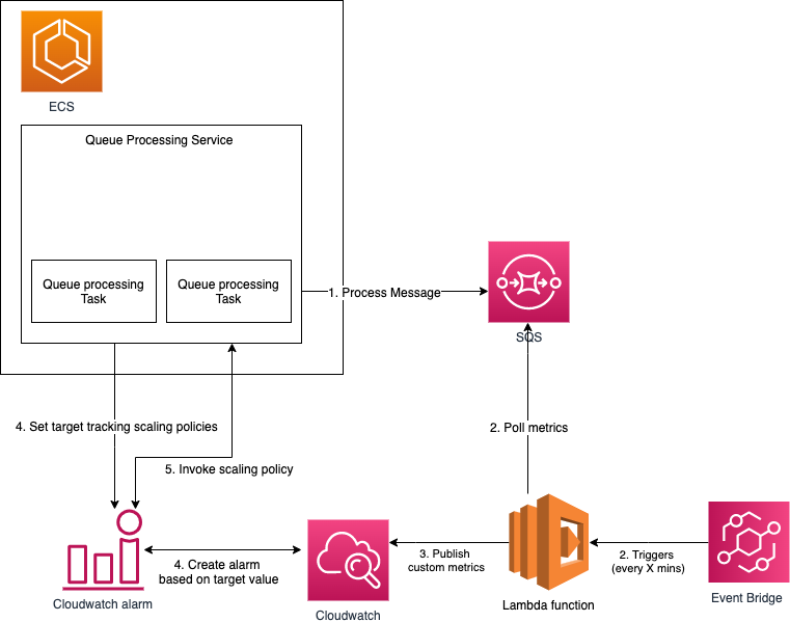
There are five main parts to this configuration:
- An ECS service to manage tasks that are processing messages from the SQS queue.
- An Amazon EventBridge scheduled event that is generated on a periodic basis (for example, every five minutes) to trigger an AWS Lambda function to poll the current ApproximateNumberOfMessages in the SQS queue and calculate the backlog per task scaling metric by dividing that number by the current fleet’s running capacity of ECS tasks.
- A custom metric is created on Amazon CloudWatch that monitors the number of messages in the queue per task (that is, backlog per task), which is calculated by AWS Lambda.
- A target tracking policy that configures your ECS service to scale based on the custom metric and a set target value that meets the acceptable amount of latency (queue delay). Target tracking scaling policies increase or decrease the number of tasks that your service runs based on the target value of the custom metric (that is, backlog per task); this is pretty similar to the way that your thermostat maintains the temperature of your home. You select your preferred temperature, and the thermostat does the rest.
- CloudWatch alarms invoke the scaling policy based on the measured values of the backlog per task.
The following diagram illustrates the architecture of this configuration.
Pseudo code on how to calculate backlog per task:
Conclusion
Many customers want to build asynchronous applications on Amazon ECS for high availability and auto scaling, where ECS tasks act as workers to consume messages from the SQS queue that buffers the incoming requests. By using Amazon EventBridge and AWS Lambda, you can calculate the backlog per task on regular intervals and update a custom metric in Amazon CloudWatch, which can be used to scale the ECS service based on alarms triggered from Amazon CloudWatch. This will let you efficiently scale your ECS services to provision the right capacity at the right time to satisfy your application’s SLA. This architecture will help you to automatically keep the right balance between performance and cost optimization. We hope you found this post helpful and look forward to your comments and feedback on how this pattern can fit in your current and future projects.