AWS Marketplace
Log analysis with AWS Control Tower and Logz.io
As businesses grow, the recommended approach in AWS is to move from one account to a multi-account environment. Using an AWS account as the isolation boundary, the multi-account approach enables customers to have the flexibility to isolate resources. You might select this option to separate applications that have different security requirements or manage service limits.
AWS Control Tower enables you to quickly build an AWS environment while still meeting the security and compliance requirements of your organization. You can stay compliant by providing a baseline security posture that applies preventive and detective guardrails.
When you launch AWS Control Tower in your master account, it sets up a Landing Zone. A Landing Zone is a well-architected, multi-account AWS environment that is based on security and compliance best practices. AWS Control Tower automates the setup of a new Landing Zone using best practices blueprints for identity, federated access, and account structure. The Landing Zone includes a core organizational unit (OU) with an audit account and a log archive account. The audit account gives your security and compliance team read access to review accounts. AWS Control Tower sets up centralized logging for AWS CloudTrail and AWS Config logs from all accounts in the log archive account. The log archive account serves as the single source of truth for your logging needs.
One set of CloudTrail events that AWS Control Tower publishes are lifecycle events. These events describe specific account management events inside AWS Control Tower. At the time of this writing, there are eight lifecycle events:
EnableGuardrailDisableGuardrailRegisterOrganizationalUnitDeregisterOrganizationalUnitCreateManagedAccountUpdateManagedAccountSetupLandingZoneUpdateLandingZone
Once you have established your multi-account environment, you implement tools and solutions that help you secure and monitor resources within your AWS accounts. This helps you get the right insights on the activity taking place in your accounts.
Customers may use additional solutions to monitor your environments through log analysis. Logz.io is a fully managed, cloud-native observability platform providing unified monitoring, troubleshooting, and security for distributed cloud environments. It lets engineers resolve production issues faster by offering popular open-source monitoring tools together as a single tool. It is an observability platform purpose-built for monitoring logs, metrics, and traces together. Log management and cloud Security Information and Event Management (SIEM) are based on Elasticsearch, Logstash, and Kibana (ELK). Its infrastructure monitoring is based on Grafana, and the distributed tracing is based on Jaeger.
Logz.io is a SaaS solution built on the open-source tools ELK and Grafana. You can stream data from your AWS account into the Logz.io platform to achieve observability on top of AWS Control Tower. This enables you to track your AWS Control Tower events, troubleshoot issues in your environment, and monitor the functionality and performance of your AWS Control Tower environment. You can also maintain a high level of security.
In this post, Sandeep, Justin, and I show you how to use Logz.io from AWS Marketplace to set up monitoring in an AWS environment built with AWS Control Tower. We show you how to set up an integration between AWS Control Tower and Logz.io. We also show how to build a dashboard and alerts to visualize key metrics that provide insights into your AWS environment.
Solution overview
Setting up your AWS Control Tower environment to connect to Logz.io involves four main steps:
- Log into your AWS Control Tower log archive account through AWS Single Sign-On (AWS SSO).
- Create an Identity and Access Management (IAM) role to allow Logz.io to read your AWS CloudTrail logs in Amazon Simple Storage Service (Amazon S3).
- Capture the S3 bucket information holding your CloudTrail logs.
- Configure Logz.io to receive CloudTrail events from your AWS Control Tower environment.
Refer to the following architecture diagram.
Once you have your CloudTrail events coming in to Logz.io, you are able to create visualizations, dashboards, and alerts from these events.
Prerequisites
For this tutorial, you should have the following prerequisites:
- An AWS account with an AWS Control Tower environment
- A Logz.io account. If you do not have an account, you can subscribe to Logz.io in AWS Marketplace
Step 1: Ship AWS Control Tower CloudTrail logs to Logz.io
To visualize metrics, you must first connect the CloudTrail logs located in the log archive account’s S3 bucket to Logz.io. In your AWS account, you must create an IAM role to allow Logz.io to capture your CloudTrail logs from the S3 bucket. You also identify the S3 bucket and prefix for the logs you want to capture. The IAM role and S3 bucket information are configured in Logz.io. To do this:
IAM configuration
-
- Log in to yourLogz.io account. Once you are in your account, in the top navigation bar, choose Send Your Data. Under Platforms, choose AWS. In the drop-down, choose CloudTrail.
- On the Ship CloudTrail logs page, scroll down to the bottom and choose + Add a bucket and then Authenticate with a role. Logz.io provides you an account ID and external ID that you use to create the IAM role in the AWS account. Write down the Account ID and the External ID.
- In the AWS Management Console, log in to the log archive account created by AWS Control Tower and navigate to the IAM landing page. On the left navigation pane, choose Role and then Create role.
- For Select type of trusted entity, choose Another AWS account.
- Enter the 12-digit account ID from step 2. Select Require external ID. Enter the External ID you wrote down in step 2. Choose Next: Permissions.
- Select the checkbox next to AmazonS3ReadOnlyAccess to attach it. Choose Next: Tags. On the Add tags page choose Next: Review.
- On the Review page, enter a role name like ControlTower-Logzio-Role and then choose Create role. Once the role has been created, select the role to retrieve the role Amazon Resource Number (ARN). Write down the ARN.
Logz.io configuration
To complete the configuration to send your CloudTrail logs to Logz.io, you need the S3 bucket name, prefix, and IAM role ARN.
-
- Navigate to the Amazon S3 console. To find the S3 bucket name, in the search bar, search for the bucket name that has the format aws-controltower-logs-<logarchive-account-ID>-<region>. This is the S3 bucket name.
- To identify the Amazon S3 prefix, choose the S3 bucket, and then choose the folder that begins with o-. Select the AWS Logs folder. You see a list of folders with AWS account IDs. Select the AWS account folder from which you want to send data to Logz.io. Once you are in the desired AWS account folder, select the CloudTrail folder. Your Amazon S3 prefix is the path shown at the top of the screen starting from o-. It will look similar to: o-bc1defgh2j/AWSLogs/<account-ID>/CloudTrail.
- Navigate back to your Logz.io account to continue your configuration from step 1.2. On the Ship CloudTrail logs page, in the IAM configuration box, enter your S3 bucket name in the S3 bucket name box. Enter your S3 prefix into the Prefix box. Enter your IAM role ARN into the ARN field. Choose Save.
Within a few minutes, the CloudTrail logs from the account ID you specified appears in Logz.io.
Step 2: Create visualizations in Logz.io
Once log events are generated within Logz.io, Logz.io manages the parsing of these event logs. Some parameters that are helpful to know are:
eventName: identifies lifecycle eventsorganizationalUnitId: gives you the organizational unit IDorganizationalUnitName: gives you the organizational unit namedisableGuardrailStatus.guardrails.guardrailBehavior: lets you know if the guardrail is preventive or detectivecreateManagedAccountStatus.account.accountId: gives you the account ID that has been created
To begin building visualizations based on incoming data from AWS Control Tower events:
- In the Logz.io console, to navigate to the Visualization page, choose the visualization icon on the left pane. Choose + Create visualization and select Vertical Bar.
- Under Choose a source, enter and select logzioCustomerIndex*.
- To evaluate all events generated from AWS Control Tower, click + Add filter. In the Edit filter page, in the Field drop-down, select eventSource. In the Operator drop-down, select is. In the Value drop-down type, select controltower.amazonaws.com. Choose Save.
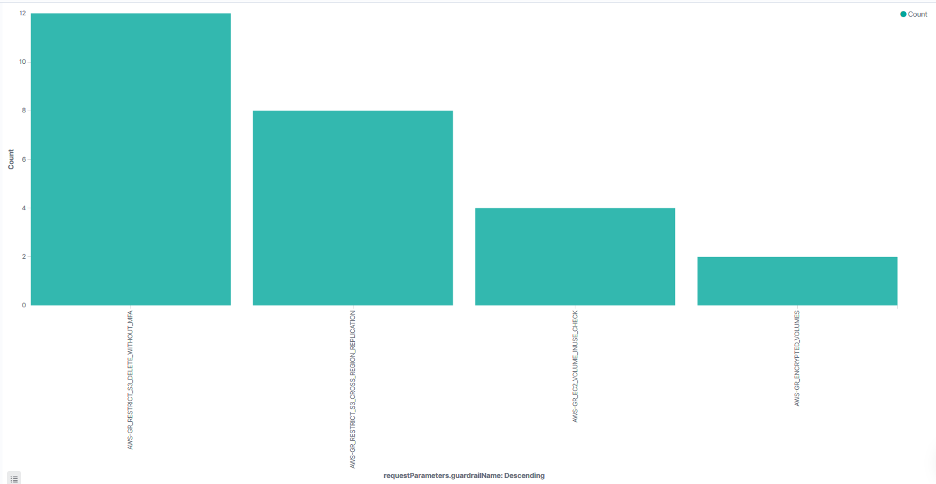
- To add additional filters to focus on certain lifecycle events, choose + Add filter. In the Edit filter page, in the Field drop-down, select eventName. In the Operator drop-down, select is one of. In the Value drop-down, enter EnableGuardrail followed by DisableGuardrail. Choose Save.
- Under Buckets, select X-axis. In the Aggregation drop-down menu, enter and select Terms. In the Field drop-down, select requestParameters.guardrailName. Choose the blue Play button. This shows a visualization of all guardrails that have been enabled or disabled and a count of each. Refer to the following screenshot to see the four guardrails you just enabled.
- Once you have the parameters you are looking for in place, choose Save on the top left. Add a title for your visualization and choose Confirm Save.
Step 3: Create a dashboard in Logz.io
As you create various visualizations that suit your needs, you can compile these visualizations together into a dashboard.
- To navigate to dashboards, choose the dashboard icon. Choose + Create new dashboard.
- At the top left, choose Add. In the search bar, enter the name of your saved visualization. Choose this visualization in the populated results. To add another visualization panel, enter the name of another saved visualization, and choose the visualization to add it to your dashboard. When you are done adding panels, choose the x in the top right.
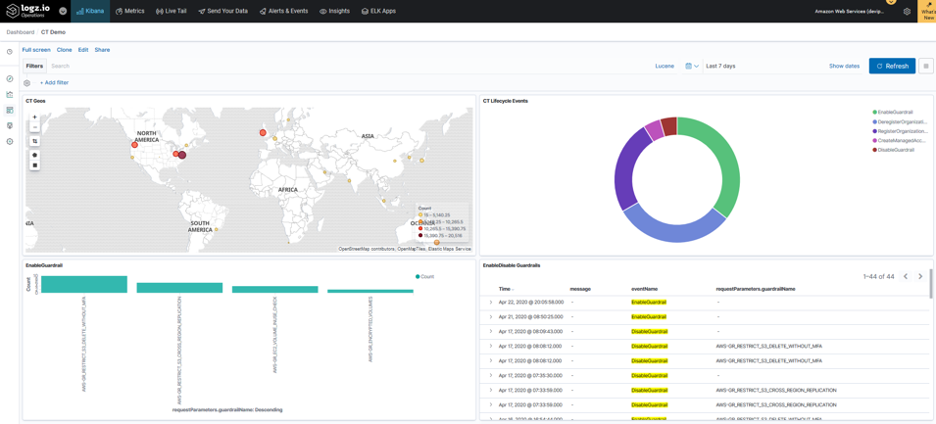
The following screenshot shows a dashboard that includes four different visualizations: a coordinate map showing counts of AWS Control Tower IP events, a pie chart of the different AWS Control Tower lifecycle events, a bar chart of specific guardrails that have been enabled, and finally a table of when and which guardrails have been enabled or disabled.
- After adding all the visualizations you would like to see in this dashboard, choose Save, enter a title for your dashboard, and then choose Confirm Save.
Step 4: Create alerts in Logz.io
In addition to visualizing AWS Control Tower events, you can create alerts to be notified when certain events take place, for example disabling a guardrail. To create this, navigate to the Discover page in Logz.io by selecting the compass icon in the left pane.
- Add the desired filters. To create an alert for disabling guardrails, select + Add filter. In the Edit filter page, in the Field drop-down, select eventName. In the Operator drop-down, select is. In the Value drop-down enter and select DisableGuardrail. Choose Save. Choose Create alert.
- Enter an Alert Name. Under Accounts to search, select All accounts.
- Under Trigger if…, you can create a tiered trigger-determining severity level depending on the number of logs in this case or other variable of your choosing.
- You can choose which individuals you would like to notify when an alert has been triggered by adding their email address under Who to send it to.
- Choose Save to save your new alert.
Cleaning up
If you are going to use the solution on a regular basis, you can keep the configuration settings that you have configured. If you would like to stop using the solution, delete the S3 bucket linked to Logz.io under Send Your Data in the Logz.io platform to avoid incurring additional charges.
Conclusion
In this blog post, we showed how to use Logz.io from AWS Marketplace as a platform to build visualizations, dashboards, and alerts to gain additional observability and insights into your AWS Control Tower environment.
About the authors
 |
Devi Paulvannan Chapman is a Solutions Architect with Amazon Web Services. She enjoys working with customers to provide architectural and technical guidance on their cloud journey. Outside of work, she loves spending time outdoors rock climbing, hiking, and traveling to new places. |
 |
Sandeep Kashyap is a Sr Business Development Manager at AWS working with AWS Control Tower and AWS Service Catalog. In his role, Sandeep works with customers to help them adopt cloud management best practices such as multi-account frameworks using AWS Control Tower and Infrastructure as code with AWS Service Catalog. Sandeep also works with partners to integrate Independent Software Vendor Solutions with AWS Services in the management and tools category. |
 |
Justin Quinn is a Solutions Engineer with a background in Computer Science. Since graduating from college, Justin has worked in the logging/troubleshooting space from both an operations and security standpoint over the last 5 years. Justin enjoys exploring new technologies and sports in his spare time. |