AWS Big Data Blog

Turn Windows DHCP Server logs into actionable metrics using Amazon Kinesis Agent for Windows

Understanding Windows system and service health on a global scale is challenging. You capture server log data, and then analyze and manipulate the data in real time to create actionable telemetry insights. Amazon Kinesis Agent for Microsoft Windows makes it efficient to ingest Windows server log data into your AWS ecosystem for analysis. This blog post discusses using Kinesis Agent for Windows to capture and aggregate Windows Dynamic Host Configuration Protocol (DHCP) server logs. Then turning that data into service health graphs in Amazon CloudWatch.

How do you quantify network access metrics of a team across the globe? Specifically, in the northeast corner of the ninth floor in that team’s building? Does the Wireless Access Point (WAP) in that part of the building provide the team network access reliably and consistently? Or does the subnet that WAP is configured with, run out of IP addresses and deny network access to that team? This is the more definitive problem this article solves using Kinesis Agent for Windows.

Detecting customer impact as a result of scope exhaustion

Windows DHCP leases are divided into network subnets, referred to as scopes. These scopes are mapped to dedicated physical locations on a large corporate network. A scope is considered to be full when all IP addresses that belong to it are in use. This is known as “scope exhaustion”. When “scope exhaustion” occurs, any new clients are denied an IP address lease on that subnet. This is referred to as a “lease refusal.”  Commonly, a DHCP scope is defined for the exact number of devices that are expected, and no more. In these instances an exhausted scope is expected, which makes an alert meaningless if it is based purely on scope exhaustion.

When a Windows DHCP server refuses a lease due to “scope exhaustion,” it writes a specific record to the DHCP audit log. The record for this event is Event ID 14, “a lease request could not be satisfied because the scope’s address pool was exhausted.” The record itself has limited value unless the records are continuously observed and tallied for occurrences and patterns. Monitoring for this scenario is a challenge when there is a globally scaled DHCP service with hundreds of Windows Server DHCP failover relationships, meaning  two servers per relationship. And moreover when the service has thousands of scopes and millions of IP addresses. Here’s where the Kinesis Agent for Windows provides quite an advantage.

The DHCP Server log files are in a default C:\Windows\System32\dhcp directory. The IPv4 log file names are prefixed with DhcpSrvLog. The IPv6 log file names are prefixed with DhcpV6SrvLog. This post focuses on the IPv4 logs.

The log files have a header at the top of each file that defines and describes the potential Event IDs. It also shows the order of the comma-separated values in each log record. For a better idea about these logs, refer to the ones generated by your DHCP service. For more information, see Analyze DHCP Server Log Files, which is the official documentation from Microsoft. The following is a set of example log records that include an Event 14 record, indicating that a scope is full.

24,10/19/18,00:00:18,Database Cleanup Begin,,,,,0,6,,,,,,,,,0
18,10/19/18,00:00:18,Expired,192.168.1.251,,,,0,6,,,,,,,,,0
30,10/19/18,00:00:18,DNS Update Request,192.168.1.35,TEST-SERVER.domain.com,,,0,6,,,,,,,,,0
17,10/19/18,00:00:18,DNS record not deleted,192.168.5.35,,,,0,6,,,,,,,,,0
25,10/19/18,00:00:18,0 leases expired and 5 leases deleted,,,,,0,6,,,,,,,,,0
32,10/19/18,00:00:18,DNS Update Successful,192.168.1.35,TEST-SERVER.domain.com,,,0,6,,,,,,,,,0
14,10/19/18,00:00:19,Scope Full,192.168.3.10,,,,0,6,,,,,,,,,0
11,10/19/18,00:00:20,Renew,192.168.2.105,,00AABBCCDDEE,,1584371322,0,,,,0x506F6C79636F6D2D53504950333335,Polycom,,,,0
36,10/19/18,00:00:25,Packet dropped because of Client ID hash mismatch or standby server.,192.168.1.100,,EEDDCCBBAA00,,0,6,,,,,,,,,0

Important –  Windows DHCP Server logs do not include data to distinguish which server they were generated on, which is important information when analyzing an aggregated dataset for full scope events. The Kinesis Agent for Windows includes a feature called ObjectDecoration. It allows custom values to be injected into each log record. Values can be hardcoded or dynamically created from environment variables, such as ComputerName, located on each computer. In this use case, there are multiple DHCP failover relationships which metrics are posted for. So the values of the failover relationship names are interpreted from the server hostnames. An example hostname is: DHCP-<FailoverRelatioshipName>-nn. The appsettings.json file contents used for configuring Kinesis Agent for Windows is provided in this post, and includes ObjectDecoration used in this implementation.

Collecting, storing, and analyzing DHCP server logs

This section guides you through setting up the AWS serverless infrastructure to collect, store and analyze Windows DHCP server logs. You first define two workflows: log ingestion and log processing.
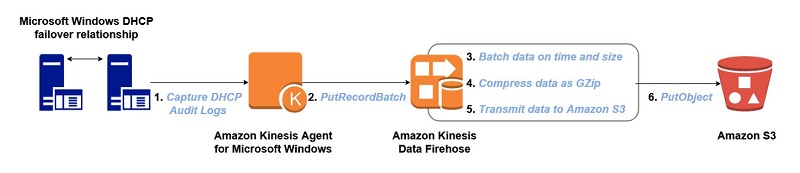
Log Ingestion

Kinesis Agent for Windows detects new records in near real-time and sends them to an Amazon Kinesis Data Firehose delivery stream. The delivery stream is configured to send batches of data, on a time interval or a size limit, in a compressed format to an Amazon S3 bucket.
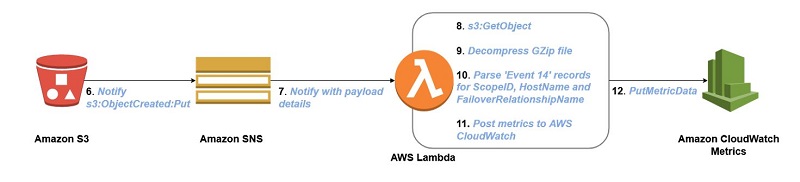
Log Processing

The S3 bucket is configured to send Amazon S3 Event Notifications to an Amazon Simple Notification Service (Amazon SNS) topic. An AWS Lambda function is subscribed to the SNS topic. When it is triggered, it gets the object from S3, and decompresses and processes the log data. It then posts an Amazon CloudWatch metric for every Event ID 14 found.

Note: By triggering from the S3 bucket to an Amazon SNS topic, other consumers of the data can subscribe to the same SNS topic. Also, you can filter out records other than Event 14 directly on the Kinesis Agent for Windows using the RegexFilterPipe feature, if you do not want to collect them. Additionally, you can configure Kinesis Agent for Windows to “pipe” another stream of the same log data or its filtered subset to a separate, dedicated, Kinesis Data Firehose, or other destination supported by the sink declarations for Kinesis Agent for Windows.

Build the log ingestion infrastructure

The next step is to create the AWS resources. Because the log source is a Windows environment, we use PowerShell to automate the build process. The AWS Tools for PowerShell provides cmdlets for developing and managing infrastructure within the AWS ecosystem.

For help with the log ingestion path, see this article about Using Amazon Kinesis Firehose that shows how to automate building the Amazon S3 bucket and Amazon Kinesis Firehose delivery stream. The Kinesis Agent for Windows setup part of this path is covered after the infrastructure components are built.

After creating your S3 bucket and Kinesis Firehose delivery stream, do the following to add the additional configurations:

  • Enable a bucket lifecycle policy to archive data to Amazon Glacier. This helps to minimize storage costs.
  • Compress the data prior to transmitting to Amazon S3. This helps to minimize storage costs.
  • Batch the data prior to transmitting to Amazon S3. This batches the most data with the shortest delivery time.
  • Include a S3 bucket prefix for the log destination. This helps to separate logs with different schemas.
  • Enable CloudWatch logging on the delivery stream. This helps to help troubleshoot any potential problems with ingestion.

Here is a code sample for making these configurations.

# Get existing objects
$s3BucketName = '<s3-bucket-name>'
$firehoseDeliveryStreamName = '<delivery-stream-name>'
$roleName = '<role-name>'

$s3Bucket = Get-S3Bucket -BucketName $s3BucketName
$firehoseDeliveryStream = Get-KINFDeliveryStream -DeliveryStreamName $firehoseDeliveryStreamName
$iamRole = Get-IAMRole -RoleName $roleName

# Enable S3 Bucket archival to Glacier
$s3BucketLifecycleRuleId = 'Archive to Glacier after 14 days'
$s3BucketLifecycleRuleTransition = New-Object Amazon.S3.Model.LifecycleTransition
$s3BucketLifecycleRuleTransition.Days = 14
$s3BucketLifecycleRuleTransition.StorageClass = 'GLACIER'

$s3BucketLifecycleRule = New-Object Amazon.S3.Model.LifecycleRule
$s3BucketLifecycleRule.Id = $s3BucketLifecycleRuleId
$s3BucketLifecycleRule.Status = 'Enabled'
$s3BucketLifecycleRule.Transition = $s3BucketLifecycleRuleTransition
$s3BucketLifecycleRule.Prefix = $null

Write-S3LifecycleConfiguration –BucketName $s3Bucket.BucketName -Configuration_Rule $s3BucketLifecycleRule

# Enable CW Logging options including creation of a log group and a log stream 
$logGroupName = "/aws/kinesisfirehose/$firehoseDeliveryStreamName"
$logStreamName = 'S3Delivery'

# Create CloudWatch LogGroup and LogStream
New-CWLLogGroup -LogGroupName $logGroupName
New-CWLLogStream -LogGroupName $logGroupName -LogStreamName $logStreamName

# Define Kinesis Firehose Logging Options
$loggingOptions = New-Object Amazon.KinesisFirehose.Model.CloudWatchLoggingOptions
$loggingOptions.Enabled = $true
$loggingOptions.LogGroupName = $logGroupName
$loggingOptions.LogStreamName = $logStreamName

# Define Buffering hints object for traffic between Delivery Stream and S3
$bufferingHints = New-Object Amazon.KinesisFirehose.Model.BufferingHints
$bufferingHints.IntervalInSeconds = 60
$bufferingHints.SizeInMBs = 128

# Define Kinesis Firehose S3 Destination Update
$s3Destination = New-Object Amazon.KinesisFirehose.Model.ExtendedS3DestinationUpdate
$s3Destination.BucketARN = 'arn:aws:s3:::{0}' -f $s3Bucket.BucketName
$s3Destination.RoleARN = $iamRole.Arn
$s3Destination.CompressionFormat = 'GZIP'
$s3Destination.BufferingHints = $bufferingHints
$s3Destination.Prefix = 'DHCPServerLogs'
$s3Destination.CloudWatchLoggingOptions = $loggingOptions

# Update the Kinesis Firehose Delivery Stream
$kinfdUpdateParams = @{
    CurrentDeliveryStreamVersionId   = $firehoseDeliveryStream.VersionId
    DeliveryStreamName               = $firehoseDeliveryStreamName
    DestinationId                    = $firehoseDeliveryStream.Destinations.DestinationId
    ExtendedS3DestinationUpdate      = $s3Destination
}
Update-KINFDestination @kinfdUpdateParams

Build the log processing infrastructure

# Create the SNS topic. The ARN of the created topic is returned.
$snsTopicName = 'DHCPLogLambdaNotifier'
$topicArn = New-SNSTopic -Name $snsTopicName

# Give S3 permissions to send notifications to the Topic
$topicPolicy = @"
{
    "Version": "2008-10-17",
    "Id": "__default_policy_ID",
    "Statement": [
        {
            "Sid": "S3Publish",
            "Effect": "Allow",
            "Principal": {
                "Service": "s3.amazonaws.com"
            },
            "Action": [
                "SNS:Publish"
            ],
            "Resource": "$topicArn",
            "Condition": {
                "StringEquals": {
                    "aws:SourceArn": "arn:aws:s3:::$s3BucketName"
                }
            }
        }
    ]
}
"@
Set-SNSTopicAttribute -TopicArn $topicArn -AttributeName 'Policy' -AttributeValue $topicPolicy

# Configure S3 Bucket SNS Topic Event Notification
$s3BucketTopicConfigurationFilterRule = New-Object Amazon.S3.Model.FilterRule
$s3BucketTopicConfigurationFilterRule.Name = 'Prefix'
$s3BucketTopicConfigurationFilterRule.Value = 'DHCPServerLogs/'

$s3BucketTopicConfigurationS3KeyFilter = New-Object Amazon.S3.Model.S3KeyFilter
$s3BucketTopicConfigurationS3KeyFilter.FilterRules = $s3BucketTopicConfigurationFilterRule

$s3BucketTopicConfigurationFilter = New-Object Amazon.S3.Model.Filter
$s3BucketTopicConfigurationFilter.S3KeyFilter = $s3BucketTopicConfigurationS3KeyFilter

$s3BucketTopicConfiguration = New-Object Amazon.S3.Model.TopicConfiguration
$s3BucketTopicConfiguration.Id = 'NotifySNS'
$s3BucketTopicConfiguration.Topic = $topicArn
$s3BucketTopicConfiguration.Filter = $s3BucketTopicConfigurationFilter
$s3BucketTopicConfiguration.Events = New-Object Amazon.S3.EventType 's3:ObjectCreated:*'
Write-S3BucketNotification -BucketName $s3BucketName -TopicConfiguration $s3BucketTopicConfiguration

# Create IAM policy and add AssumeRole policy for Lambda
$lambdaPolicy = @"
{
    "Version": "2012-10-17",
    "Statement": [
        {
            "Sid": "CloudWatch",
            "Effect": "Allow",
            "Action": [
                  "cloudwatch:PutMetricData",
                  "cloudwatch:GetMetricData",
                  "cloudwatch:GetMetricStatistics",
                  "cloudwatch:ListMetrics"
            ],
            "Resource": "*"
        },
        {
            "Sid": "S3",
            "Effect": "Allow",
            "Action": [
                  "s3:ListBucket",
                  "s3:GetObject",
                  "s3:GetBucketLocation",
                  "s3:GetBucketNotification"
            ],
            "Resource": [
                  "arn:aws:s3:::$s3BucketName",
                  "arn:aws:s3:::$s3BucketName/*"
            ]
        },
        {
            "Sid": "Log",
            "Effect": "Allow",
            "Action": [
                  "logs:CreateLogStream",
                  "logs:PutLogEvents"
            ],
            "Resource": [
                  "arn:aws:logs:*:*:*"
            ]
        }
    ]
}
"@

$iamRoleName = 'LambdaDHCPLogProcessor'
New-IAMPolicy -PolicyName $iamRoleName -PolicyDocument $lambdaPolicy
$assumeRolePolicy = @"
{
    "Version": "2012-10-17",
    "Statement": [
    {
        "Sid": "LambdaAssumeRole",
        "Effect": "Allow",
        "Principal": {
            "Service": "lambda.amazonaws.com"
        },
        "Action": [
            "sts:AssumeRole"
        ]
    }]
}
"@
$lambdaIamRole = New-IAMRole -RoleName $iamRoleName -AssumeRolePolicyDocument $assumeRolePolicy
$iamPolicy = Get-IAMPolicies | Where-Object {$_.PolicyName -eq $iamRoleName}
Register-IAMRolePolicy -RoleName $iamRoleName -PolicyArn $iamPolicy.Arn

# Create the Lambda Function
$lambdaFunctionParams = @{
        Description = 'For DHCP lease refusal metric posting'
        FunctionName = 'LeaseRefusalMetrics'
        ZipFilename = '.\LeaseRefusalMetrics.zip'
        Handler = 'LeaseRefusalMetrics.lambda_handler'
        Role = $lambdaIamRole.Arn
        Runtime = 'python3.6'
}
$lambdaFunction = Publish-LMFunction @lambdaFunctionParams

# Subscribe the Lambda Function to the SNS topic
$snsSubscriptionArn = Connect-SNSNotification -TopicARN $topicArn -Protocol Lambda -Endpoint $lambdaFunction.FunctionArn

# Add permission to the Lambda Function's policy so SNS can invoke it
Add-LMPermission -FunctionName $lambdaFunctionParams.FunctionName -Action "lambda:Invoke" -Principal sns.amazonaws.com -SourceArn $topicArn -StatementId (Get-Random)

Lambda function for processing logs and creating metrics

The Lambda function is where the log data is actually inspected for identifying Scope Full events and posting metrics. The code was originally written in Python. However, it could be converted to run with the recently released PowerShell language support in AWS Lambda. This script should be named LeaseRefusalMetrics.py. It should be in the contents of the LeaseRefusalMetrics.zip file as indicated in the buildout process shown in the previous section. The workflow is as follows:

  • Get and decompress the S3 object.
  • Read the S3 object data in as a byte stream and break it into individual records.
  • Scan the data for Event 14 (scope exhausted).
  • Break apart each comma-separated value from the Event 14 record.
  • Parse out values for the metric dimensions.
  • Post metric data to CloudWatch, resulting in three metrics.
from __future__ import print_function
import json
import urllib.parse
from io import BytesIO
from gzip import GzipFile
import datetime
from datetime import timedelta
import re
import boto3

s3Client = boto3.client('s3')
cwClient = boto3.client('cloudwatch')

def lambda_handler(event, context):
    print(json.dumps(event))

    s3message = json.loads(event['Records'][0]['Sns']['Message'])
    print(json.dumps(s3message))

    bucket = s3message['Records'][0]['s3']['bucket']['name']
    key = urllib.parse.unquote_plus(s3message['Records'][0]['s3']['object']['key'], encoding='utf-8')

    # Decompress the S3 object and read data in as byte stream
    try:
        response = s3Client.get_object(Bucket=bucket, Key=key)
        bytestream = BytesIO(response['Body'].read())
        s3object_text = GzipFile(None, 'rb', fileobj=bytestream).read().decode('utf-8')
    except Exception as e:
        print(e)
        print('Error getting object {} from bucket {}. Make sure they exist and your bucket is in the same region as this function.'.format(key, bucket))
        raise e


    # Split ByteStream into individual records and search for event 14 (scope exhausted)
    # When Event 14 is found, break apart each individual CSV record to parse out values
    # for metric dimensions: dhcpFailoverRelationshipName, dhcpScopeId. Finally, post a metric to CloudWatch.
    # Sample record: "DHCP-FailoverRelationshipName-01:::14,11/06/18,03:04:00,Scope Full,192.168.243.0,,,,0,6,,,,,,,,,0"

    records = s3object_text.splitlines()
    for record in records:
        recordValues = ""
        hostTemp = ""
        temp = ""
        date = ""
        time = ""
        dhcpFailoverRelationshipNameTemp = ""
        dhcpFailoverRelationshipName = ""
        dhcpHostName = ""
        dhcpScopeId = ""

        if re.match(r'^DHCP-.*:::14,', record, re.IGNORECASE):
            print("DHCP Full Scope Event: " + record)
            recordValues = record.split(',')
            hostTemp = recordValues[0]
            dhcpScopeId = str(recordValues[4])

            eventDate = str(recordValues[1]).replace("/","-")
            eventTime = recordValues[2]
            strDateTime = eventDate + " " + eventTime
            eventDTime = datetime.datetime.strptime(strDateTime, "%m-%d-%y %H:%M:%S")

            temp = hostTemp.split(':::')
            dhcpHostName = temp[0]
            dhcpFailoverRelationshipNameTemp = dhcpHostName.split('-')
            dhcpFailoverRelationshipName = dhcpFailoverRelationshipNameTemp[1]

            response = cwClient.put_metric_data(
                Namespace='DHCPService',
                MetricData=[
                    {
                        'MetricName': 'ScopeFullLeaseRefusal',
                        'Dimensions': [
                            {
                                'Name': 'DHCPFailoverRelationshipName',
                                'Value': dhcpFailoverRelationshipName
                            },
                            {
                                'Name': 'DHCPScopeId',
                                'Value': dhcpScopeId
                            }
                        ],
                        'Timestamp': eventDTime,
                        'Value': 1,
                        'Unit': 'Count',
                        'StorageResolution': 60
                    },
                    {
                        'MetricName': 'ScopeFullLeaseRefusal',
                        'Dimensions': [
                            {
                                'Name': 'DHCPFailoverRelationshipName',
                                'Value': dhcpFailoverRelationshipName
                            }
                        ],
                        'Timestamp': strDateTime,
                        'Value': 1,
                        'Unit': 'Count',
                        'StorageResolution': 60
                    },
                    {
                        'MetricName': 'AggregateLeaseRefusal',
                        'Dimensions': [
                            {
                                'Name': 'ScopeFullLeaseRefusal',
                                'Value': 'ScopeFullLeaseRefusal'
                            }
                        ],
                        'Timestamp': strDateTime,
                        'Value': 1,
                        'Unit': 'Count',
                        'StorageResolution': 60
                    }
                ]
            )

            print("CW.Put_Metric Response: ", response)

Configure Kinesis Agent for Windows to send logs

Next, configure Kinesis Agent for Windows to start collecting log data so it can be processed. Follow the Installing Kinesis Agent for Windows guide to install and configure agents. The appsettings.json file contents used by the agents are shown below, along with some comments that are particular to this implementation.

{
    "Sources": [
        {
            "Id": "DHCPServerLog",
            "SourceType": "DirectorySource",
            "Directory": "C:\\Windows\\System32\\dhcp",
            "FileNameFilter": "Dhcp*SrvLog-*.log", <--------------- Only capture specific file names
            "InitialPosition": "Bookmark",
            "RecordParser": "SingleLine" <------------------------- Indicates that each distinct record is line delimited
        }
    ],
    "Pipes": [
        {
            "Id": "DHCPServerLog2Firehose",
            "SourceRef": "DHCPServerLog",
            "SinkRef": "DHCPServerLogsToFirehose",
            "Type": "RegexFilterPipe",
            "FilterPattern": "^\\d{2},.*" <------------------------ Indicates to only collect records that begin with two 
        }                                                           digits followed by a comma. Recall our log file has a
    ],                                                              header which we don't need to collect. 
    "Sinks": [
        {
            "Id": "DHCPServerLogsToFirehose",
            "SinkType": "KinesisFirehose",
            "StreamName": "DHCPServerLogs",
            "TextDecoration": "{ComputerName}:::{_record}" <------- Decorate each log record by pre-pending the hostname 
        }                                                           and the following custom delimiter ':::'
    ]
}

View the log data

The following is an efficient way to view the ingested data in Amazon S3:

  1. Sign in to the AWS Management Console and open the Amazon S3 console. Go to the S3 bucket that the Kinesis Data Firehose delivery streams are streaming to, and choose an object.
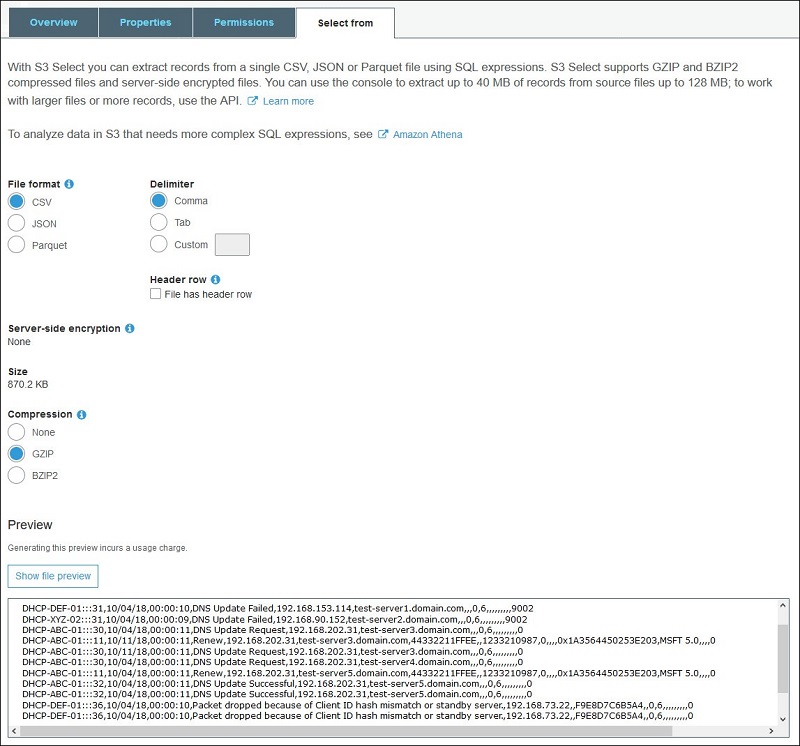
  2. Choose the Select from
  3. Under File format, choose CSV, and then choose Show file preview.

You should see DHCP logs appear in the preview text box. It includes the ObjectDecoration that was applied to the Kinesis Agent for Windows configuration:

Log processing output

The following set of metrics are populated in CloudWatch as a result of the log processing:

  • An aggregate lease refusal metric of all DHCP failover relationships globally.
  • A metric graph that shows lease refusals for each DHCP failover relationship.
  • A metric graph for lease refusals for each scope, with the owning DHCP failover relationship.

View the graphs in CloudWatch Metrics

This section shows how to view the graphs that the Lambda function populated in CloudWatch metrics.  This presumes there are Event 14 records that have been processed.

Note: You can inject a test Event 14 record into your DHCP log file. For more information, see Using Amazon CloudWatch Metrics or, more specifically, how to View Available Metrics.

To view the graphs:

  1. Sign in to the Amazon CloudWatch console.
  2. In the navigation pane, choose Metrics, and browse to the DHCPService namespace that the Lambda function populated. In the namespace, you should see a set of three metric dimensions that were also created (“DHCPScopeId, DHCPFailoverRelationship“, “DHCPFailoverRelationship“, and “ScopeFullLeaseRefusal“).
  3. You can drill down further into any one of the metric dimensions to view the graphs. Choose the ScopeFullLeaseRefusal metric dimension. There should be one metric present, AggregateLeaseRefusal, which is the aggregate of all lease refusals, globally.
  4. Choose the metric to view the data points.

Here, the graphs for each of our metric dimensions have been added to a CloudWatch dashboard for an overall snapshot. For more information about how to accomplish this, see Using Amazon CloudWatch Dashboards. The following graphs show one failover relationship name (ABC).

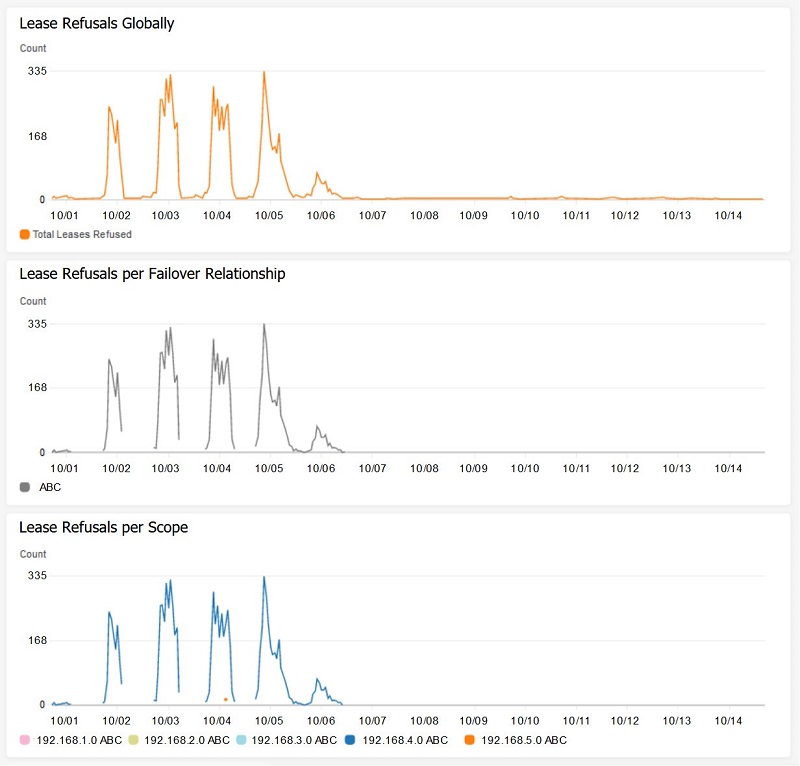
The graphs show that a particular DHCP scope (192.168.4.0) in the ABC failover relationship has a high volume of lease refusals as a result of scope exhaustion. In fact, it can be as many as 335 lease refusals per hour at one point in time.

Another observation is that the lines in the metric graphs break at certain times, and also never return to zero. This is because a value is posted only when Event 14 is detected. A zero is not posted at times when Event 14 is not detected. This simplifies the Lambda function and eliminates the need to make determinations at runtime about whether to post zeros. If there are a large number of failover relationships or scopes, the additional data visualization can have the effect of muddying the waters. Because the only concern is seeing when, where, and how many lease refusals are occurring, these metric graphs work efficiently and serve their purpose.

Conclusion

Using Kinesis Agent for Windows, our disparate DHCP server log data has been transformed into actionable CloudWatch metrics. This gives us the ability to identify DHCP scope exhaustion and the resulting customer impact. We can then work with the network engineering team to expand certain DHCP scopes with additional IP addresses to improve the overall customer experience.

The Amazon Kinesis Agent for Microsoft Windows makes your job more efficient. It speeds up results by letting you focus on building your solution. You don’t get bogged down with implementing solutions to collect and store log data. We hope that this use case sparked your curiosity to use Amazon Kinesis Agent for Microsoft Windows for more creative and sophisticated purposes, especially when taking advantage of the full breadth of AWS services. There are so many possibilities when using Amazon Kinesis Agent for Microsoft Windows.

Additional Resources


About the Author

Ted Balsimo is a Systems Development Engineer at Amazon Web Services.