AWS News Blog
Amazon Kinesis- Setting up a Streaming Data Pipeline
Ray Zhu from the Amazon Kinesis team wrote this great post about how to set up a streaming data pipeline. He carefully shows you step by step how he set it all up and how you can do it too.
-Ana
Consumer demand for better experiences is ever increasing today. Companies across different industry segments are looking for ways to differentiate their products and services. Data is a key ingredient for providing differentiated products and services, and this is no longer a secret but rather a well adopted practice. Almost all companies at meaningful size are using some sort of data technologies, which means being able to collect and use data is no longer enough as a differentiating factor. Then what? How fast you can collect and use your data becomes the key to stay competitive.
Streaming data technologies shorten the time to analyze and use your data from hours and days to minutes and seconds. Let’s walk through an example of using Amazon Kinesis Firehose, Amazon Redshift, and Amazon QuickSight to set up a streaming data pipeline and visualize Maryland traffic violation data in real time.
Data Flow Overview

Step 1 Set up Redshift database and table
In this step, I’ll set up a Redshift table for Kinesis Firehose to continuously load streaming data into. I first start a single node Redshift cluster and name it “raystreaming.”
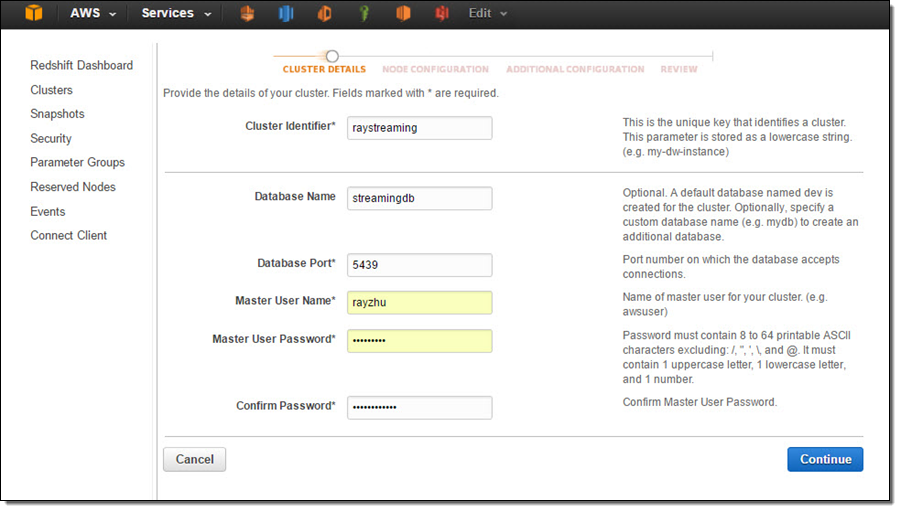
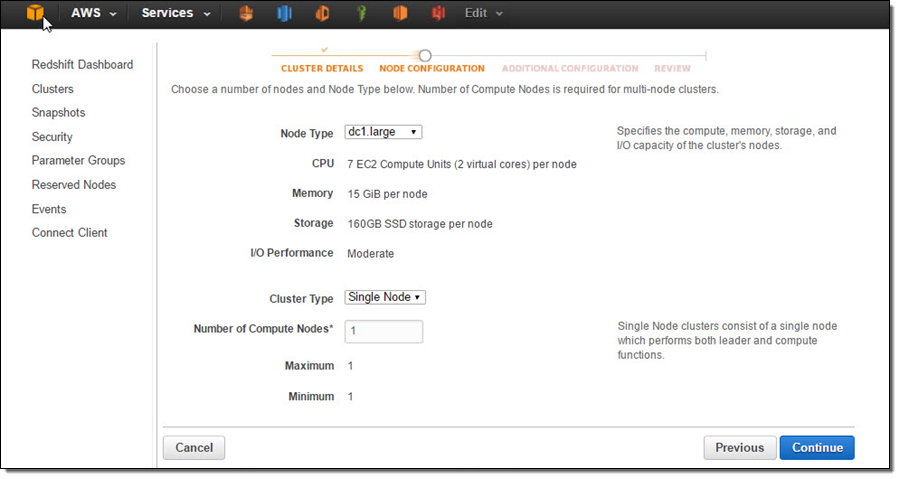
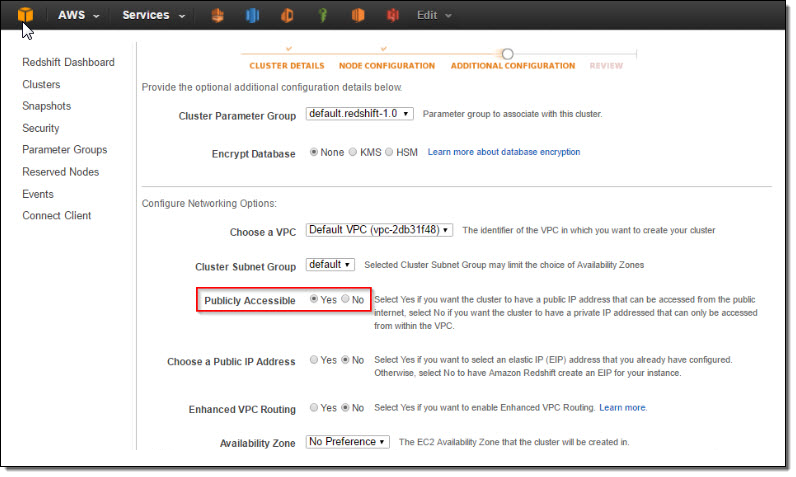
Under “Additional Configuration”, I make the cluster publicly accessible so that Kinesis Firehose and QuickSight can connect to my cluster.
After reviewing all configurations, I click on “Launch Cluster”.
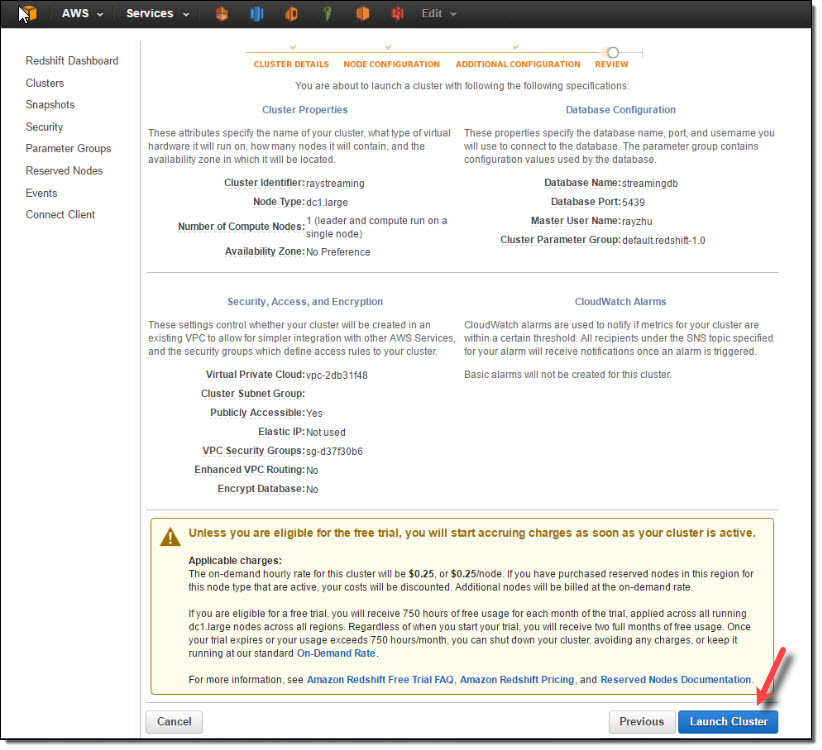
Once the cluster is active, I go to the cluster’s VPC Security Groups to add inbound access for Kinesis Firehose service IPs and outbound access for QuickSight service IPs.
Kinesis Firehose service IPs:
| US East (N. Virginia) | 52.70.63.192/27 |
| US West (Oregon) | 52.89.255.224/27 |
| EU (Ireland) | 52.19.239.192/27 |
QuickSight service IPs:
| US East (N. Virginia) | 52.23.63.224/27 |
| US West (Oregon) (us-west-2) | 54.70.204.128/27 |
| EU (Ireland) (eu-west-1) | 52.210.255.224/27 |
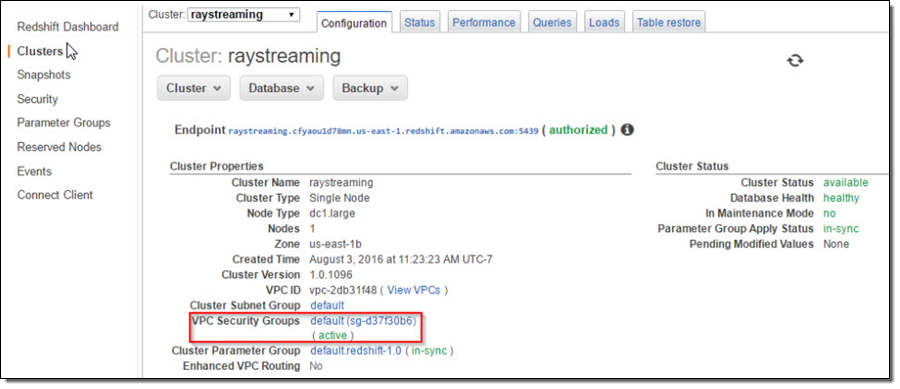

Now the cluster is setup and configured. I’ll use a JDBC tool and the SQL statement below to create a table for storing Maryland traffic violation data.
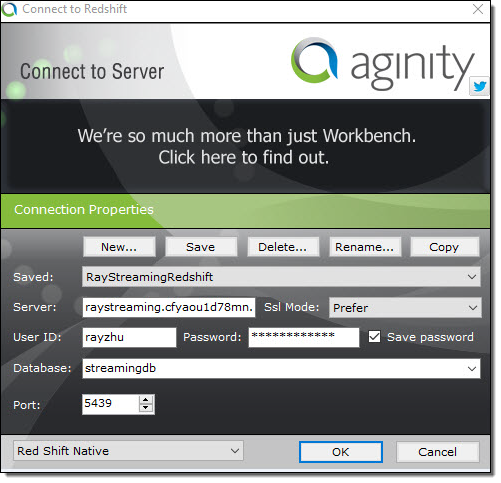
create table TrafficViolation(
 dateofstop date,
 timeofstop timestamp,
 agency varchar(100),
 subagency varchar(100),
 description varchar(300),
 location varchar(100),
 latitude varchar(100),
 longtitude varchar(100),
 accident varchar(100),
 belts varchar(100),
 personalinjury varchar(100),
 propertydamage varchar(100),
 fatal varchar(100),
 commlicense varchar(100),
 hazmat varchar(100),
 commvehicle varchar(100),
 alcohol varchar(100),
 workzone varchar(100),
 state varchar(100),
 veichletype varchar(100),
 year varchar(100),
 make varchar(100),
 model varchar(100),
 color varchar(100),
 violation varchar(100),
 type varchar(100),
 charge varchar(100),
 article varchar(100),
 contributed varchar(100),
 race varchar(100),
 gender varchar(100),
 drivercity varchar(100),
 driverstate varchar(100),
 dlstate varchar(100),
 arresttype varchar(100),
 geolocation varchar(100));
Step 2 Set up Kinesis Firehose delivery stream
In this step, I’ll set up a Kinesis Firehose delivery stream to continuously deliver data to the “TrafficViolation” table created above.
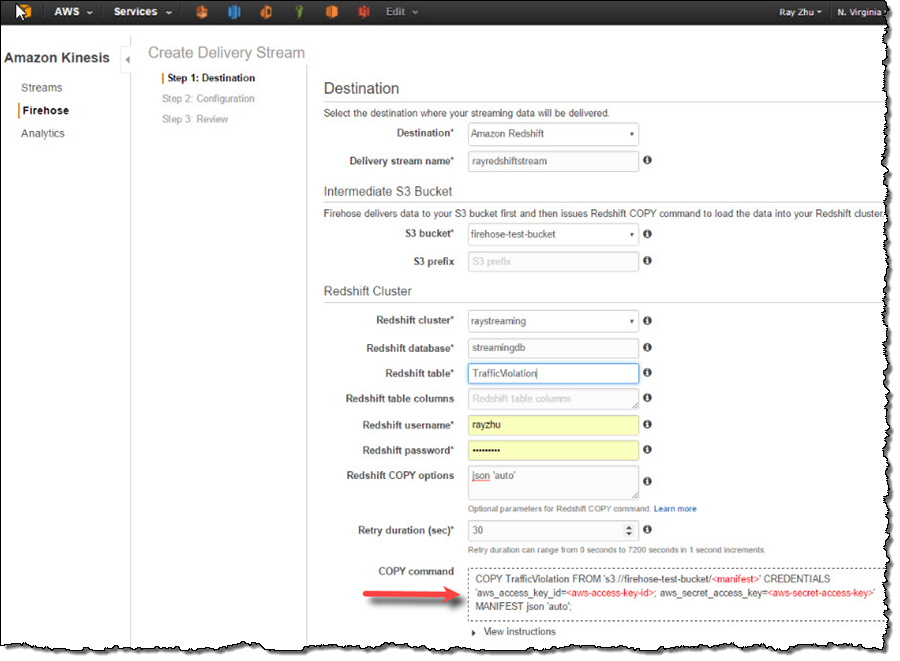
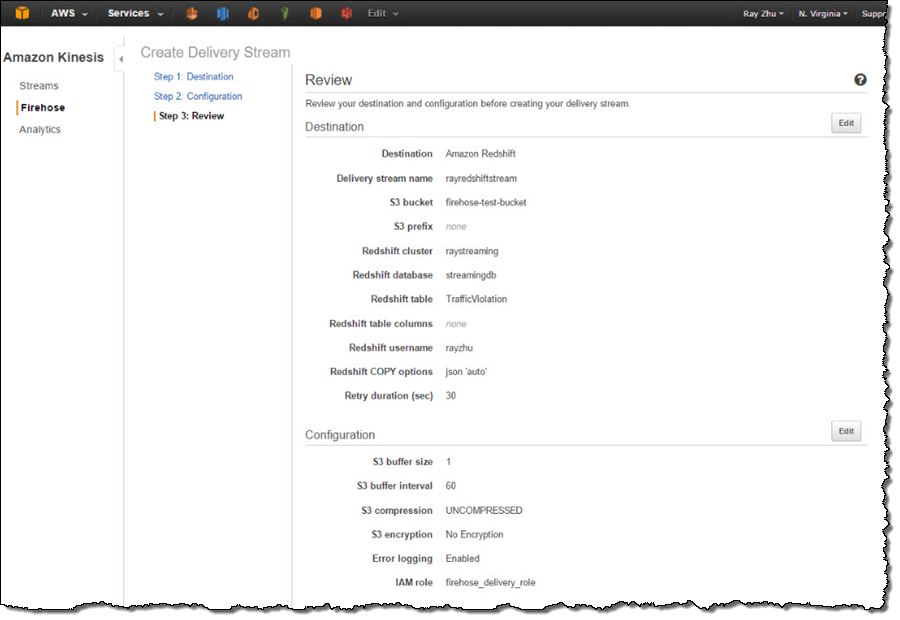
I name my Firehose delivery stream “rayredshiftstream”. Under destination configurations, I choose “Amazon Redshift” as destination and configure an intermediate S3 bucket. Kinesis Firehose will first load my streaming data to this intermediate buckets and then COPY it to Redshift. Loading data from S3 to Redshift is efficient and preserves resources on Redshift for queries. Also, I always have a backup of my data in S3 for other batch processes or in case my Redshift cluster is not accessible (e.g. under maintenance).
Subsequently, I enter the Redshift cluster, database, and table names along with Redshift user name and password. This user needs to have Redshift INSERT permission. I also specify “json ‘auto’” under COPY options to parse JSON formatted sample data.
I set retry duration to 30 seconds. In cases when data load to my Redshift cluster fails, Kinesis Firehose will retry for 30 seconds. The failed data is always in the intermediate S3 bucket for backfill. At the bottom, the exact COPY command Kinesis Firehose will use is generated for testing purposes.
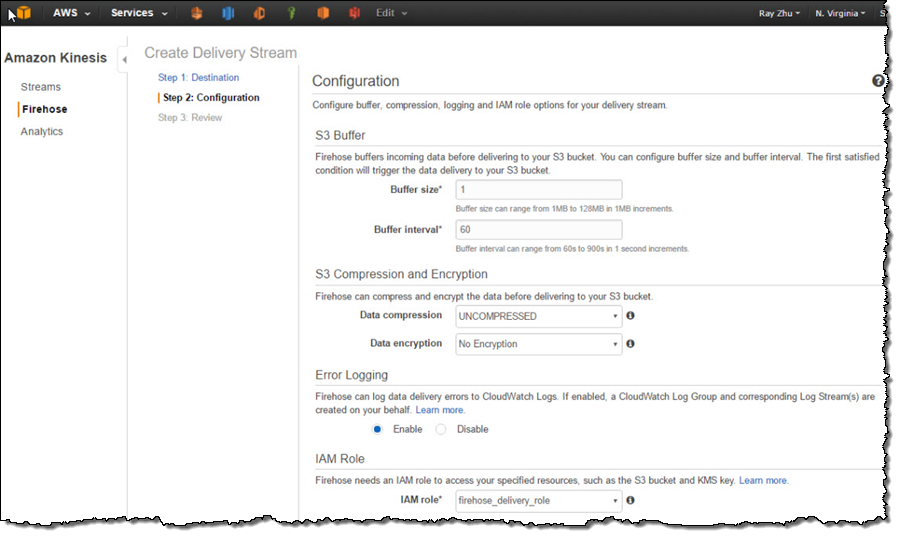
On the next page, I specify buffer size and buffer interval. Kinesis Firehose buffers streaming data to a certain size or for a certain period of time before loading it to S3. Kinesis Firehose’s buffering feature reduces S3 PUT requests and cost significantly and generates relatively larger S3 object size for efficient data load to Redshift. I’m using the smallest buffer size (1MB) and shortest buffer interval (60 seconds) in this example in order to have data delivered sooner.
You can also optionally configure Kinesis Firehose to compress the data in GZIP format before loading it to S3 and use a KMS key to encrypt the data in S3. In this example, I configure my data to be uncompressed and unencrypted. Please note that if you enable GZIP compression, you’ll also need to add “gzip” under Redshift COPY options.
I also enable error logging for Kinesis Firehose to log any delivery errors to my CloudWatch Log group. The error messages are viewable from Kinesis Firehose console as well and are particularly useful for troubleshooting purpose.
Finally, I configure a default IAM role to allow Kinesis Firehose to access the resources I configured in the delivery stream.
After reviewing all configurations, I click on “Create Delivery Stream”.
Step 3 Send data to Kinesis Firehose delivery stream
Now my Firehose delivery stream is set up and pointing to my Redshift table “TrafficViolation”. In this example, I’m using the Traffic Violations dataset from US Government Open Data. I use the Kinesis Firehose sample from AWS Java SDK to parse records from local csv file and send each record to my delivery stream.
In real streaming use cases, you can imagine that each data record is pushed to the delivery stream from police officer’s cellular devices through Firehose’s PutRecord() or PutRecordBatch() APIs as soon as a violation ticket is recorded.
A sample of the data looks like the following and includes information such as time of stop, vehicle type, driver gender, and so forth.
09/30/2014,23:51:00,MCP,"1st district, Rockville",\
  DRIVER FAILURE TO STOP AT STEADY CIRCULAR RED SIGNAL,\
  PARK RD AT HUNGERFORD DR,,,No,No,No,No,No,No,No,No,No,No,\
  MD,02 - Automobile,2014,FORD,MUSTANG,BLACK,Citation,21-202(h1),\
  Transportation Article,No,BLACK,M,ROCKVILLE,MD,MD,A - Marked Patrol,
Step 4 Visualize the data from QuickSight
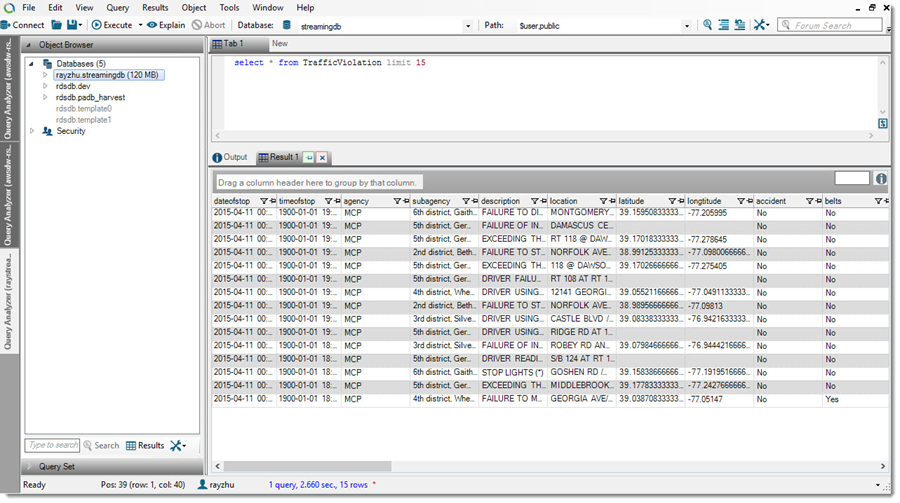
As I continuously push data records to my delivery stream “rayredshiftstream”, I can see these data gets populated to my Redshift table “TrafficViolation” continuously.
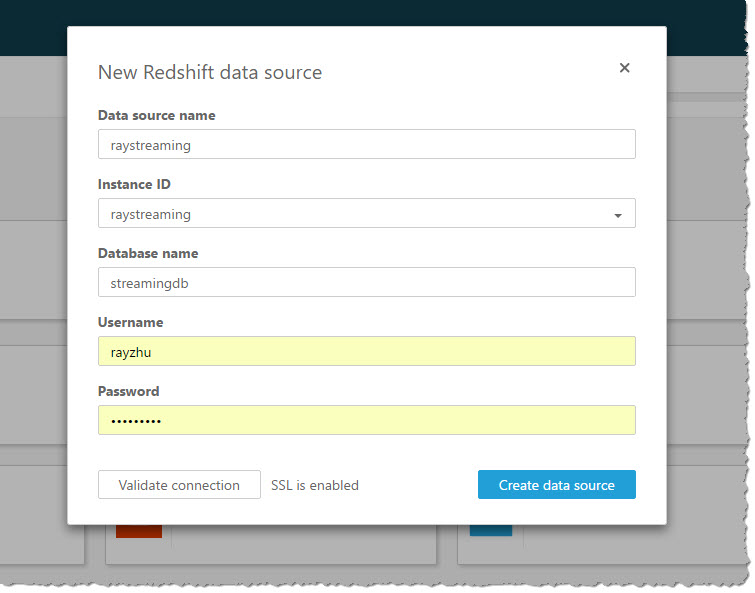
Now I’m going to use QuickSight to analyze and visualize the data from my Redshift table “TrafficViolation”. I create a new analysis and a new data set pointing to my Redshift table “TrafficViolation”.
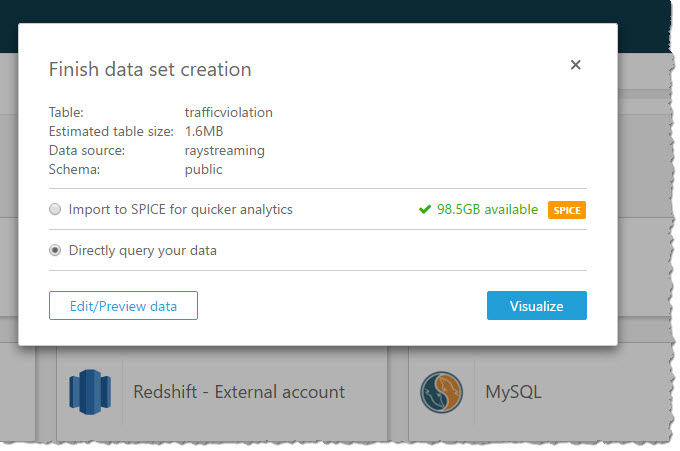
I use “Query” mode to directly retrieve data from my Redshift cluster so that new data is retrieved as they are continuously streamed from Kinesis Firehose.
With a few clicks, I create a bar chart graph that displays number of traffic violations by gender and hour of the day. There are a few interesting patterns: 1) Male drivers have significantly more traffic violations than female drivers during morning hours. 2) Noon has the lowest number of violations. 3) From 2pm to 4pm, the number of violations gap between male and female drivers narrows.
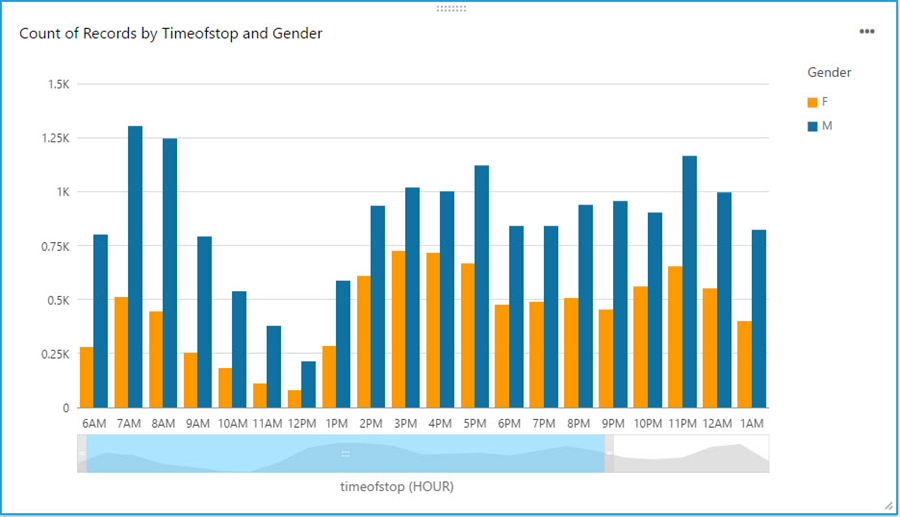
With a live dashboard, this graph will keep updating itself throughout the day as new data continuously gets streamed from police officer’s devices to Redshift through Kinesis Firehose. Another interesting live dashboard to build will be a map graph that shows a heat map of traffic violations across different districts of Maryland over time. I’ll leave this exercise to the readers of this blog and you can use your favorite Business Intelligent tools to do so.
That’s it!
Hopefully through reading this blog and trying it out yourself, you’ve got some inspirations about streaming data and a sense of how easy it is to get started with streaming data analytics on AWS. I cannot wait to see what streaming data analytics pipelines and applications you can build for your organizations!
-Ray Zhu