AWS Compute Blog
Centralizing Windows Logs with Amazon Elasticsearch Services
September 8, 2021: Amazon Elasticsearch Service has been renamed to Amazon OpenSearch Service. See details.
Cloud administrators often rely on centralized logging systems to better understand their environments, learn usage patterns, and identify future problems so that they can pre-emptively prevent them from occurring, or troubleshoot them more effectively. Of course, these are just some of the functions a centralized logging strategy provides, all which help IT organizations become more productive. However, delivering these insightful services in-house requires significant effort, including daily management and updates, backups, high availability, hardening, encryption in transit and at rest, and storage management.
Cloud admins can reduce this management effort by creating a near real-time event management solution running on AWS using Amazon Elasticsearch Services and Winlogbeat from Elastic as a Windows Agent. This blog post provides step by step instructions on how you can create such a management solution to analyze your Windows Logs based Amazon EC2 instances without the need of expensive third-party products.
Step by Step
Steps for this procedure include:
- Launch an Amazon Elasticsearch Service domain.
- Install and configure the Winlogbeat agent offered by Elastic.co in an Amazon EC2 running Windows instances.
- Customize Logs visualization on Kibana.
1. Launch an Amazon Elasticsearch Service domain.
- Open the AWS Console Elasticsearch Service Dashboard
- Click “Create a new domain”.
- Enter the Domain Name and select the version Elasticsearch 6.0 or earlier.
- Click Next.
- On Configure Cluster Page, choose the options that better fit your needs. In my case, it will be the following configuration:
Node Configuration
– Instance Count: 1
– Instance Type: m4.large.elasticsearch
Storage
– Storage Type: EBS
– EBS Volume Type: General Purpose (SSD)
– EBS Volume Size: 100 GB
Snapshot Configuration
– Automated snapshot start hour: 00:00 UTC (Default)
6. Click Next.
7. On Network Configuration page.
8. Select VPC Access (Recommended)
– Select the VPC, Subnet and Security Groups in which the Elasticsearch cluster will be launched. (The Amazon ElasticSearch Service uses TCP port 443 and must be released in the selected Security Group).
– Kibana Authentication will not be used in this demo, leave it blank.
– On Access Policy: Do not require signing request with IAM credential (Allows associated security groups within your VPC full access to the domain).
9. Click Next.
10. Click Confirm and the Amazon Elasticsearch domain will be launched.
While the Amazon Elasticsearch Service is launching, configure the agent on the Amazon EC2.
2. Install and configure the Winlogbeat agent offered by Elastic.co on Amazon EC2 Instances.
1. Access Elasticsearch Winlogbeat and download the x64 installer.

2. Extract the contents in the “C:\Program Files” directory and rename the extracted directory to Winlogbeat.

3. Within the Winlogbeat directory (renamed earlier), there is a file called winlogbeat.yml, open it for editing.
4. The winlogbeat.event_logs section should contain the name of the logs that will be sent to the Amazon Elasticsearch service.

*Note: Use the following command in PowerShell to access the name of all event logs available in the operating system:
Get-WinEvent -Listlog * | Format-List -Property LogName > C:\Logs.txt
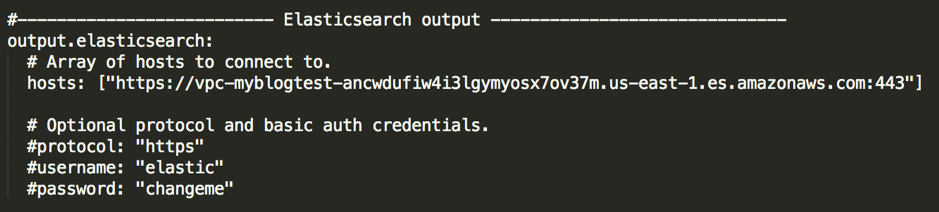
The output.elasticsearch section must contain the URL of the Amazon Elasticsearch Service domain. Port 443 must be specified as in the image below, otherwise the agent will attempt to use the default port of Elasticsearch (9300/tcp).
In the setup.kibana section, you must add the URL of the domain. Port 443 must be specified as in the image above (before /_plugin/kibana). The URL must be entered exactly as in the image below (in quotation marks).
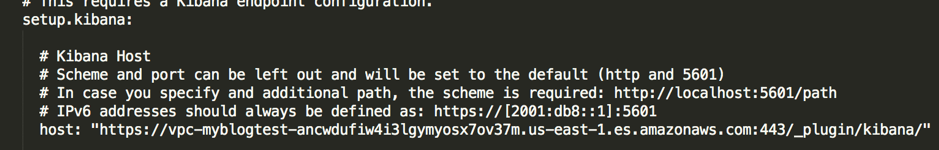
* Note: The Amazon Elasticsearch Service and Kibana URLs are available in the administration console of the Elasticsearch domain just created in step 1.

5. After the winlogbeat.yml file is properly configured, install the agent.
6. Open Powershell as administrator and navigate to the “C:\Program Files\ Winlogbeat” directory
Run the installation script: .\install-service-winlogbeat.ps1

*Note: If script execution fails due to operating system policy restriction, run Setup with the following command:
PowerShell.exe -ExecutionPolicy UnRestricted -File .\install-service-winlogbeat.ps1
7. If successfully installed, the Service Status will appear as Stopped. Verify that the configuration file has no syntax error with the following command:
.\winlogbeat.exe test config -c .\winlogbeat.yml

8. Run the command to import the Kibana dashboard. The output should read ‘Loaded dashboards’.
.\winlogbeat.exe setup –dashboards

9. Without errors in the configuration file and dashboards imported, start the service with the following command:
Start-Service winlogbeat

10. Verify that the agent has successfully connected to the Amazon Elasticsearch Service by analyzing the log generated in the agent in “C:\ProgramData\winlogbeat\Logs” file and search for Connection to backoff with Established result.

3. Customize Logs visualization on Kibana
Logs will now start being sent to the Amazon Elasticsearch Service and you can create insights about the environment.
1. Access Kibana through a browser of an Amazon EC2 Windows instance at the Kibana address entered in the administration console of the Amazon Elasticsearch Service domain.

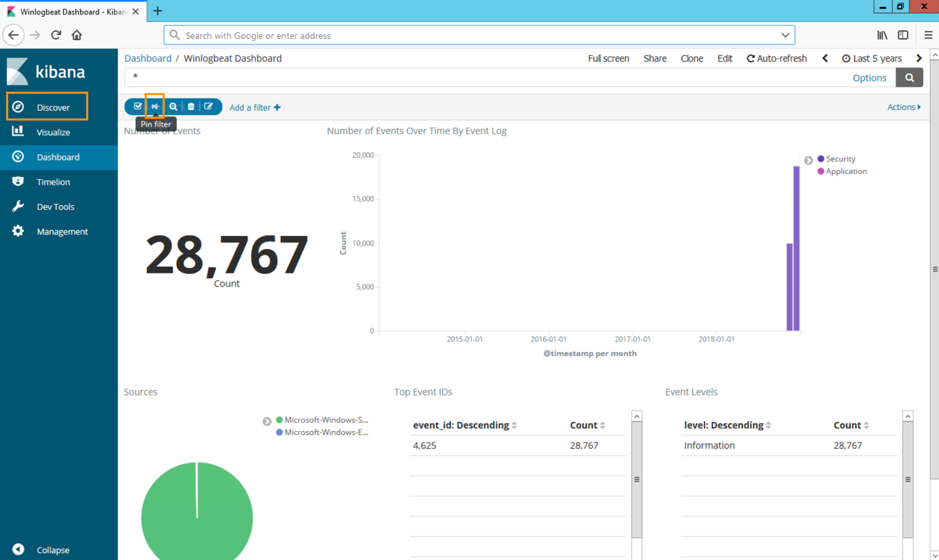
2. Navigate to the Dashboard tab and you will see the Dashboard named: Winlogbeat Dashboard, click on it and a screen similar to the one below will be displayed.

You now have an AWS-managed log centralization system. Just set up your Amazon EC2 instances to send the logs to Amazon Elasticsearch Service and create the filters as needed.
Here is an example on how about create a filter for Logon Failure for Event ID 4625. With the Security logs configured as a shipping log in winlogbeat.yml, any unsuccessful logon attempt will generate an EventID 4625 and this will be filtered.
Click Add a filter and create a filter as in the image below and click Save.

After the filter is created, click PIN FILTER as shown in the image below and then click Discover.
It will now be possible to better understand each log and take the appropriate actions.

To learn more about Microsoft Workloads on AWS, go to:
https://aws.amazon.com/pt/solutionspace/microsoft-workloads/
About the Author

Marcio Morales is a Senior Solution Architect at Amazon Web Services. He works with AWS customers to provide guidance and technical assistance on running their Microsoft workloads on AWS.