Containers
AWS and Kubecost Collaborate to Deliver Kubecost 2.0 for Amazon EKS Users
Introduction
In August 2022, Amazon Elastic Kubernetes Service (Amazon EKS) announced the availability of an Amazon EKS-optimized bundle of Kubecost for cluster cost visibility. The bundle is available to Amazon EKS users free of charge and enables users to gain deeper cost insights into Kubernetes resources, such as namespace, cluster, pod, and organizational concepts (for example by team or application).
Today, we’re excited to announce that Amazon EKS users can benefit from new features as part of the Kubecost 2.0 announcement, at no cost. This post shows key new features and how users can get started with each of them.
Network Monitoring
Kubecost’s Network Monitoring provides full visibility into Kubernetes and cloud network costs. By monitoring the cost of pods, namespaces, clusters, and cloud services, you can quickly track and attribute network costs to your applications in near real-time. You can discover more about the sources of your inbound and outbound traffic costs, drag-and-drop icons representing Kubernetes entities (for example namespace, cluster, or pod), or hone in on specific traffic routes. This functionality is especially helpful for larger organizations that have a higher percentage of their cloud spend represented in network costs across AWS Regions or zones. It’s also useful to any user hoping to learn more about complex network costs. You can learn more in the Kubecost Network Monitoring documentation.

Actions
Kubecost Actions provide users with automated workflows to optimize Kubernetes costs. These can be configured within the Kubecost UI or by YAML configuration. It’s available today with two core actions:
- Dynamic request sizing: Automatically implement Kubecost’s container right-sizing recommendations to help prevent waste and save money.
- Cluster and namespace turndown: Configure a schedule to turn off your clusters or namespaces when you don’t need them, such as on nights or weekends. Have them automatically turned back on when you want to restart work.
These updates make it easier for users to get the most out of our offered savings functionality. You can learn more in the Kubecost Actions documentation.
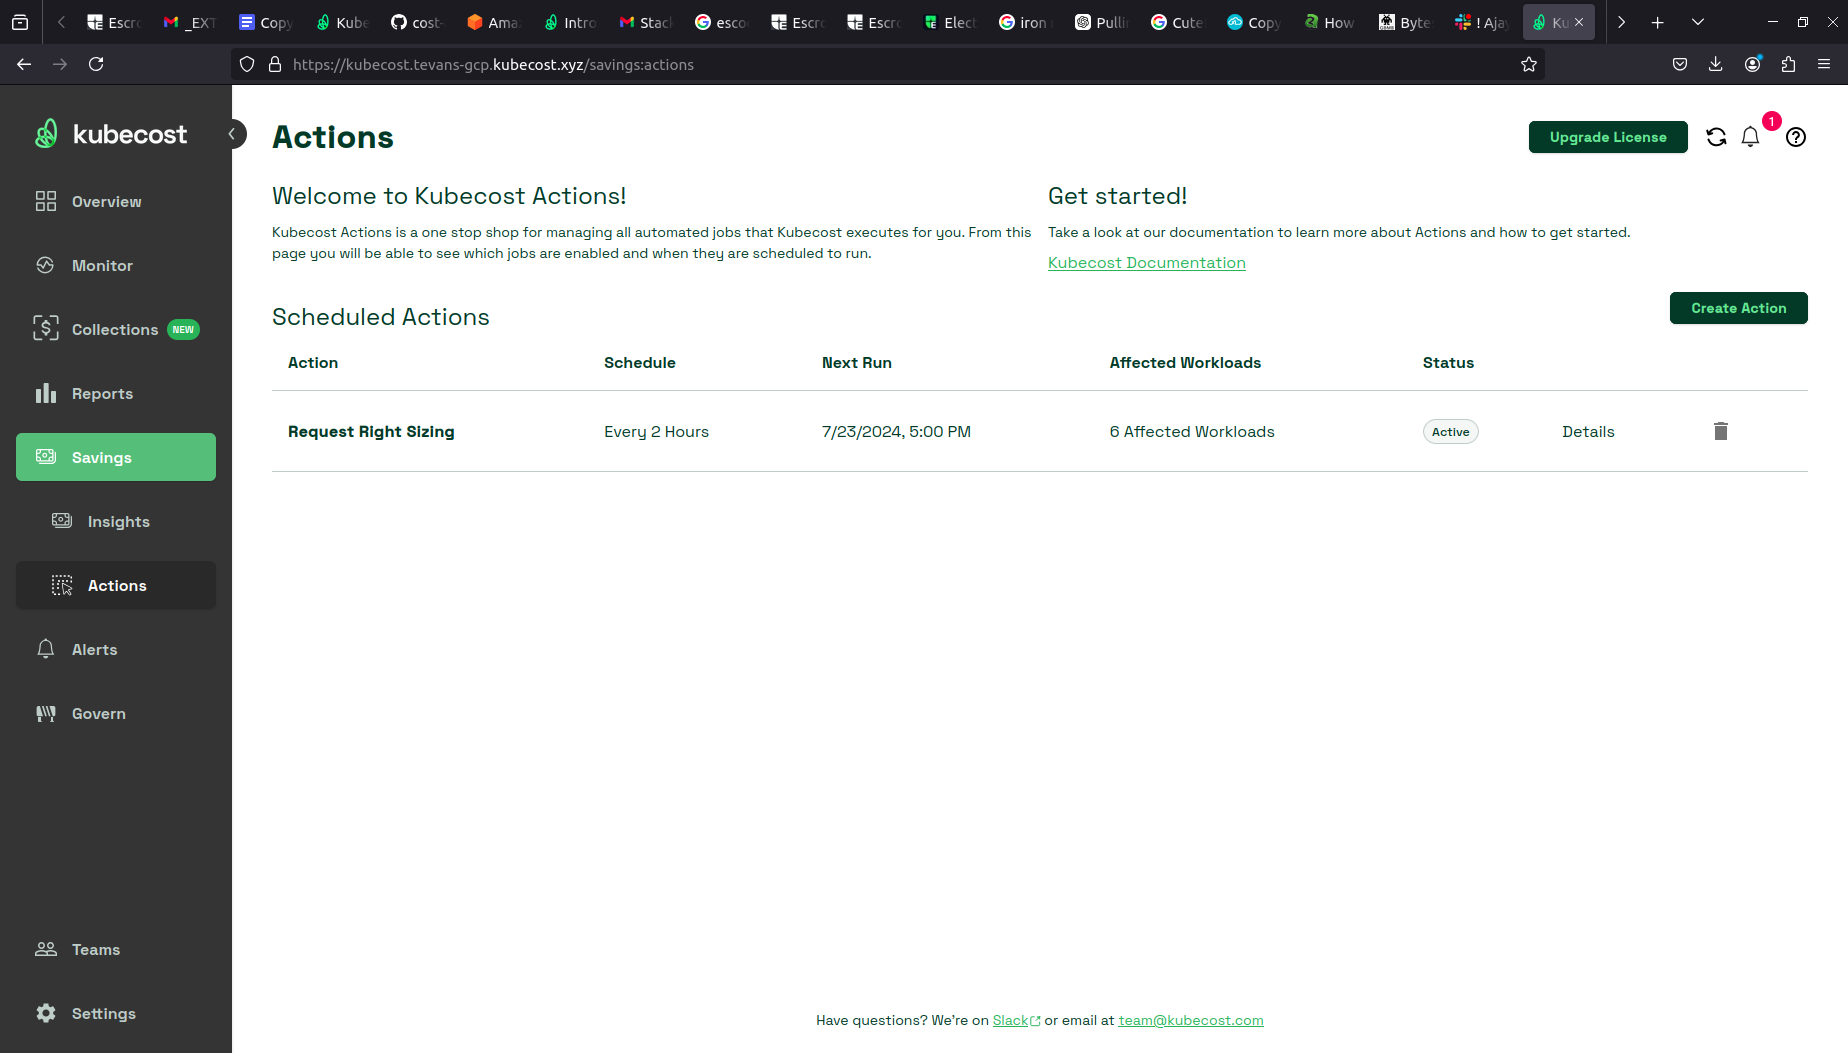
Figure 2 Actions
Forecasting and Anomaly Detection
New machine learning (ML)-based forecasting models use historical Kubernetes spend and other cloud spend data to provide accurate predictions. This allows teams to anticipate cost fluctuations and allocate resources efficiently. These models are trained on your cluster, using your spend data, and as always Kubecost collects no data from your cluster. You can access forecasting through Kubecost’s major monitoring dashboards Allocations, Assets, and the Cloud Cost Explorer by selecting from any future date ranges. Then, you can observe the projected future costs and your realized spend. The Kubecost Anomaly Detection Dashboard shows significant changes in your Kubernetes or cloud spend. This helps you detect unexpected cost increases faster. Learn more in the Kubecost Forecasting and Anomaly Detection documentation.
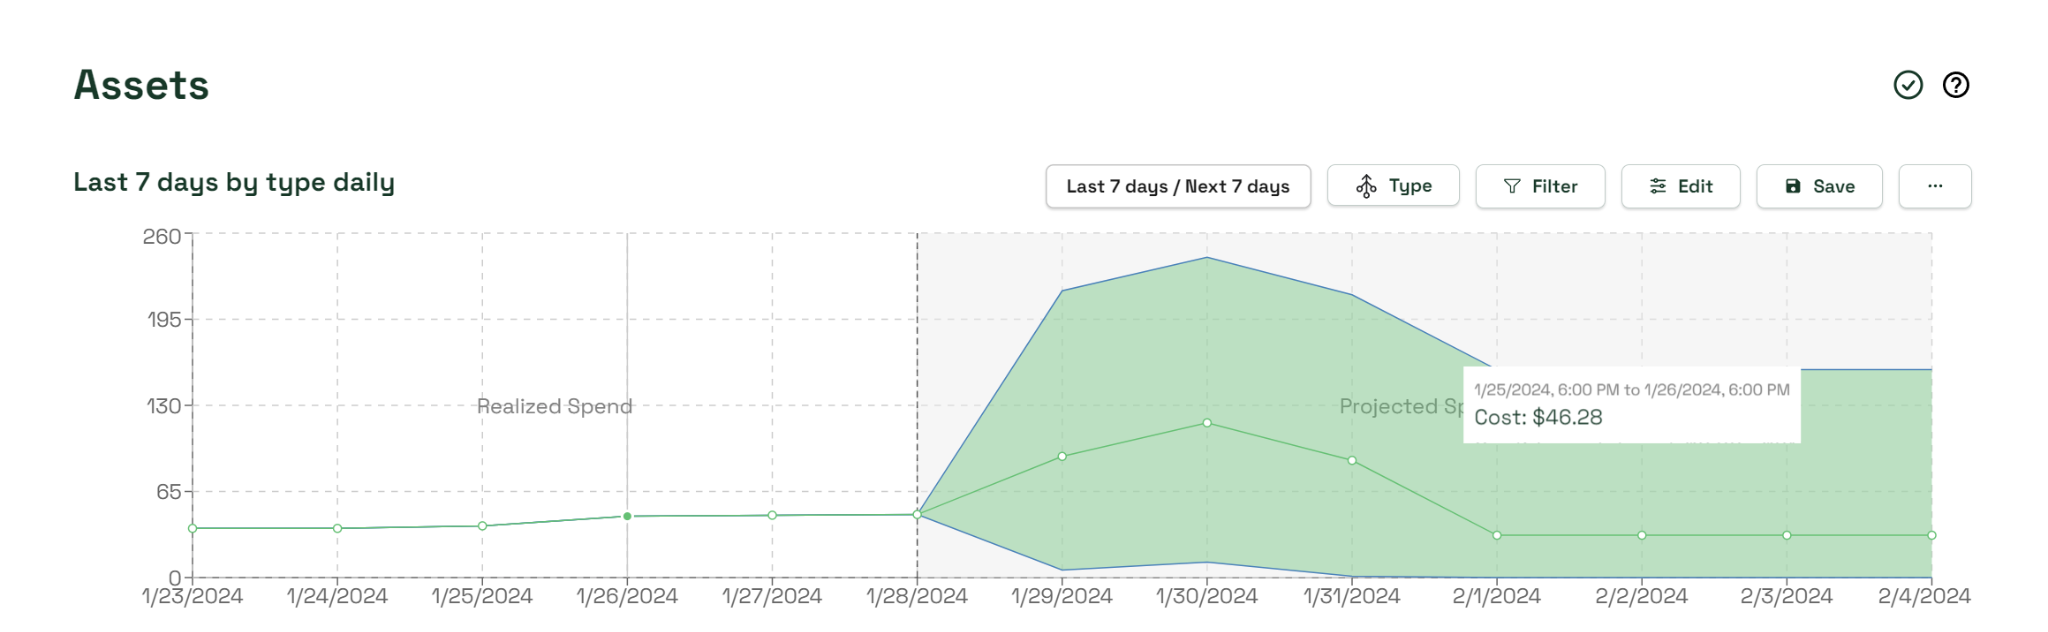
Figure 3 Forecasting and Anomaly Detection
100x performance improvement at scale
Kubecost 2.0 introduces a major upgrade with a new API backend, delivering a massive 100x performance improvement at scale, coupled with a 3x enhancement in resource efficiency. This means users can now experience significantly faster and more responsive interactions with both Kubecost APIs and UI, especially when dealing with large-scale Kubernetes environments. You can query over three years of historical data, which provides engineering and FinOps teams with a comprehensive view of resource usage trends, and enables more informed decision-making and long-term trend analysis.
Want to observe Kubecost 2.0 in action? Watch this episode of Containers from the Couch to learn more!
Installing Kubecost
Users can quickly deploy Kubecost for Amazon EKS cost monitoring from either Helm through Amazon Elastic Container Registry (Amazon ECR), as an Amazon EKS add-on, or from AWS Marketplace. You can also install Kubecost using the following steps.
- Install the following tools: Helm 3.9+, kubectl, and optionally eksctl and AWS Command Line Interface (AWS CLI).
- Access to an Amazon EKS cluster. To deploy one, read Get started with Amazon EKS.
- If your cluster is running Kubernetes version 1.23 or later, then you must have the Amazon Elastic Block Store (Amazon EBS) CSI driver installed on your cluster.
- If your cluster is version 1.30 or later, there is by default no longer a default StorageClass assigned. See the EKS 1.30 release notes for one of several alternatives.
Step 1: Install Kubecost on your Amazon EKS cluster
In your environment, run the following command from your terminal to install Kubecost on your existing Amazon EKS cluster
You can find the available versions of the Amazon EKS optimized Kubecost bundle here. We recommend finding and installing the latest available Kubecost cost analyzer chart version.
By default, the installation includes certain prerequisite software, such as Prometheus and kube-state-metrics. To customize your deployment (for example skipping these prerequisites if you already have them running in your cluster), you can find a list of available configuration options in the Helm configuration file.
Step 2: Generate Kubecost dashboard endpoint
After you install Kubecost using the Helm command in Step 1, it should take under two minutes to complete, and the data appears shortly after. You can run the following command to enable port-forwarding to expose the Kubecost dashboard:
Step 3: Access cost monitoring dashboard
On your web browser, go to http://localhost:9090 to access the dashboard.
You can now start monitoring your Amazon EKS cluster cost and efficiency. Depending on your organization’s requirements and set up, there are several options to expose Kubecost for on-going internal access. The following are a few examples that you can use for reference. We strongly suggest not exposing Kubecost for access outside the cluster without an authentication layer.
- Ingress Examples as a reference for using nginx ingress controller with basic authentication.
- Consider using the AWS Load Balancer Controller to expose Kubecost and use Amazon Cognito for authentication, authorization, and user management. We strongly suggest not exposing Kubecost for external access without an authentication mechanism. You can learn more about this in the post, How to use Application Load Balancer and Amazon Cognito to authenticate users for your Kubernetes web apps
Cleaning up
You can uninstall Kubecost from your cluster with the following command.
helm uninstall kubecost –-namespace kubecost
Kubecost is excited to release these new cost monitoring features in collaboration with AWS, which enables users to monitor and track the costs with Amazon EKS. You can learn more about how Kubecost can help you monitor and reduce your Kubernetes and cloud costs by visiting our website. If you need support, then you can submit a support request through Email. If you would like to learn more from the Kubecost team, contact them here.