Containers
Diving into Container Insights cost optimizations for Amazon EKS
Introduction
Amazon CloudWatch Container Insights allows you to collect, aggregate, and analyze metrics, logs, and traces for your container-based applications and infrastructure on AWS. Container Insights captures metrics for various resources, such as CPU, memory, disk, and network, along with diagnostic data like container restart failures, which enables you to efficiently isolate and resolve problems. The service also offers out-of-the-box metrics visualization capabilities through automatic dashboards.
Traditionally, the metrics catalog wasn’t customizable, which made it an all-or-nothing decision. This has now changed, and you can select the individual metrics that are relevant to your organization thanks to the AWS Container Insights Receiver, which is part of the AWS Distro for OpenTelemetry (ADOT), an AWS-provided distribution of the OpenTelemetry project. As discussed in the post Cost savings by customizing metrics sent by Container Insights in Amazon EKS, these advanced customization capabilities allow you to balance cost and visibility by arbitrarily sacrificing metrics.
This post is a practical end-to-end guide for customers who want to implement this approach at scale. We’ll see how to configure, deploy, consume, and investigate metrics in this context. In particular, we’ll see how an interactive cost calculator tool can facilitate the design of custom configurations, and how an AWS Cloud Development Kit (AWS CDK) application can promptly generate on-demand, log-based dashboards to significantly mitigate the cost versus visibility trade-off.
You can find the both the cost calculator and the AWS CDK application on GitHub.
Please note that the cost figures presented in this post, as well as the projected prices provided by the cost calculator, are estimates and shouldn’t be confused with final, guaranteed prices.
Solution overview
To understand the solution, we first need to take a closer look at Container Insights and see how the metrics are collected, what the pricing model is, and what it means, functionally, to disable metrics.
Metrics collection
With the default configuration, the metric data is transmitted as performance log events using the Embedded Metric Format (EMF), but only partially ingested as actual Amazon CloudWatch metrics. While this approach requires an additional visualization service, capable of consuming plain log events to make use of the non-ingested data (such as Amazon CloudWatch’s Logs Insights), it helps to control costs by limiting metrics ingestion related fees.

Figure 1: Container Insights metrics ingestion pipeline using the CloudWatch agent.
ADOT’s advanced customization capabilities can maximize cost savings by further limiting the amount of raw data transferred and/or promoted as metric data. Specific EMF log events can be filtered out using ADOT’s filter processor, and the raw data to promote as metric data can be selected using ADOT’s EMF exporter.

Figure 2: Container Insights metrics ingestion pipeline using the ADOT collector.
Pricing model
The total cost of ownership of a Container Insights setup can be broken down into:
- Logs ingestion cost (per GB ingested)
- Logs storage cost (per GB archived)*
- Metrics ingestion cost (per metric ingested)
*We won’t focus on optimizing logs storage costs as part of this post. However, some of the techniques presented are intended to reduce the total amount of log data transferred, which also has a positive impact on storage costs.

Figure 3: Container Insights ingestion costs.
When looking at the relationship between logs and metrics ingestion costs, we must consider that with the current Container Insights design, pod metrics are aggregated by pod type and scaling pods horizontally doesn’t directly increase the number of metrics ingested. The metrics count still grows indirectly due to the additional nodes required to accommodate the replicas, but at a much slower rate. On the other hand, as individual pods generate dedicated log events, the amount of EMF data transferred grows linearly with the total number of pods.
 Figure 4: Logs Size and Metrics Count over pod types per total pods ratio.*

Figure 5: Monthly cost over pod types per total pods ratio.*
*Estimates based on a cluster with 4 namespaces, 10 pod types, 1.05 containers per pod and 2 services. The data plane has a minimum of 3 nodes and scales at a rate of 100 pods per node. For instance, if we take the 1:200 ratio, the cluster will have a total of 2000 pods, 2100 containers, and 20 nodes.
To effectively optimize costs, we need to target the relevant cost-generating component in relation to the cluster’s usage patterns. We’ll take a closer look at this later, as part of the Walkthrough within the Configure section.
Cost versus visibility trade-off
From a cloud economics perspective, the value proposition of reducing the amount of ingested data is obvious. But what are the functional implications?
We have seen how ADOT enhances the flexibility of the metrics collection process by providing us with two main customization capabilities:
- Log events filtering
- Custom metrics selection
Both of these levers can reduce the amount of ingested data but with different functional impacts.
Log events filtering
This approach gives us the greatest cost savings but also the greatest functional impact. Data is filtered out as early as possible in the metrics collection pipeline, before the EMF exporter, and there’s no way we can consume it at a later stage throughout logs or metrics.
Custom metrics selection
Unlike log events filtering, if we customize the metrics selection, we don’t give up on the ability to consume the full data set — the raw data remains available for log-based analysis.
However, a fundamental difference between metrics and logs is that the former proactively evaluate predictable states of a system, while the latter are essential for analyzing unpredictable states in a rather reactive manner. As a result, we cannot trigger Amazon CloudWatch alarms from raw performance log events, and this is probably the single most important limitation to be aware of.
Nevertheless, we can imagine a two-speed approach where the data we need to evaluate on a regular basis — and based on which we need to trigger alarms — would continue to be ingested as metrics and everything else would sit in logs for lazy, timely consumption.
In other words, it’s all about shifting the cost from ingestion to consumption, for data that we know in advance we wouldn’t use under normal circumstances and for which, as a consequence, it is convenient to adopt a lazy fruition model rather than an eager one.
Summary
Customers looking to deploy such cost optimization techniques at scale typically struggle with how to design custom configurations and how to make efficient use of raw log events data.
For these reasons we’ll use a cost calculator tool to support the design of custom configurations and an AWS CDK application to industrialize the harvesting of raw log data and materialize ready-to-use dashboards in a standardized and time-efficient manner.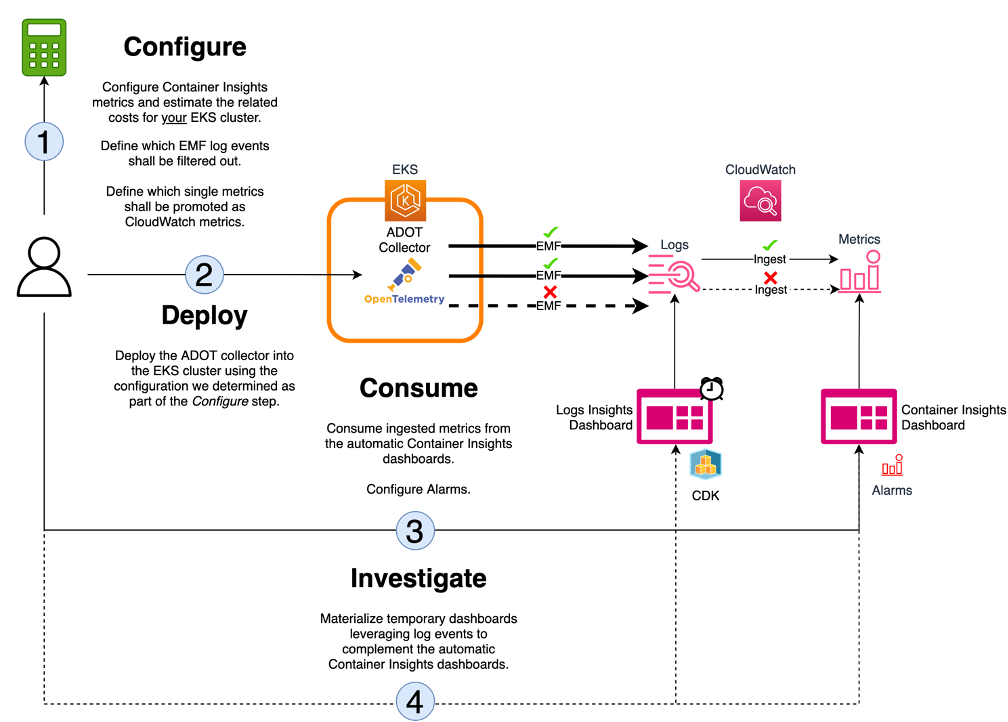
Figure 6: Solution’s summary.
Walkthrough
Configure
There is no one-size-fits-all approach when configuring Container Insights for your application.
Determining which metrics are relevant to your organization and how exactly you should balance cost and visibility depends on several factors, including, the underlying technology used, the business domain, the criticality of the application and its service level agreements, as well as the nature of the target environment (i.e., production versus non-production).
We have seen how, within the Container Insights pricing model, the top cost-generating component can vary depending on the ratio of pod types to total pods in the cluster. When the number of pods per pod type is low, the total cost of ownership is driven by the metrics ingestion component, but when the number of pods per pod type is high, the logs ingestion component takes over.
We have also seen how disabling metrics has a lower functional impact than filtering out raw log events.
A well-architected custom configuration addresses organizational specific needs, maximizes cost savings, and mitigates functional impact.
If we consider the following sample configurations:
- Configuration 1: This configuration relies on ADOT’s custom metrics selection, where metric dimensions with high cardinality (PodName , Service , NodeName ) are disabled. Data belonging to these metric dimensions will be available for consumption in an on-demand fashion through log-based dashboards.
- Configuration 2: This configuration relies on ADOT’s log events filtering, where EMF log events from metric types which aren’t displayed within the Container Insights automatic dashboards (Container, ContainerFS, PodNet, NodeNet, NodeDiskIO) are excluded. Data belonging to these metric types won’t be available for consumption.
- Configuration 3: This configuration is the combination of Configuration 1 and Configuration 2.
How do they perform for different ratios of pod types per total pods?

Figure 7: Custom configurations monthly cost for low numbers of pods per pod type.*
Configuration 1 is all about optimizing costs by reducing the number of metrics, and at a certain threshold of pods per pod type, it won’t be effective as the top cost-generating component shifts from metrics to logs ingestion.

Figure 8: Custom configurations monthly cost for high numbers of pods per pod type.*
Addressing the metrics ingestion cost component becomes irrelevant as we further increase the total number of pods per pod type. We may prefer Configuration 2 over Configuration 3, because it keeps things simple by solely addressing logs ingestion related costs.
When the total number of pods per type is very high, trying to reduce costs by disabling metrics favoring a log-based, on-demand consumption model, can paradoxically have the opposite effect. Querying large amounts of raw data through Logs Insights can end up being more expensive than ingesting the aggregated metric in the first place.

Figure 9: Custom configurations monthly cost over pod types per total pods ratio.*
*Estimates based on a cluster with 4 namespaces, 10 pod types, 1.05 containers per Pod and 2 services. The data plane has a minimum of 3 nodes and scales at a rate of 100 pods per node.
In summary, cluster usage patterns are central to design the appropriate custom configuration and to effectively reduce costs. Deciding which configuration to apply where is not trivial, and the Container Insights calculator can assist you in this decision-making process by providing a monthly cost estimate tailored to your cluster’s specifications.
Container Insights calculator
The calculator is a Microsoft Excel spreadsheet that enables you to enter basic information about your cluster, and to select the Container Insights metrics you are interested in to provide you with a monthly cost estimate.
The spreadsheet has a single worksheet where the cells that require your input have a gold background while the cells with a blue background represent the calculated logs and metrics ingestion cost estimates.
To get started, open the Container Insights calculator using Microsoft Office and enter the following information:
- Cell B4: The total number of nodes that your cluster has.
- Cell B5: The total number of namespaces that your cluster has.
- Cell B6: The total number of pod types that your cluster has (within all namespaces).
Please note that this figure isn’t intended to include pod replicas. In contrast, nb of pods per pod types (e.g., cell B8) is there to account for replicas. This distinction is necessary because, as mentioned earlier, pod metrics are aggregated against the PodName dimension, the value of which doesn’t include the ReplicaSet.
For example, if we look at metrics for pod cloudwatch-agent-statsd-df44f855f-ts4q2, its PodName dimension would be set to cloudwatch-agent-statsd, which doesn’t include the ReplicaSet suffix -df44f855f-ts4q2. In other words, multiple replicas of a pod would not increase the pod metric cardinality. - Cell B7: A coefficient to determine, on average, how many containers you have per pod.
- Cell B8: A coefficient to determine, on average, how many replica you have per pod type. When multiplying B6 with B8 we should obtain the total number of pods running into the cluster (within all namespaces)
- Cell B9: The total number of services that your cluster has (within all namespaces).

Figure 10: Cluster specifications input fields
You can then move down to the Metrics table, which is where you customize the Container Insights configuration using both the EMF log events filtering and the custom Amazon CloudWatch metric selection techniques.
Single metrics are represented by the table rows with their name found in the Metric column (column C). The Type column (column A) defines the metric type and the EMF column (column B) can either be set to Yes or No to activate or deactivate the log events belonging to that given metric type, respectively.

Figure 11: Metrics table, log events customization.
The metric dimensions associated with each individual metric are represented by the table columns D to H. Each cell in this range can either be set to Yes or No to activate or deactivate a specific dimension for a given metric, respectively.
You cannot customize metrics and their associated dimensions if they belong to a metric type that has been disabled from an EMF perspective. In this case, the dimension cells would appear grayed out.

Figure 12: Metrics table, dimensions customization.
To highlight the default Container Insights configuration, the worksheet uses a dark green background (or dark red if the metric/dimension combination has been disabled). This can be useful to compare how much a custom configuration deviated from the default configuration.
As you customize the metrics configuration, the tool estimates the monthly logs and metrics ingestion costs. These figures are materialized within cells B35 and B36, respectively.

Figure 13: Monthly cost estimates with the default configuration.
For demonstration purposes, we’ll apply the following changes to the default configuration:
- Disable Pod and Service dimensions for all metrics (dimension columns F and G will be set to No for each and every metric).
- Disable Node dimension for the following metrics:
- node_cpu_reserved_capacity (set H146 to No)
- node_memory_reserved_capacity (set H161 to No)
- node_network_total_bytes (set H171 to No)
- node_number_of_running_containers (set H176 to No)
- Filter out EMF log events for the following metric types:
- ContainerFS (set B45 to No)
- PodNet (set B72 to No)
- NodeNet (set B119 to No)
- NodeDiskIO (set B128 to No )
Such a configuration reduces logs and metrics ingestion costs by 55% (from $113,75 to $51,51) and 63% (from $58,80 to $21,60), respectively.

Figure 14: Monthly cost estimates with the custom configuration.
To compensate for the metrics that we disabled, we should take into account the extra Logs Insights’ investigation costs.
According to the calculator estimates, with this configuration, our cluster produces 103,01 GB log events per month. If we take a log-based dashboard spanning a 12 hours window that contains 20 widgets (one per metric), then each widget would scan approximately 1,71 GB of data — considering an hourly log size of 0,143 GB (103,01 GB / 30 days / 24 hours) and the 12 hours window (0,143 GB * 12 hours) — that, at a cost of $0,0063 per GB of data scanned, gives us a total cost of $0,21 per dashboard view (20 widgets * 1,71 GB * $0,0063).
Assuming we investigate the cluster 10 times a month, and that as part of each investigation we load the dashboard 10 times, we would end up with approximately $21 of monthly investigation related costs ($0,21 dashboard view cost * 10 investigations * 10 views).
This gives us a total monthly cost of ownership of $94,11 ($73,11 Container Insights cost + $21 investigation cost) which means 45% overall cost savings when compared with the default Container Insights configuration (from $172,55 to $94,11).
Deploy
Once we are happy with a given configuration, it’s time to generate the associated open telemetry collector configuration and push it into our Amazon Elastic Kubernetes Service (Amazon EKS) cluster.
Prerequisites
- Weaveworks eksctl
- AWS Command Line Interface (AWS CLI)2.x
- kubectl
- An Amazon EKS cluster with an Amazon Elastic Compute Cloud (Amazon EC2)-backed data plane
- Helm 3
- A python virtual environment, based on python version 3.8 or higher
Detailed instructions on how to install the necessary prerequisites are to be found in the README file of the project.
Install ADOT Collector for Container Insights
- Enable AWS Identity and Access Management (AWS IAM) OpenID Connect provider
- Create an AWS IAM role and configure IAM roles for service accounts for the to-be-installed ADOT collector
- Install the adoc-exporter-for-eks-on-ec2 Helm chart, setting Amazon CloudWatch as a recipient for the collected metrics
- Check that the ADOT collector is running into the cluster

- After a few minutes you should start seeing data populating the Container Insights automatic dashboards within the Amazon CloudWatch Console.

Figure 15: Container Insights automatic dashboards.
Customize the ADOT configuration
- Generate the ADOT configuration from the Container Insights calculator file that we finalized within the Configure section. Make sure that you did save any changes in the calculator file before moving forward.
- Upgrade the adot-conf config map and restart the daemonset
- Check that the ADOT collector is running into the cluster. Make sure the DaemonSet has been restarted verifying its age.

Consume
The Container Insights metrics are available for visualization via the automatic dashboards within the Amazon CloudWatch Console. If you have changed the configuration to disable some of the default metrics, then the associated widgets may be missing data points.
Based on the incoming data that keeps being ingested as metrics, you can eventually configure Amazon CloudWatch Alarms.
In our example — where we fully disabled the PodName and the Service dimensions and partially disabled the NodeName dimension — we expect pod, service, and node–level data points to stop flowing.

Figure 16: Container Insights nodes automatic dashboards after applying the custom configuration.
Nevertheless, data points aggregated at cluster or namespace–level would still be available.

Figure 17: Container Insights cluster automatic dashboard after applying the custom configuration.
PodName and Service dimensions have a high cardinality, and disabling these specific dimensions significantly reduces the overall metrics ingestion cost. On the other hand, we’ll have to live with alarms based on coarse-grained figures aggregated at cluster and namespace-level.
However, with the exception of the metric types that have been filtered out before being actually transmitted to Amazon CloudWatch — ContainerFS, PodNet, NodeNet, and NodeDiskIO — there is nothing stopping us from visualizing service, pod, node, or even container–level data from the raw performance log events. This is what we will cover in the Investigate section.
Investigate
In this section, I’ll use AWS CDK to efficiently build full-blown investigation dashboards based on Container Insights raw data.
The users of AWS CDK application don’t require any knowledge of the Logs Insights query language, which makes it easier to adopt the solution at scale.
Prerequisites
On top of the prerequisites from the Deploy section, you’ll need:
- AWS CDK 2.x Toolkit
- Docker
Detailed instructions on how to install the necessary prerequisites are to be found in the README file of the project.
Configure the investigation dashboards
Before we materialize the dashboards into the account, we need to decide how long we want them to be available for consumption, what time frame they should use, and what specific content they should display.
The dashboard_configuration.yaml file, which is found at the root of the cloned repository, is where you need to configure these aspects.
Open the file for editing and make sure you:
- Set the name of the cluster you want to collect metrics from in the clusterName
- Define how long shall the ephemeral dashboards live before self-destruction in the timeToLiveInMinutes
- Provide a valid investigationWindow — Container Insights performance log events should be present in the log group within the specified time frame.
- Within the contents section, chose the to-be-displayed metrics from the full Container Insights metrics catalog. Note that for pod and container dashboards, you must specify the namespaces to cover in the investigation. Separate dashboards will be created for each namespace.
The sample dashboard configuration provided above is a great complement to the custom Container Insights configuration we designed in the Configure section. It includes the pod and node-level metrics we disabled, and reveals valuable container–level information that we didn’t filter out in advance from an EMF perspective.
The AWS CDK uses the investigation window information to run preliminary lookup queries based on which the final queries — that the dashboard widgets will ultimately use to visualize the metrics — will be defined. As a result, while it is possible to navigate through the dashboards beyond the boundaries of the original investigation window, the data may not be comprehensive.
At any point in time, if you realize that the dashboards are misconfigured, you can update their configuration and redeploy the AWS CDK application.
Create the investigation dashboards
- Install the python dependencies
- Deploy the AWS CDK application
- Open the generated dashboards by clicking on the links coming from the stack outputs, which should appear in blue at the end of the AWS CDK deploy command

Figure 18: The links to the newly generated log-based dashboards as they appear in the CDK deploy output.

Figure 19: A log-based dashboard displaying container-level data.

Figure 20: A log-based dashboard displaying pod-level data.
Cleaning up
The dashboards self-destruct after the provided time to live. Hence, there’s nothing to clean up.
You may want to uninstall the AWS Distro for OpenTelemetry collector from the cluster to stop producing Container Insights metrics as a whole:
Conclusion
In this post, I showed you how to configure, deploy, consume, and investigate Container Insights metrics to significantly optimize the associated ownership costs.
In the case study presented, we achieved a 45% reduction of the monthly costs (from $172,55 to $94,11) for an Amazon EKS cluster with 4 namespaces, 500 pods (10 pod types), 525 containers, 2 services, and 5 nodes.
To achieve these cost benefits, we had to reduce the overall amount of observability data ingested and change the way we consume some of it, but it’s all about making a conscious, balanced decision, based on the specific business needs of our application.
To learn more about ADOT, read the official documentation and check out the aws-observability organization on GitHub.
Feel free to submit enhancements to the sample in the source repository or provide feedback in the comments.