AWS Developer Tools Blog
Following serverless best practices with AWS Chalice and Lambda Powertools
AWS Chalice lets you quickly create serverless applications in Python. It has a number of built-in features such as integration with AWS Lambda event sources as well as support for different deployment systems such as AWS SAM and Terraform. There are scenarios where you may want to extend the behavior of Chalice and customize how it processes requests. In version 1.20.0 of Chalice, we’ve added support for middleware that allows you to extend the functionality of the Lambda event handlers. Middleware also allows you to include functionality that’s provided in separate Python packages. In this post, we’ll look at how we can combine this new middleware functionality in Chalice with other Python packages to implement observability best practices in our serverless application.
Example
To demonstrate this, we’ll create a sample app, and enhance it with custom behavior that will help us troubleshoot errors. First we’ll need to create a new development environment and create a new Chalice application. We’re using Python 3.7 for our application.
$ python3 -m venv /tmp/venv37
$ . /tmp/venv37/bin/activate
$ pip install chalice
$ chalice new-project middleware-demo
$ cd middleware-demo
We want to be able to trace and debug our application, and the Serverless Lens for the Well Architected Framework suggests several best practices for observability. To help implement these observability best practices, we’ll use AWS Lambda Powertools, which is a suite of utilities for AWS Lambda that makes tracing, structured logging, custom metrics, and other best practices easier. We’ll then use Chalice middleware to automatically apply these utilities to all our Lambda functions in our application.
To use these utilities we’ll install the aws_lambda_powertools package and add it to our requirements.txt file.
Next, we’ll install the AWS Lambda Powertools package so we can use it in our Chalice app. We’ll also install the requests package so we can make HTTP requests in our view functions.
$ pip install aws_lambda_powertools requests
$ pip freeze | grep aws_lambda_powertools >> requirements.txt
$ pip freeze | grep requests >> requirements.txt
Below is our application code for our app.py file. It creates a REST API that provides two routes, one for the root URL /, and a /proxy/http route that will make an HTTP request to a backend service. We’ll show the entire app.py file first before dissecting each part.
import random
from chalice import Chalice
from chalice.app import ConvertToMiddleware

import requests
from aws_lambda_powertools import Logger
from aws_lambda_powertools import Tracer


BASE_URL = 'https://httpbin.org'

app = Chalice(app_name='middleware-demo')
logger = Logger()
tracer = Tracer()
session = requests.Session()

app.register_middleware(ConvertToMiddleware(logger.inject_lambda_context))
app.register_middleware(ConvertToMiddleware(tracer.capture_lambda_handler))


@app.middleware('http')
def inject_route_info(event, get_response):
    logger.structure_logs(append=True, request_path=event.path)
    return get_response(event)


@app.route('/')
def index():
    return {'hello': 'world'}


@app.route('/proxy/http')
def greeting():
    if random.random() < 0.1:
        path = '/status/500'
    else:
        path = '/status/200'
    response = session.get(f'{BASE_URL}/{path}')
    logger.debug({'statusCode': response.status_code})
    response.raise_for_status()
    return {'hello': 'world'}
The first thing we need to do is import the appropriate packages.
from chalice import Chalice
from chalice.app import ConvertToMiddleware

import requests
from aws_lambda_powertools import Logger
from aws_lambda_powertools import Tracer
In addition to importing the Logger and Tracer classes from aws_lambda_powertools, we’ll also import a ConvertToMiddleware class, which is a new feature in Chalice v1.20.0. This allows us to convert any external Lambda decorator as Chalice middleware that will automatically be applied to all your Lambda functions in your app.
Next, we’re creating the objects we’re going to use in our application. This includes the Chalice app object, the Lambda Powertools objects, and a session of our HTTP client that we’ll use in one of our views.
app = Chalice(app_name='middleware-demo')
logger = Logger()
tracer = Tracer()
session = requests.Session()
Following the instantiation of these classes, we’ll next register middleware for our application. Here we show two different ways of registering middleware, we can either use the app.register_middleware() method, or we can decorate a function with @app.middleware(). The former API is useful when we’re registering pre-existing functions or methods that you want to add to a Chalice application and the latter is useful if you’re writing the middleware as part of your application. We can also provide additional keyword arguments to the Lambda Powertools functions to customize their behavior, for example ConvertToMiddleware(tracer.capture_lambda_handler(capture_response=False)).
app.register_middleware(ConvertToMiddleware(logger.inject_lambda_context))
app.register_middleware(ConvertToMiddleware(tracer.capture_lambda_handler))


@app.middleware('http')
def inject_route_info(event, get_response):
    logger.structure_logs(append=True, request_path=event.path)
    return get_response(event)
The inject_route_info middleware is registered to any Lambda functions associated with our HTTP API, and will automatically be invoked before every view function is called. It will update our structured logger to automatically add the request path as a key. We’ll see this in action when we test out our application. If you want to write your own middleware, you must adhere to these requirements:
- The decorated object must be a callable that accepts two parameters, an
event, and aget_responsefunction. Theeventtype will depend on what type of handlers the middleware has been registered for (see “Registering Middleware” for details). - Must return a response. This will be the response that gets returned back to the caller.
- In order to invoke the next middleware in the chain and eventually call the actual Lambda handler, it must invoke
get_response(event). - Middleware can short-circuit the request by returning its own response. It does not have to invoke
get_response(event)if not needed. The response type should match the response type of the underlying Lambda handler.
Our inject_route_info is simple, it’s not short-circuiting the request or modifying the response. If you’re curious on how to do this, our documentation page has several examples. Finally we have our view functions. One function returns a canned “hello world” response, and another will make an HTTP request that will return a 500 error response 10% of the time. This will allow us to see how we can trace errors in our application.
@app.route('/')
def index():
    return {'hello': 'world'}


@app.route('/proxy/http')
def greeting():
    if random.random() < 0.1:
        path = '/status/500'
    else:
        path = '/status/200'
    response = session.get(f'{BASE_URL}/{path}')
    logger.debug({'statusCode': response.status_code})
    response.raise_for_status()
    return {'hello': 'world'}
Before we can deploy our code, we need to ensure our application is configured appropriately. To do this, update your .chalice/config.json file to enable AWS X-Ray as well as set the service name for your app by creating a POWERTOOLS_SERVICE_NAME environment variable. Note that the xray configuration option is a new feature added in v1.20.0 of Chalice.
{
  "version": "2.0",
  "app_name": "middleware-demo",
  "xray": true,
  "environment_variables": {
    "POWERTOOLS_SERVICE_NAME": "middleware-demo"
  },
  "stages": {
    "dev": {
      "api_gateway_stage": "api"
    }
  }
}
Deploying
To deploy our application, we’ll run the chalice deploy command.
$ chalice deploy
Creating deployment package.
Creating IAM role: middleware-demo-dev
Creating lambda function: middleware-demo-dev
Creating Rest API
Resources deployed:
  - Lambda ARN: arn:aws:lambda:us-west-2:12345:function:middleware-demo-dev
  - Rest API URL: https://rest-api-id.execute-api.us-west-2.amazonaws.com/api/
We’re now ready to test our application.
Testing
We’ll use the httpie utility (pip install httpie) to test our REST API, but you can use any HTTP client you want. We’ll make several requests to our root URL / and several requests to the /proxy/http URL. We’ll then examine the log messages and traces generated from these requests.
$ http https://rest-api-id.execute-api.us-west-2.amazonaws.com/api/
# Make 100 requests to /proxy/http
$ for i in {1..100}
    do http https://rest-api-id.execute-api.us-west-2.amazonaws.com/api/proxy/http
done
First, we’ll look at the data generated from the Lambda Powertools’ Tracer object. In the X-Ray console, we can see the service graph generated from our requests. In looking at the trace overview, we see that we had 94 successful requests, and 6 faults, which roughly corresponds to our randomized 10% error rate from /proxy/http.


We can also look at the details of a single trace and see where the error is coming from. From the trace map below, we can see that the error originates from receiving a status code of 500 when we make an HTTP requests to a downstream service. This makes it easy to troubleshoot any issues we have with our application by simply adding the Lambda Powertools tracer as Chalice middleware in our application. By doing so we get this tracing functionality out of the box.


Now we can look at the structured logging integration we added in our application by using the Lambda Powertools structured logger. The logger.inject_lambda_context wrapper will also convert any log messages generated through the python standard logger to JSON formatted payloads. We can use this to our advantage by looking for any log messages that the Chalice framework generated that contain exception data. Specifically, we’ll use Amazon CloudWatch Logs Insight to query for any log message with an exception key present in the JSON payload of the log message.
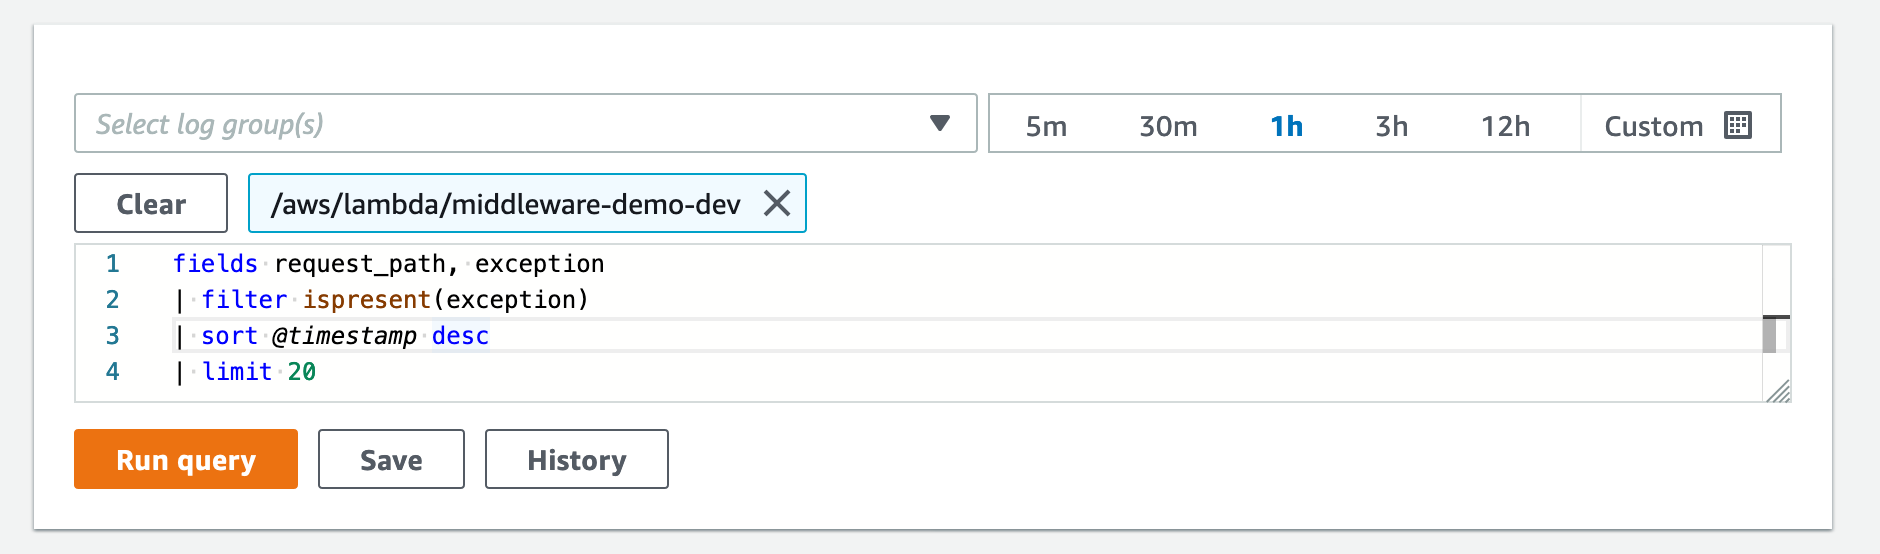

We can see from the output above an example of what this data looks like. We can see that this log message was associated with the request path of /proxy/http which was injected with our inject_route_info middleware we added to our app. We can also see the specific traceback from the exception that was raised from our view function and confirm that this exception was due to receiving a 500 Server Error from our downstream service.
Next Steps
We’ve looked at how we can use the new middleware and X-Ray integration in Chalice v1.20.0 to implement observability best practices in our application. We’ve only covered a small example of what’s possible with this new functionality. Here’s a few other things you can explore from here.
- Emit custom metrics using the Lambda Powertools Metrics utility. This allows you to asynchronously create metrics by logging to a standard output following Amazon CloudWatch Embedded Metric Format (EMF).
- Add additional Lambda event handlers to the sample application. The middleware we’ve added will automatically be applied without any additional work needed from you.
- Write your own custom middleware that integrates with other Lambda event handlers besides
httpevents. - Create reusable middleware components as separate python packages that other people can use through
app.register_middleware. - Create a suite of shared functionality by creating Blueprints that contain middleware that can be embedded into Chalice applications.
Documentation for middleware is available in our topic guide and our API reference. We encourage you to try out this new functionality and let us know what you think!