AWS for Industries
An AI-driven dashboard for life sciences laboratories
In this post, we present how scientific researchers can implement AI-driven solutions that improve day-to-day lab productivity and accelerate scientific discovery. We discuss some of the scientific and data challenges to this space as a whole and how AWS solutions can be the foundation for greater automation and central data governance across life science enterprises. We also provide a solution architecture with this post to help labs get started.
At the heart of research and development (R&D) organizations are researchers who are focused on running experiments and generating high quality data. That data is the fuel for exploratory early research, for technology development, and for progressing those discoveries through cross-functional development and eventually into candidates for clinical trials.
But in some unintended ways, researchers can be hindered by their own data. For example, manual data engineering tasks occupy an outsized amount of researcher bandwidth, taking their time away from innovation. The job of carefully combining data sources to harmonize datasets creates bottlenecks and slows the ability to conduct data science and get full value from the data. When software systems are disconnected from one another, it can detract from efficient coordination of people, information, and work. And when it’s hard to aggregate and securely share datasets, collaboration is slowed. Although these challenges can affect R&D groups differently—because organizations have varying levels of IT infrastructure maturity, application modernity, and personnel to support them—there are common patterns for data usage in the life sciences. These lend an opportunity for a harmonized, simplified platform approach.
One common activity in research is troubleshooting experiments—finding sources of error such as bad reagents, equipment issues, and erroneous steps in a protocol. Another activity is optimizing lab protocols—for example, optimizing time, temperature, concentration, and reagents to improve chemical yield, assay signal-to-noise, or molecular purity. A third important activity is collaboration, which requires making data findable and accessible by others—for example, a “gold standard” dataset being shared with a collaborator.
What’s stopping labs from fully automating these activities today? These activities often require many data engineering steps that can be time-consuming: file transfer, uncovering the structure of files, data processing, data filtering, statistical analysis, and machine learning model building. Collaboration requires other tasks including data cataloging and access controls. Scientists are looking for tools to make this possible, without learning new systems and without a great deal of hassle.
In this post, we present how AWS can be used to create automated, AI-powered tools for the laboratory for troubleshooting, protocol optimization, and collaboration. We provide a solution architecture to help users get started, and that can be expanded upon in an overall digital lab strategy. This solution can be added into an existing lab software ecosystem, or it can be used in lab setting up their data strategy for the first time. This is a serverless architecture, meaning that this framework can be set up and maintained with minimal efforts from an IT perspective. We use the example of chemical library optimization in a high throughput screening lab, but it can be applied to many settings in the life sciences including assay development, hit-to-lead optimization, preclinical, and large molecular characterization. Taken together, this illustrates how digital lab solutions can accelerate the scientific process and improve productivity.
Solution Benefits
We take a user-centered approach, focusing on four personas within the R&D environment: the scientist, the data scientist, the data analyst, and the IT administrator. This solution delivers several major benefits to these users:
- Operational and troubleshooting insights for the scientist. An interactive dashboard that provides an operational summary and detailed views of the experiments in a lab and notifies lab members of important actions to take
- AI-based recommendations for the lab scientist and data scientist. Machine learning algorithms on the back end of the dashboard to infuse detailed insights, pattern recognition, and recommendations to help the lab optimize its experiments (for example, “critical reagents,” “recommended next experiment”)
- Automated data pipelines for the data analyst. Data processing transformations that are built with or without the use of code, that are reusable within a library for the lab, and that can be deployed in a highly scalable cloud architecture
- Central data discovery for the IT administrator. Automated data cataloging and metadata generation, to keep track of the structure and contents of data, regardless of file type and schema (experimental data, databases), and system source (electronic lab notebooks [ELNs], laboratory information systems [LIMS], or other databases)
- Governance for the IT administrator. Simple creation of a data lake and convenient management of access policies based on roles or tags, which can be specified down to the individual data element (row and column permissions)
Scientist User Experience
Scientists are looking to streamline their research and not looking for more tools to have to learn. That’s why the front-end of this solution uses Amazon QuickSight, a reporting tool that makes it easy to create, distribute, and conduct analyses using visual dashboards. This includes the type of filtering, pivoting, and normalizing data that many scientists are used to in Excel. But this also includes automation such as data refreshes to bring in your latest data from your instruments, LIMS, and ELN. And this encompasses alerts that will reach out to you by email if an event is observed. Did your last results fall below a quality control (QC) threshold? You can create an alert to notify you. Does your experiment plan clash with schedule of instrument availability? Get notified. Within the dashboard you can drill down into your experimental data to explore patterns and trends.
In this solution we assume the following set up for the scientist. A chemistry lab routinely carries out experiments by analyzing samples in a 384-well format. After analysis (for example, by high performance liquid chromatography and mass spectrometry), this results in comma-separated value (.csv) file that contains a key metric—in this case, reaction yield. The experimental protocols are documented in an ELN that contains experimental details—in this case, project number, protocol steps, and other reagent information.
The scientist begins by looking at the high-level result from their experimental runs to look at the average reaction yield of their protocols over a period of four months (Figure 1). You can quickly identify changes in the reaction yield compared to the 7-day average and dig deeper to look for root causes (bar chart). The dashboard shows sources of quality issues by comparing reaction yields to the composition of reagents in the reaction protocols, to see whether low yields are associated with specific reagents (area chart). We also visualize the reaction yields across our plate layouts (heat map). This shows whether low yields are associated with certain regions of the plate. In this way, with a quick visual glance, we can understand whether our yield is affected by the chemical reagents or by plate loading.

Figure 1. Amazon QuickSight dashboards can provide labs with high-level summaries of experimental results and details views into reagents and plate layouts. Top: The bar graph lets researchers see the overall trend of a project over time. Here, reaction yield is plotted over the prior four months of experiments. This can help identify trends or outliers in a progression of experiments. Bottom left: The area plot shows the composition of key reagents that have been tested in each experiment. This can help spot factors that may be contributing to changes in reaction yield. Bottom right: The heatmap shows the reaction yield as a function of the location of the reaction on a plate. Each row represents a 384-well plate, and each column represents a well. This can help identify issues related to plate-loading.
The QuickSight dashboard is also the place to become informed by machine learning (ML) insights from the data (Figure 2). In this example, a key parameter that the lab is trying to improve is reaction yield. Here we created a machine learning model to identify the chemical properties that are most associated with high yield. This shows that rotatable bonds, molecular weight, and aLogP are the most important factors (Figure 2, bar chart). This can help guide the chemical development strategy.
We use the model to predict which combinations of reactants will have the highest and lowest yields. This creates a “recommended next experiment” list (Figure 2, table), which is a recommendation of protocols we should try in our experiments, and also a “warning list” of what combinations we should avoid. With a few glances at these ML insights, the dashboard guides scientists to conduct valuable experiments sooner and avoid wasted efforts.
ML can be applied uniquely to different laboratory goals. For example, in an assay development lab, the focus can be on recommendations to optimize assay performance. In a small molecule screening lab, the focus can be on reaction conditions to optimize profiling data. In a large molecule characterization lab, the focus can be on optimizing post-translational status. The ML shown in the dashboard is enabled by Amazon SageMaker, including the Autopilot functionality that eliminates many of the planning steps of building and deploying models. We discuss this later in the data scientist user section.
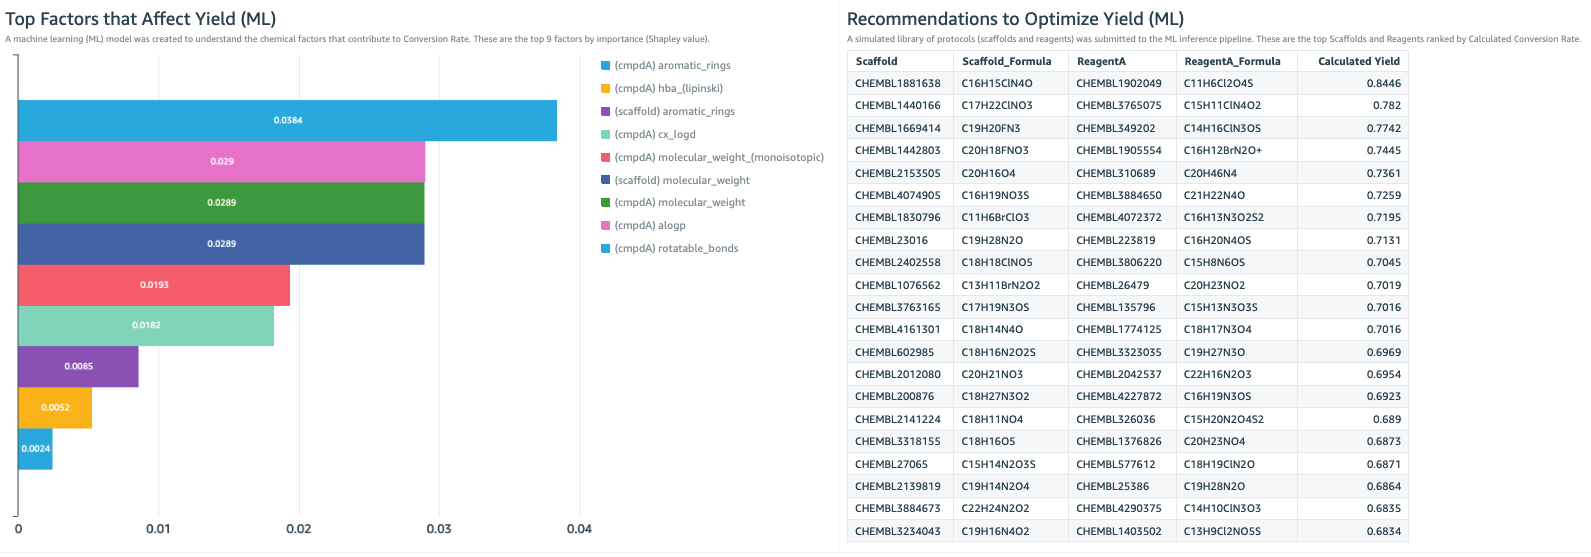
Figure 2. The lab dashboard can include ML insights to help steer the direction of the experimental strategy. Left: The bar chart shows the most important experimental factors that contribute to reaction yield. This is the result of a ML model, trained on the experimental data set, the protocol dataset, and ChEMBL datasets. Right: Here, the ML model provides a list of the most recommended experimental protocols to use in order to maximize reaction yield. Development of this ML model is described in the data scientist section of this post.
IT Admin User Experience
How does the data get into the dashboard in the first place? The backend of this needs to be simple to set up, easy to add data sources to, simple to define metadata fields for, convenient to conduct data transformations in, and secure in its access management. To do this, we take several aspects from the Lake House Architecture and focus on certain areas that will make work easier in the laboratory world.
Here we create a data lake with AWS Lake Formation, which lets you build a data lake in days, not weeks. This step needs to be done only once for your organization. The Lake Formation process is composed of three stages (Figure 3). 1) Registering an S3 storage bucket. This is the cloud storage location where the lab data will be ingested into. In this example, we output the protocol information from our ELN application, from the results of our experimental data, and the external database, ChEMBL. 2) Creating a database for the metadata catalog. This is the database that stores the metadata of all data within the data lake and allows consumers of the data to search the contents of datasets through keywords. 3) Granting permissions. In Figure 4, we define the task-based access controls of different roles within the organization. We define a data lake administrator role that can add new data sources to the data lake. We define a lab scientist role, which can view the dashboard. We define a lab analyst role, which can create data transformations. And we define a data scientist role, which can create dashboards and has access to SageMaker to create new models. With the data lake formation completed, we move to AWS Glue, which populates the data catalog and processes the data.

Figure 3. AWS Lake Formation simplifies the process of setting up a data lake. It is composed of three stages: 1) registering an S3 storage bucket, 2) creating a database for the metadata catalog, and 3) granting permissions.
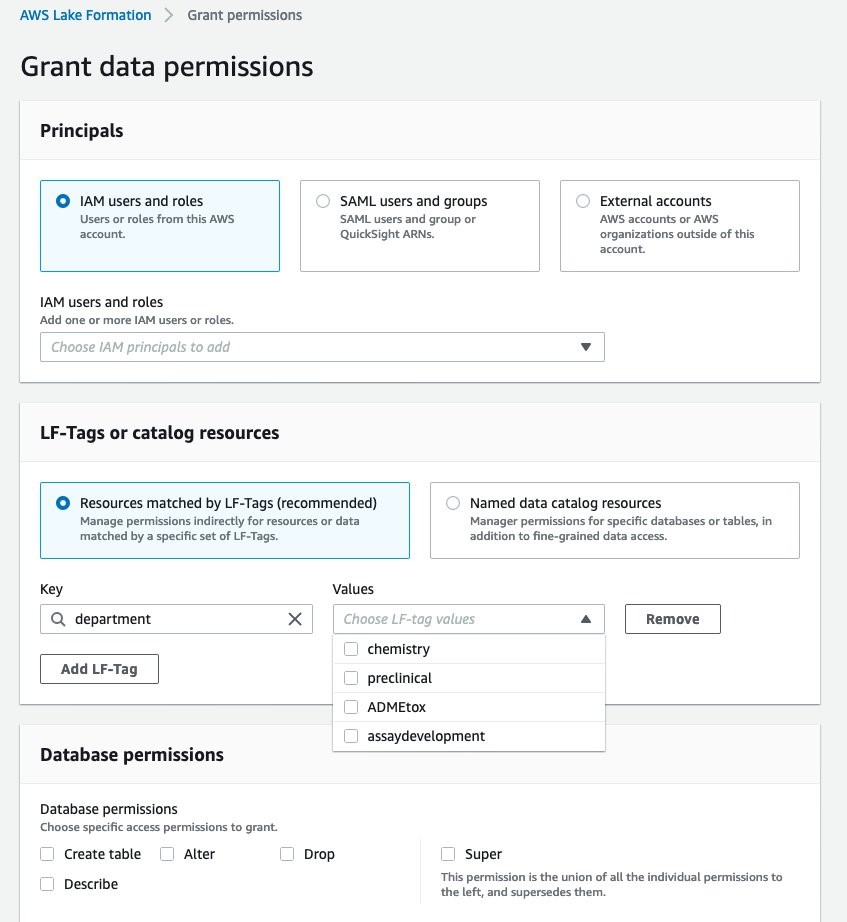
Figure 4. AWS Lake Formation allows IT administrators to define the task-based access controls of different roles within the organization. In this example, we define four departments that have different access: chemistry, preclinical, ADME/toxicology, and assay development.
Data Analyst User Experience
How do we define how the raw data is processed before getting to the dashboard? In this post we have three datasets in our workflow: protocol information from our ELN, the results from our experiment, and a table from the external database, ChEMBL. We want to discover the structure of those datasets then combine them based on common fields into a single, flattened dataset for downstream visualization and ML. An AWS Glue Workflow is used to do just that (Figure 5).
Glue Workflows are composed of two types of actions: crawlers and jobs. Glue Crawlers perform data discovery by scanning datasets, understanding their schemas, and recording their composition within the metadata catalog. Glue Jobs take the data in the data lake and transform them by actions like Join to merge datasets, Select Fields to isolate data items, and Apply Mapping to rename data items. In this post, we set up this Glue Workflow to orchestrate the sequence of crawlers and jobs, and create a trigger to start it when new data is sent into the Amazon S3 bucket. Whenever another protocol is run, the data enters Amazon S3, and a trigger starts the Glue Workflow.
This architecture makes Glue Workflows particularly modular and versatile. For any given lab workflow (defined by a specific instrument type, for example), you simply set up a Glue Workflow once. For another lab workflow, you can either author a new Glue Workflow from scratch, or you can clone an existing Glue Workflow and perform modifications. In this way, your organization can build a library of Glue Workflows that can be reused. So, after you have a few Glue Workflows set up, you are never starting from scratch.
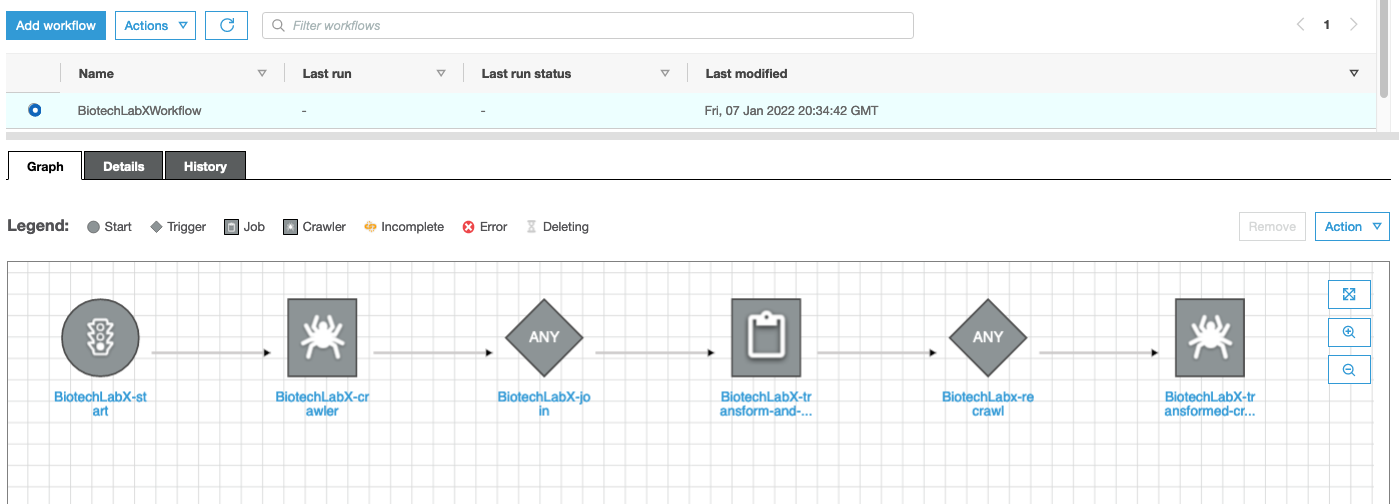
Figure 5. Glue Workflows simplify data discovery and processing. This workflow is defined by: start trigger, crawler to discover the unprocessed data, a job trigger, a job to transform and join the three datasets, crawl trigger, crawler to discovery the processed data.
One of the powerful elements of Glue Workflows is using AWS Glue Studio to author jobs (Figure 6). Glue Studio is a visual, point-and-click interface to create data transforms. With a simple front end, Glue Studio automatically creates the script needed to run transforms in a managed Apache Spark environment. Spark is the industry standard in extract, transform, and load processes, providing a high degree of scalability and performance tuning. This ensures that regardless of the size of your datasets and number of users of the data lake, you have a ETL platform that can handle cloud-scale analytics.
What if your data needs processing other than ETL, such as image analysis, genomics sequence analysis, or other domain-specific algorithms? These processing steps can be orchestrated by configuring the AWS Lambda step in this pipeline. This isn’t the focus of this post, but we have other post examples, such as imaging and genomics, that illustrate how that preprocessing step can be included here.
After the data is processed in the Glue Workflow, we can use Amazon Athena to conduct SQL queries. This can be used to isolate subsets of the data, to filter, and review ad hoc queries. This is a good tool to spot-check the data the first time it’s being connected to a QuickSight dashboard to make sure the transforms are producing the flattened format accurately. When we are sure the data is being transformed properly, the data can be consumed in two ways: QuickSight can point to Athena table as the data source, as discussed previously, and SageMaker can ingest the datasets for ML, as we will discuss next.
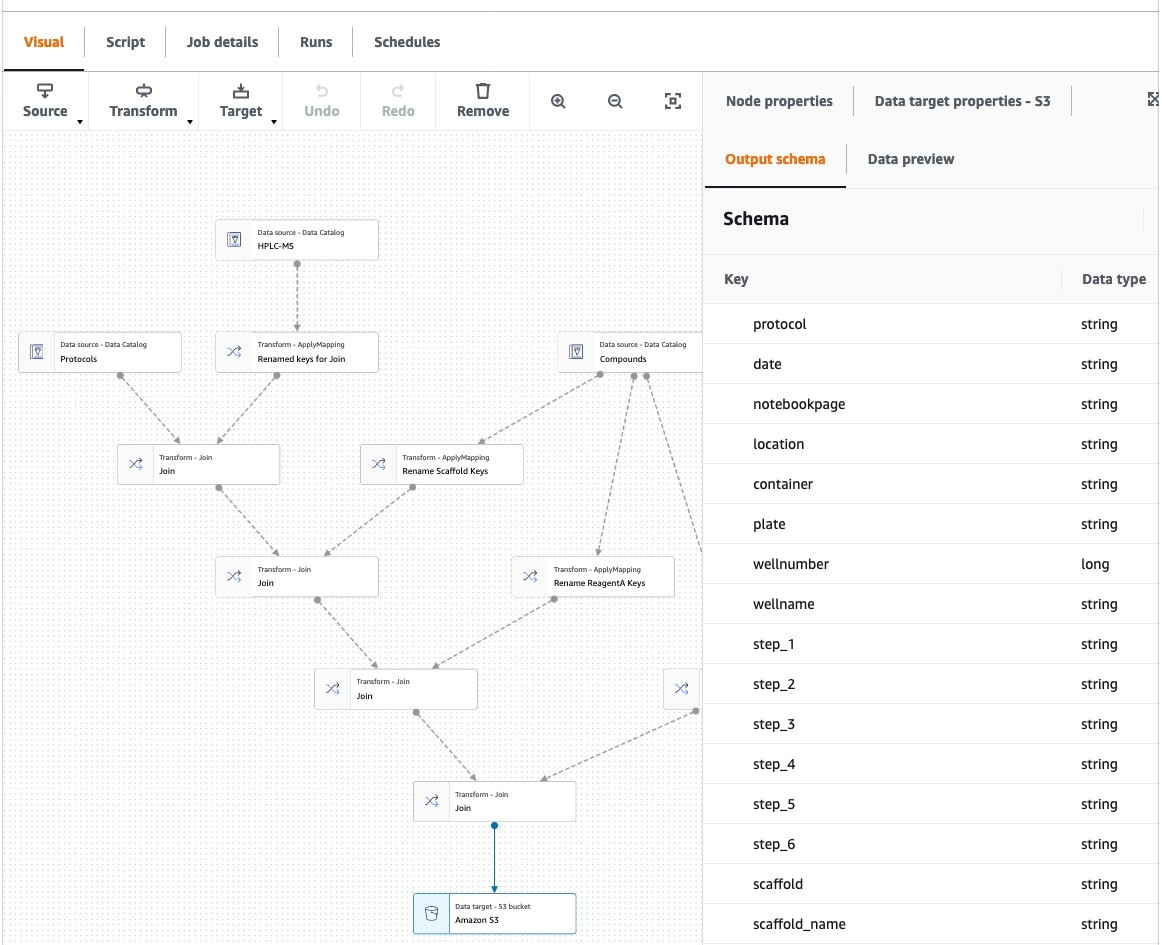
Figure 6. AWS Glue Studio is used to visually author data transformation jobs. Here, three data sets are combined using a Join operation: protocols data (from the ELN), experimental results, and ChEMBL data. Additionally, some data fields are renamed using the ApplyMapping operation.
Data Scientist User Experience
At this stage, the transformed data has brought together protocols, experimental results, and the ChEMBL dataset, which are now available within the QuickSight dashboard. The next opportunity is to apply ML to the dataset to give insights that will improve and optimize the reaction chemistry. To prepare, train, and deploy a model in the most automated way, we used SageMaker Autopilot. Autopilot is essentially a model of models, which evaluates various data preparation approaches, various algorithms, and various hyperparameter values, and suggests a model that fits the data best when applied to an independent test set (Figures 7, 8).

Figure 7. SageMaker Autopilot automatically infers the type of predictions that best suit your data, such as binary classification, multi-class classification, or regression. Here we provided an Autopilot Experiment name, the source S3 location, the filename of the csv output from the Glue Workflow (which is the file resulting from the joining of the three datasets), the target parameter (in this case reaction yield) , and an output S3 location. SageMaker Autopilot then explores several algorithms such as gradient boosting decision tree and logistic regression, and trains and optimizes hundreds of models based on these algorithms to find the model that best fits the data.

Figure 8. SageMaker Autopilot allows you to review all the ML models that are automatically generated for your data. You can view the list of models, ranked by metrics such as accuracy, precision, recall, and area under the curve (AUC), review model details such as the impact of features on predictions, and deploy the model that is best suited to your use case.
Here we use Autopilot as an entry point to building an ML model and then perform more optimization to gain greater understanding of the model. We can deeply examine the types of models being evaluated within SageMaker Autopilot and conduct more in-depth control of the hyperparameter optimization steps (Figure 9). Using SageMaker Clarify we can view which features are the most important, export this information to the data lake, and visualize that within the lab dashboard. This information can guide lab members in their experimental design.

Figure 9. After using Autopilot as an entry point, we can deeply examine the types of models being evaluated within and conduct more in-depth control of the hyperparameter optimization steps
ML can also make recommendations for improving the lab’s scientific protocols. In this example, the major factors in the chemical reactions are the combination of scaffold and reactant. Using SageMaker, we create a virtual set of protocols, using combinations of scaffold and reactant molecules. Then we perform inferences on that dataset using the model created. This results in predictions for reaction yields, for thousands of virtual protocols. We then import these into the dashboard, rank-ordered, so that the scientist can see the recommended chemical combinations to use (that is, the “recommended next experiment” they should carry out).
Machine learning insights using this framework may be helpful in a variety of ways:
- An assay development lab may like to choose the best reaction conditions (time, concentration, heat), to optimize assay performance.
- A hit-to-lead optimization lab may like to exclude reaction conditions that would negatively affect the activity profiles of a hit.
- A technology development team may like to choose solvents and reactants that maximize signal-to-noise ratio.
- A large molecule characterization lab may like to uncover what gene expression affects the post-translational modification state of the molecule.
- A lab manager may like to forecast the inventory needs for upcoming experiments, based on past activities.
Cloud Architecture
The solution uses AWS Lake Formation, AWS DataSync, Amazon S3 data storage, Lambda, Glue Crawler, Glue Jobs, Athena, Quicksight and SageMaker (Figure 10). A notable aspect of this architecture is that it’s serverless. This shortens the time to get started and simplifies the ability to add it to existing IT environments. No prior cloud presence is needed to get started, just an AWS account.

Figure 10. AWS DataSync is used for file upload. AWS Lake Formation is used to create the data lake and grant permissions. Amazon S3 is used for storage and archiving. AWS Lambda is used to trigger data discovery and processing. AWS Glue Crawler discovers the data structure. AWS Glue Jobs transforms, cleanses, and joins the data sets. AWS Glue creates the metadata catalog. Amazon Athena is used for ad hoc queries. Amazon Quicksight is used for visualization and alerts. Amazon SageMaker is used as the ML environment. SageMaker Autopilot is used as an auto-ML notebook.
Discussion
Scientists want to get more knowledge out of the data they generate. They want more accurate and faster analyses of their experiments, more automation within their quality control steps, notifications of activities in the lab, automated statistics, and pattern identification with ML. At the same time, scientists want to spend less time handling their data, including file transfers, file conversions, spreadsheet manipulation, manual entry, data cleaning, data organization, data archiving, and one of the dreaded ones—spending time searching for old data. With the solution described here, scientists continue to use their existing systems for data acquisition, LIMS, and ELN, yet on top of them can build a simple and powerful, dashboard for decision making, with minimal data engineering.
Research collaboration is slowed when laboratory data resides in the silos of different systems. Organizations can find it hard to find, combine, and reanalyze data coming various divisions (for example, discovery, translational, clinical), from various analytical instrument types (for example, chemical, biochemical, genomic, proteomic), from various data systems (for example, LIMS, LES, ELN), and from various geographies (for example, global studies). In order to acquire more value per experiment, R&D organizations need simple tools to catalog data and make the data available for future consumption. With the solution described here, cataloging data in a central metadata catalog is done automatically. This enables labs not only to store data, but to help deliver their data as a “data product” that is FAIR: Findable through queries and keywords searches; Accessible to users who have permissions; Interoperable by other methods; and Reusable through self-description.
As an organization’s scientific data catalog is established, access guideposts are needed to keep data secure and compliant. These may be needed to adhere to privacy policies, to regulatory policies, and to cybersecurity policies. A growing trend to address this is called the data mesh. A major benefit of the data mesh is to afford more autonomy and ownership of data generation and processing to the laboratory (the data producer), while enforcing guideposts centrally. The solution described here can support a data mesh, enabling laboratories and research departments to move quickly and autonomously, while working within a governance structure.
Conclusion
Life sciences organizations are seeking to integrate datasets rapidly to apply visualizations and data science techniques like ML and AI, with minimal overhead. They want to do this while maintaining system compliance, data quality, and data integrity. Interoperability of research data is a critical hurdle in the life sciences. The solution presented here illustrates the simplicity and power of AWS through the eyes of four personas: scientist, data analyst, IT administrator, and data scientist. We hope this solution inspires new tools that are adapted to life science labs, to enrich existing ecosystems of scientific software and help set a foundation for scalable enterprise data strategies.