AWS for Industries
Building a scalable image processing pipeline for image-based transcriptomics
The below post was written by guest author Shannon Axelrod, Senior Software Engineer at the Chan Zuckerberg Initiative.
At the Chan Zuckerberg Initiative (CZI), the science team’s goal is to support the science and technology that will make it possible to cure, prevent, or manage all diseases by the end of this century. In particular, the organization employs a combination of grant making and software development to help scientists better understand the human body on a cellular level. In this post, I describe how the starfish open source CZI project and Amazon Web Services technology can be combined to create a scalable image processing pipeline for an image-based transcriptomics experiment.
What is image-based transcriptomics?
Differences between liver and brain cells or cancerous and healthy cells are driven by their “gene expression” patterns— ie which genes are turned on or off in a given cell. To measure gene expression in individual cells, biologists feed tissue samples through single cell sequencing technologies to generate a cell-by-gene expression matrix. Each row represents a cell found in the tissue sample, each column corresponds to a gene, and each element in the matrix corresponds to the number of times that gene was expressed in that cell. This expression matrix can be mined, typically with dimensionality reduction techniques, to understand the cellular composition of the tissue being studied. These insights are used to further things like drug discovery and clinical diagnostics.
Widely used single cell sequencing technologies involve separating cells from the tissue sample as an early step of the process. As a result, the information about where each cell exists in the tissue is lost. Biologists are eager for sequencing techniques that maintain this spatial information, which is critical to understanding the cellular context that make up the tissue. Image-based transcriptomics is one such technique.
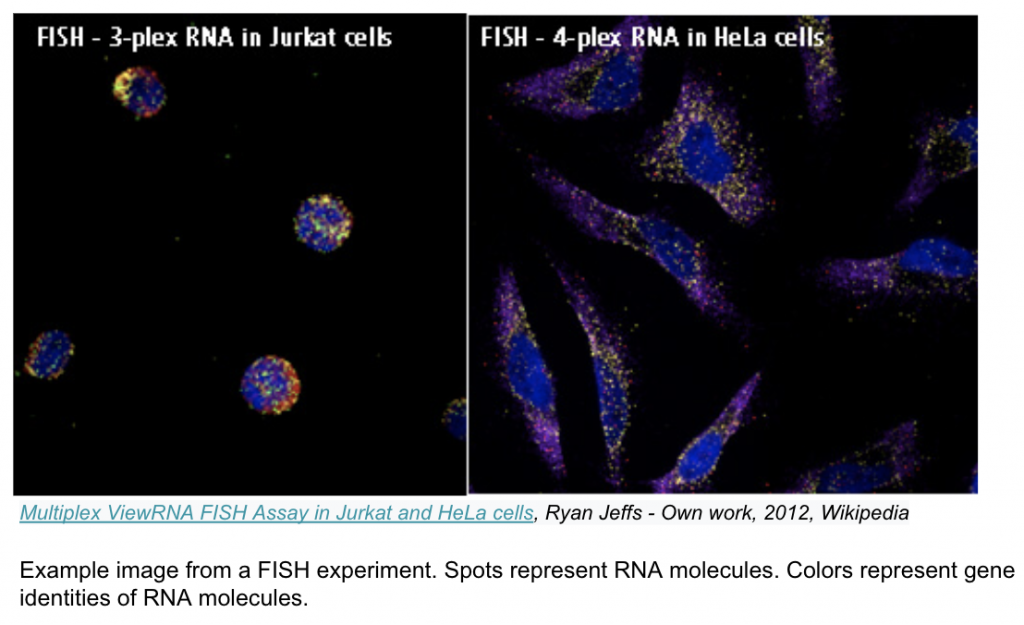
Image-based transcriptomics is a group of methods that measure gene expression of intact tissue samples, without separating the cells. Fluorescent probes injected into the tissue sample bind to specific RNA molecules (which encode particular genes) and emit bright spots when illuminated with specific colored light. The sample is then imaged to capture these bright spots and the resulting images are fed through an image processing pipeline. The output is a cell by gene expression matrix similar to that of a typical sequencing experiment; however, since the cells remain in place during imaging, their spatial information is preserved and added as coordinates to the expression matrix.
What is starfish?
Since these image-based sequencing experiments are relatively new, standard and scalable image processing pipelines for data analysis do not exist yet. The starfish library was borne out of a need to help identify and create such a standard. Created in collaboration with the spaceTx consortium (a group of image-based transcriptomic assay developers coordinated by the Allen Institute for Brain Science and funded by CZI), starfish is an open source library that allows a user to construct an image processing pipeline for their image-based transcriptomic data. Most created pipelines follow a similar structure. The overall tissue is imaged in a collection of small “sections” called fields of view (FOVs); for each FOV:
- The images are registered across imaging rounds for spatial alignment.
- The images are filtered to reduce background noise.
- Spots (the bright probes that are bound to RNA molecules) are detected within the images.
- Spots are “decoded” using a provided mapping from the probe signal to the corresponding gene signal.
- Cells are segmented within the images, such that decoded spots (genes) can then be assigned to cells.
- For each cell, the total number of genes expressed is counted in order to create a cell by gene expression matrix.

At each step starfish provides a number of different algorithms to choose from – it is up to the research biologist to determine the algorithm and parameters that work best with their data. Typically the biologist will work with a small subset of their experiment images to develop the optimal starfish processing pipeline, dubbed a starfish “recipe”. Once the biologist has determined their optimal starfish recipe, a problem of scale arises in managing potentially terabyte sized datasets. How do they apply the processing recipe to an entire imaging dataset in the least painful way? The starfish team wanted to provide tutorials on how to parallelize image-based transcriptomic experiments using cloud infrastructure, so I set out to find the easiest way to do so using AWS.
Upload SpaceTx dataset to Amazon S3
Before I could begin processing any experiment data with AWS resources, I’d need to upload the image files and data model to S3. Starfish stores these data relationships in the consortium-standardized spaceTx file format. JSON files define groups of images that combine into a data tensor representing a single field of view of the experiment. An entire experiment is made up of many fields of view.
First, I created a S3 bucket called `aws-processing-example` to store my example dataset (the dataset used in this tutorial is accessible through the starfish api)

Then uploaded my spaceTx dataset:
`aws s3 sync . s3://aws-processing-example/iss-spacetx-formatted/`
Note: This data set is relatively small compared to other image-based transcriptomic experiments. For our users with larger datasets uploading data with AWS DataSync may be a better solution.
Upload a starfish recipe file
I’d also need to upload my starfish processing recipe. I created a file called `recipe.py` and added the code to process a single field of view of data:
and uploaded it:
`aws s3 cp recipe.py s3://aws-processing-example/iss-spacetx-formatted/`
Create a processing job
There were a few things to keep in mind when looking for the right AWS services to use for processing:
- I wanted to keep the setup for a user as simple as possible, meaning fewer services is better.
- Since the processing pipeline is the same for every field of view, processing the entire experiment could be considered an “embarrassingly parallel” problem.
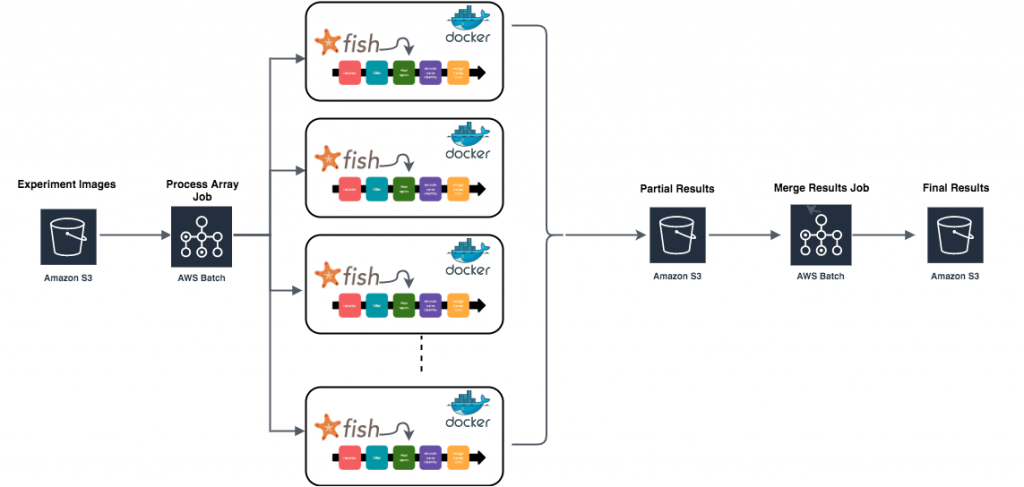
After a bit of research, AWS Batch seemed to offer exactly what I was looking for. A batch array job allows you to execute the same job definition and parameters concurrently in a distributed manner across multiple hosts. I could create a job definition that processes a single field of view using my starfish recipe file then I could use a batch array job to apply that processing to every field of view in parallel.
To get set up with AWS Batch, I followed the Getting Started Guide to set up a job queue and compute environment:
Create a custom IAM role
Before I could create any jobs, I’d also need to create a custom IAM role to use that had access to both batch and my newly created S3 bucket. Using the IAM console I created a new AWSBatchServiceRole named `spacetx-batch`. Then I attached the following policy:
Define a batch job for processing a single field of view
Since AWS Batch allows you to define a job using a docker container, I created a simple docker container `spacetx/process-fov` that processes a single field of view of data taking as input:
- EXPERIMENT_URL: The location of my experiment files in S3
- RECIPE_LOCATION: The location of my recipe file in S3
- RESULTS_LOCATION: The S3 bucket to copy the results from the job to
I then submitted a batch job definition using my new container and custom IAM role:
Define a batch job for merging results across field of views
In the final step of processing, the results from each field of view are combined into a single decoded spot matrix. For this step, I created another docker container `spacetx/merge-batch-job` to use with batch that gathers the processed results from each field of view, merges them, then copies the final table back to S3:
Submit both jobs
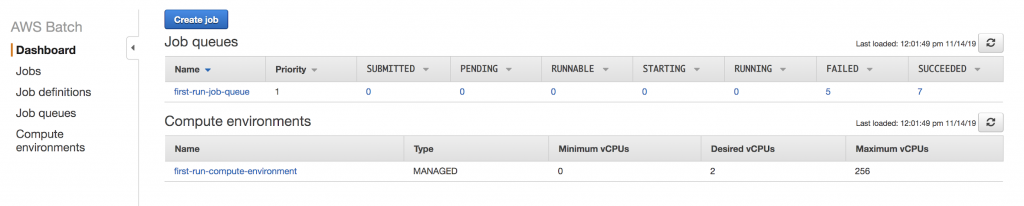
After creating both job definitions, it was time to run them. I submitted the `process-fov` job as an array job where the array size was equal to the number of fields of view in my dataset (in this case 15):
After navigating to the batch console and verifying my `process-fov` job finished successfully I submitted the merge job:
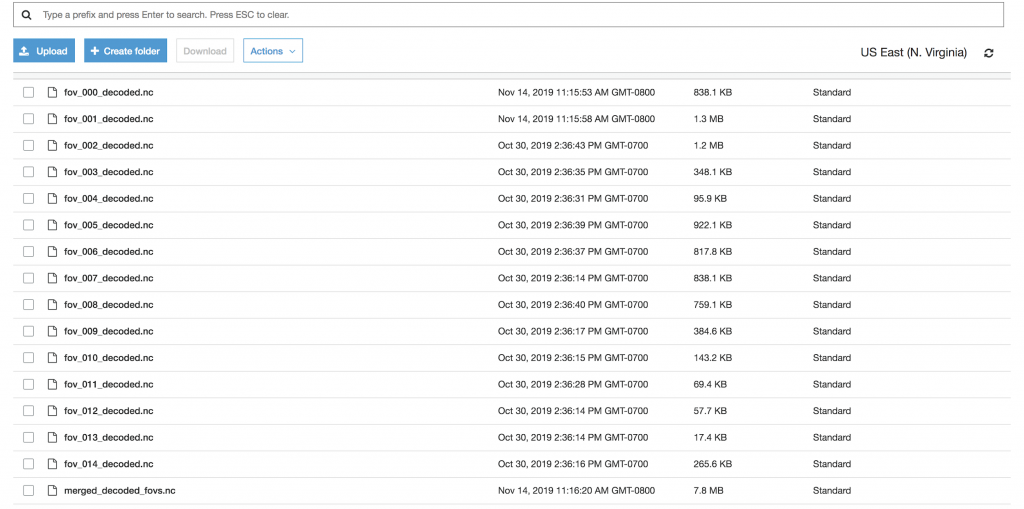
To check that things had worked properly, I navigated to my results bucket and found both the results from each individual field of view as well as the merged results:
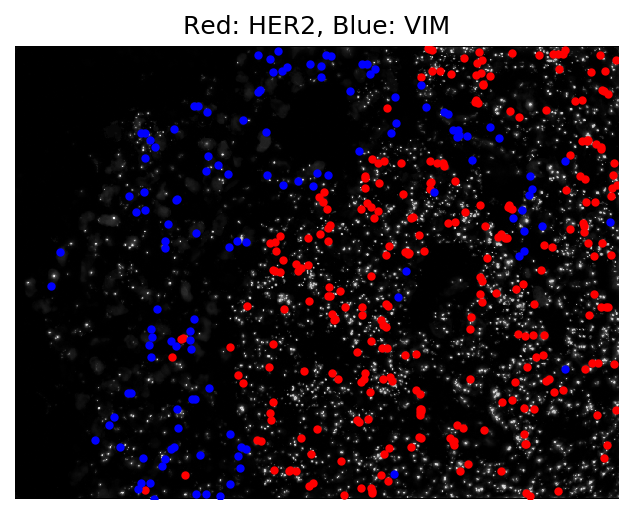
And that was it! A fully processed image-based transcriptomic experiment in around 10 minutes. Below we see a visualization of the output of a single field of view of data. Cells expressing the HER2 gene (shown in red), a known biomarker of breast cancer, are clustered together in the tumor portion of the tissue.
The code for both docker images can be found here. A detailed step-by-step tutorial provided to our users can be found with the starfish documentation.
Opportunities for the future
Existing example pipelines in the starfish repository, like the one used in this tutorial, show that starfish can be used to reproduce results obtained from many existing pipelines developed for specific image-based transcriptomics assays. This is exciting, as the analysis can now be done in one standardized software package, instead of one custom software package per assay. The library is now being used by groups developing their analyses pipelines for the first time. We hope that providing an easy way for users to scale their processing will accelerate the adoption of image based transcriptomic experiments, ultimately driving discoveries about the physical cellular architecture of all organs in health and disease.
Additional expositions on starfish and the SpaceTX consortium:
https://www.nature.com/articles/d41586-019-02477-9
Scientific review articles for image-based transcriptomics:
- Svensson et. al. (2018). Exponential scaling of single-cell RNA-seq in the past decade. Nature Protocols 13, 599–604.
- Lein et. al. (2017). The promise of spatial transcriptomics for neuroscience in the era of molecular cell typing. Science 358, 64–69.
- Crosetto et. al. (2015). Spatially resolved transcriptomics and beyond. Nature Reviews Genetics 16, 57–66