AWS for Industries
Making financial data accessible for analytics: how Amazon FinSpace can integrate with Snowflake
Amazon FinSpace makes it easy for analysts and quants to discover, analyze, and share data, reducing the time it takes to find and access financial data. What previously took months now can be completed in a matter of minutes. Using FinSpace you can work across your firm’s internal data silos to aggregate, catalog, and tag data to make it easy for your entire organization to search for data. FinSpace includes a managed Apache Spark analytics engine containing 100+ data transformations such as summarizing bars from raw events (time, tick, and dollar), moving average convergence/divergence (MACD), and on-balance volume (OBV) to allow financial analysts access to information needed and to run powerful analytics across their data sets.
In this post, we explore how to connect to the Snowflake platform from FinSpace using Snowflake’s connector for Spark and how to populate the FinSpace catalog with Snowflake metadata such as schema details, dataset owner, and description. We will see how simple it is to discover available data, and how to connect to Snowflake from a FinSpace Jupyter notebook to read a market dataset and compute realized volatility of Amazon stock. We will then add event data from Snowflake, sourced from FactSet, which we will match up with volatility spikes to determine what may have caused these spikes.
Solution Overview
This blog post will cover the following steps:
- Configure your FinSpace catalog to describe your Snowflake tables.
- Use FinSpace Jupyter notebooks to connect to Snowflake and populate the FinSpace catalog with tables from Snowflake.
- Search the FinSpace catalog for data.
- Use FinSpace notebooks to combine data from FinSpace and Snowflake for analysis.
- Write analysis results back to Snowflake for use by groups outside of FinSpace.
The following diagram provides the complete solution overview.
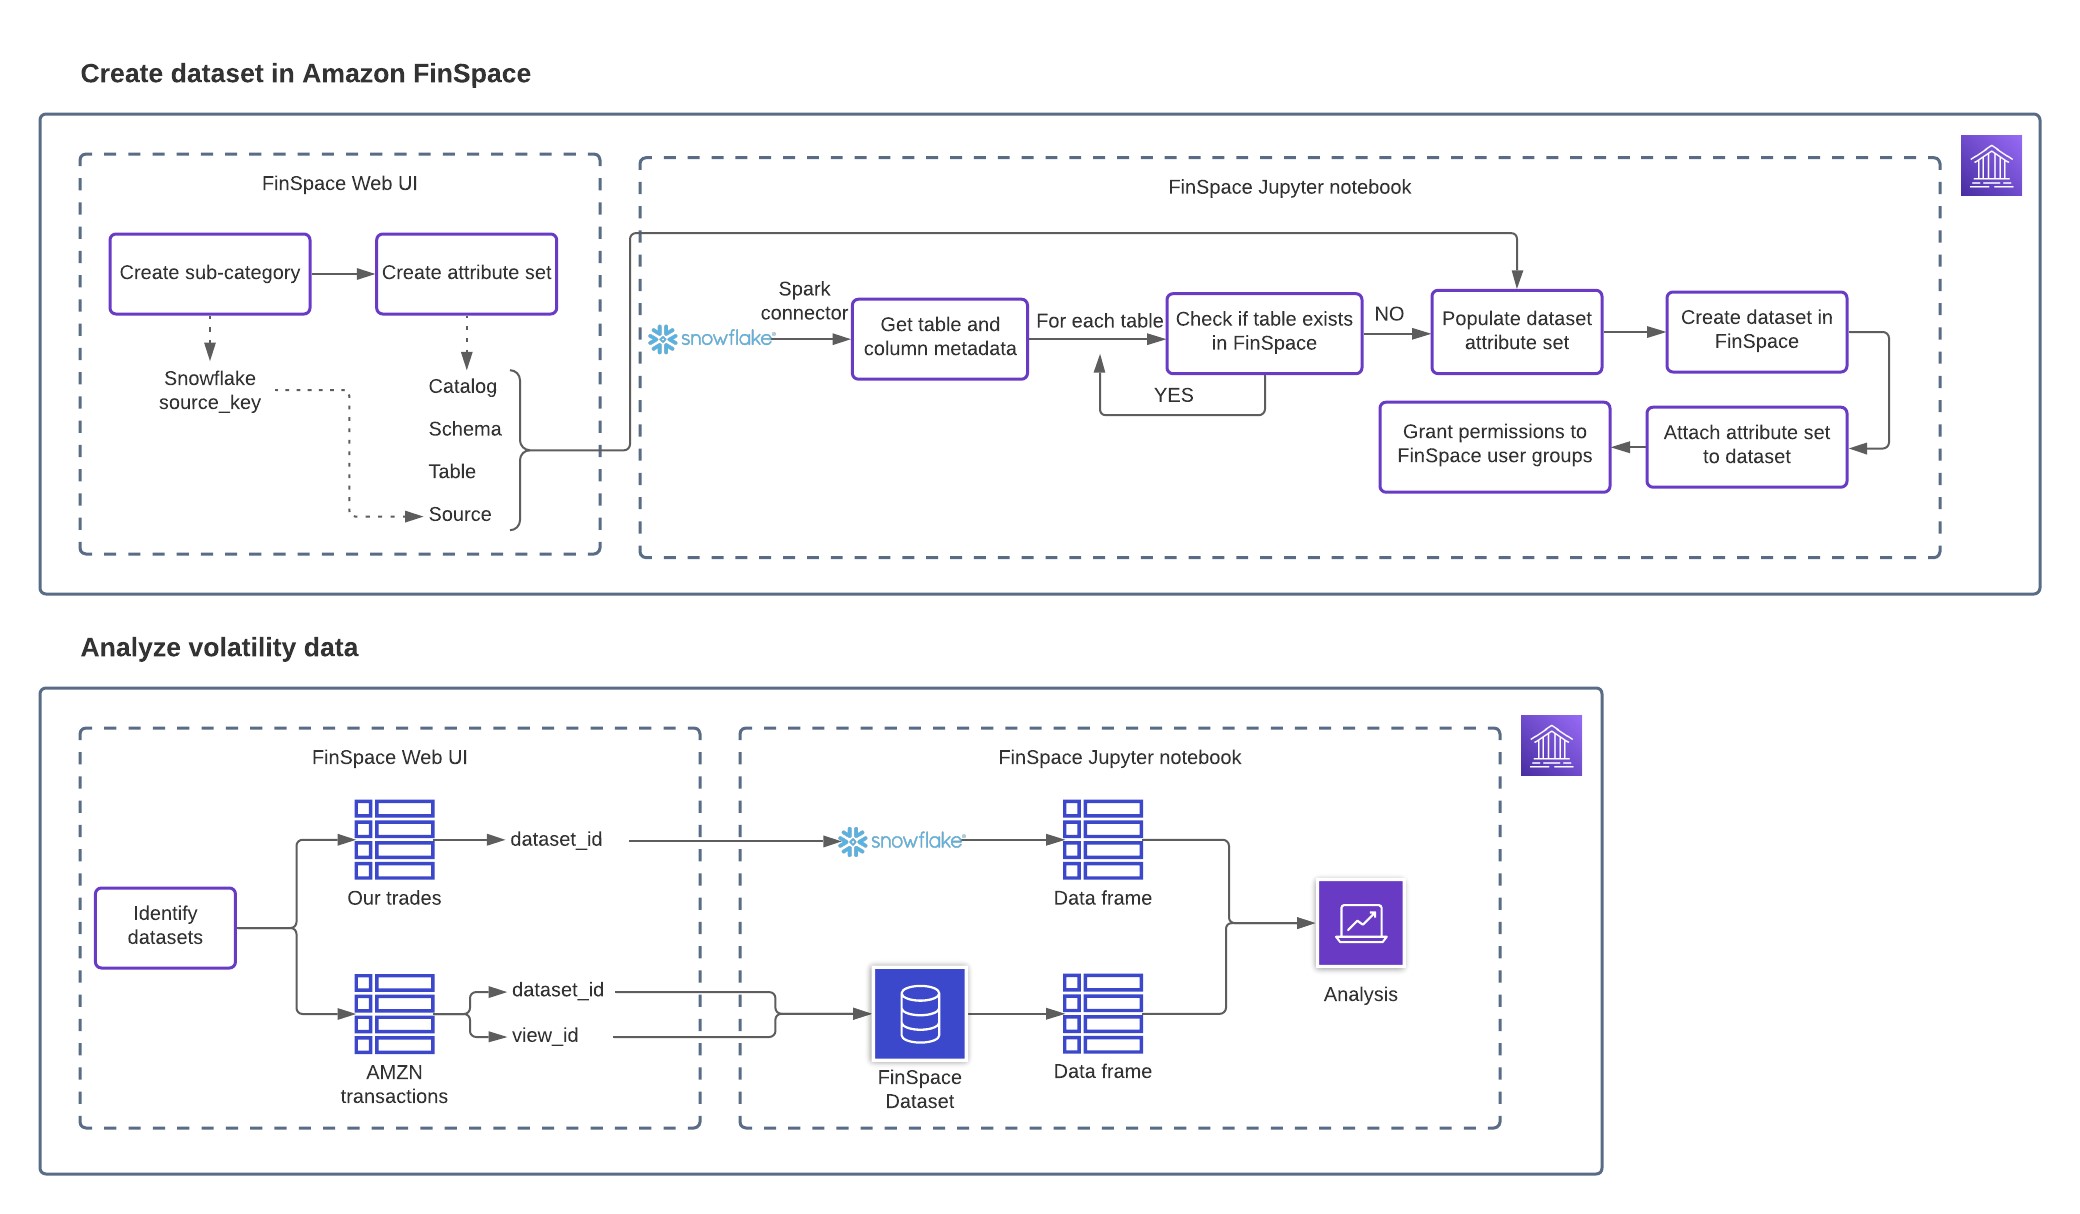
Figure 1: Solution Overview
Prerequisites
Before you get started, make sure you have the following prerequisites:
- Access the FinSpace workshop on AWS to setup your FinSpace environment and follow Steps 1-4.
- Ensure the demo user has permissions to manage categories, controlled vocabularies and manage attribute sets as explained in the workshop above.
Configure your FinSpace catalog to describe your Snowflake tables
FinSpace users can search the FinSpace catalog to discover relevant datasets using the search functionality or by navigating across categories under the Browse Data menu. Categories allow for cataloging of datasets by commonly used business terms (such as source, data class, type, and industry). An attribute set holds additional metadata for each dataset, including categories and table details to enable you to connect to the data source directly from a FinSpace notebook. Analysts can browse and search attributes to find datasets based on the values assigned to them.
Complete the following steps to create a new subcategory called Snowflake under the “Source” category, and create an attribute set called “Snowflake Table Attributes”. In the following section, we use the subcategory and attribute set to tag datasets from Snowflake. FinSpace users can then browse for the data from the Snowflake source from the Browse Data menu and filter datasets in FinSpace for the tables that are located in the company’s Snowflake data cloud.
- On the FinSpace console, choose Settings (gear icon).
- Choose Categories.
- Hover over the ‘Data Source’ category and choose Edit this Category.
- On the Edit Category page, hover over the Source category again and choose Add Sub-Category.
- Add Snowflake as a source subcategory and a suitable description.

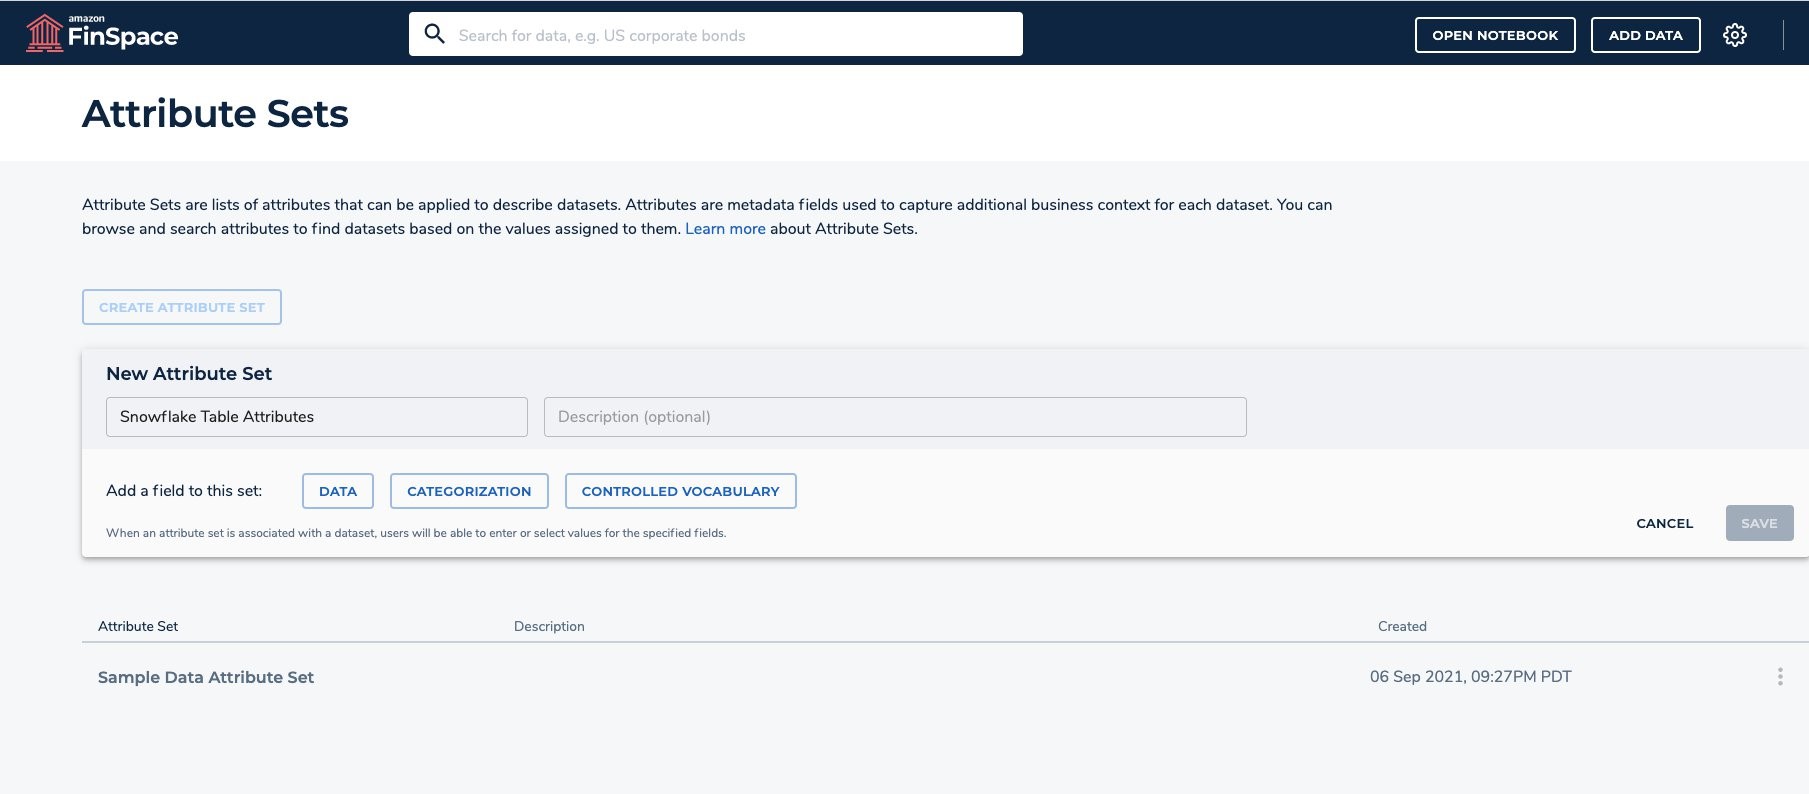
Next, create an attribute set called “Snowflake Table Attributes” to capture additional business context for each dataset.
- On the FinSpace console, choose Settings (gear icon).
- Choose Attribute Sets.
- Choose CREATE ATTRIBUTE SET.
- Create a new attribute set called “Snowflake Table Attributes”.
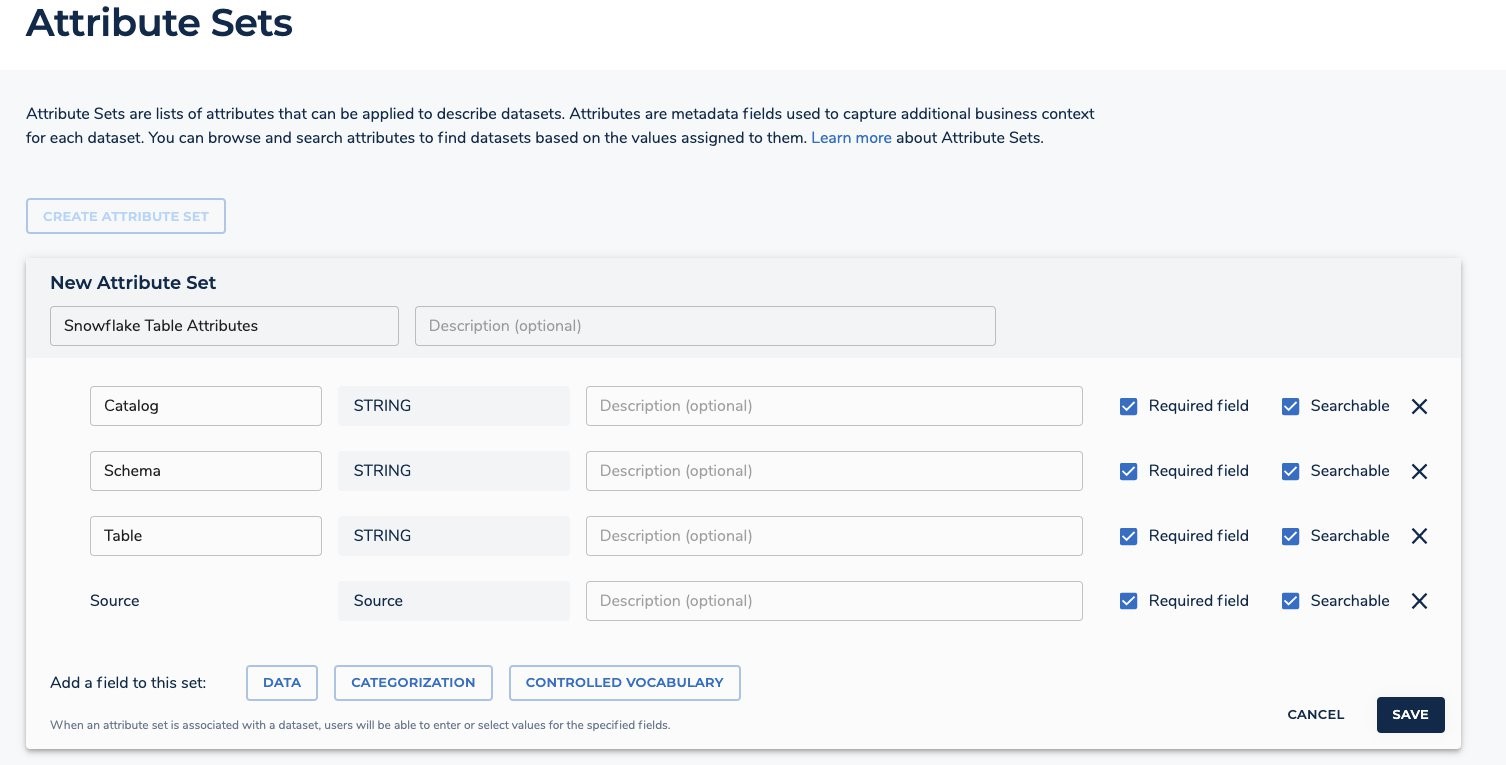
Add the following data fields to the Attribute Sets.
- Catalog – Data String type.
- Schema – Data String type.
- Table – Data String type.

Add the following categorization field.
- Source – Categorization Source type.

- Click on ‘SAVE’.

Use FinSpace notebooks to connect to Snowflake
Clone amazon-finspace-examples GitHub repo using the FinSpace notebook environment using the following steps.
- Copy the amazon-finspace-examples repository link.

- Within the FinSpace environment, click on ‘Go To Notebook’. If prompted ‘Allow pop-ups’ in your browser.
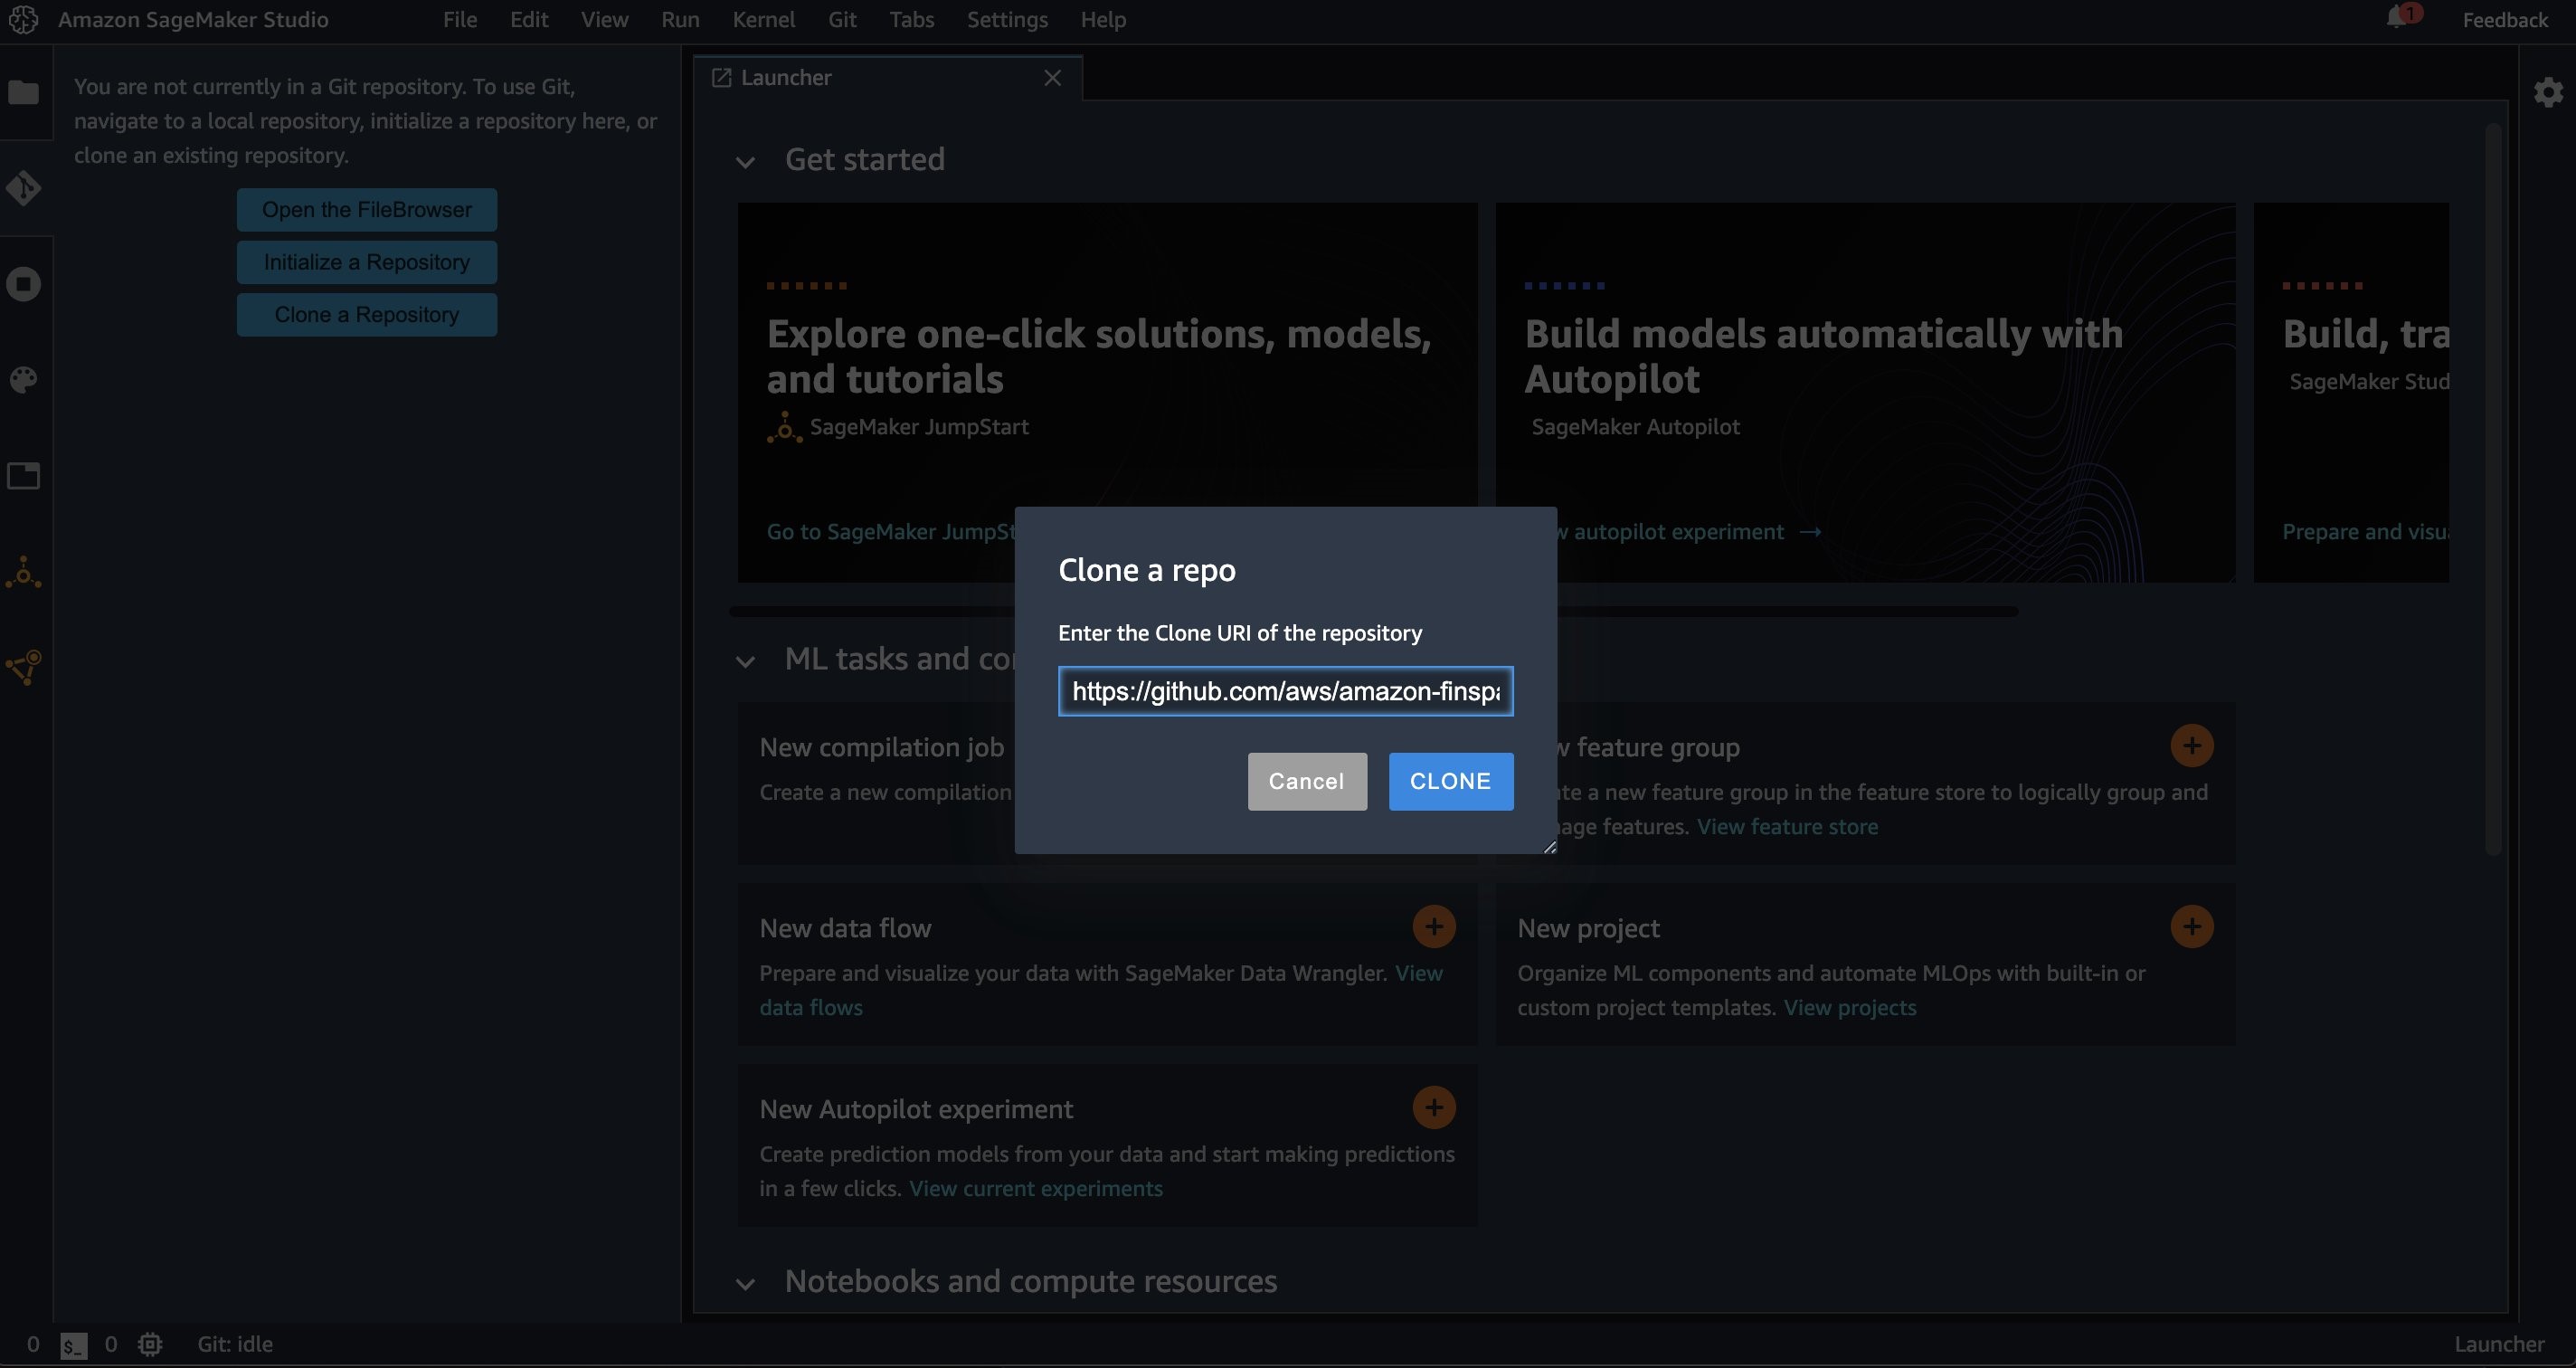
- Select the ‘Git’ icon located on the left-hand pane and click on ‘Clone a Repository’.

- Paste the above copied amazon-finspace-examples GitHub URI and click ‘Clone’.
- Navigate to the snowflake_import.ipynb notebook located under the ‘webinars’ folder.
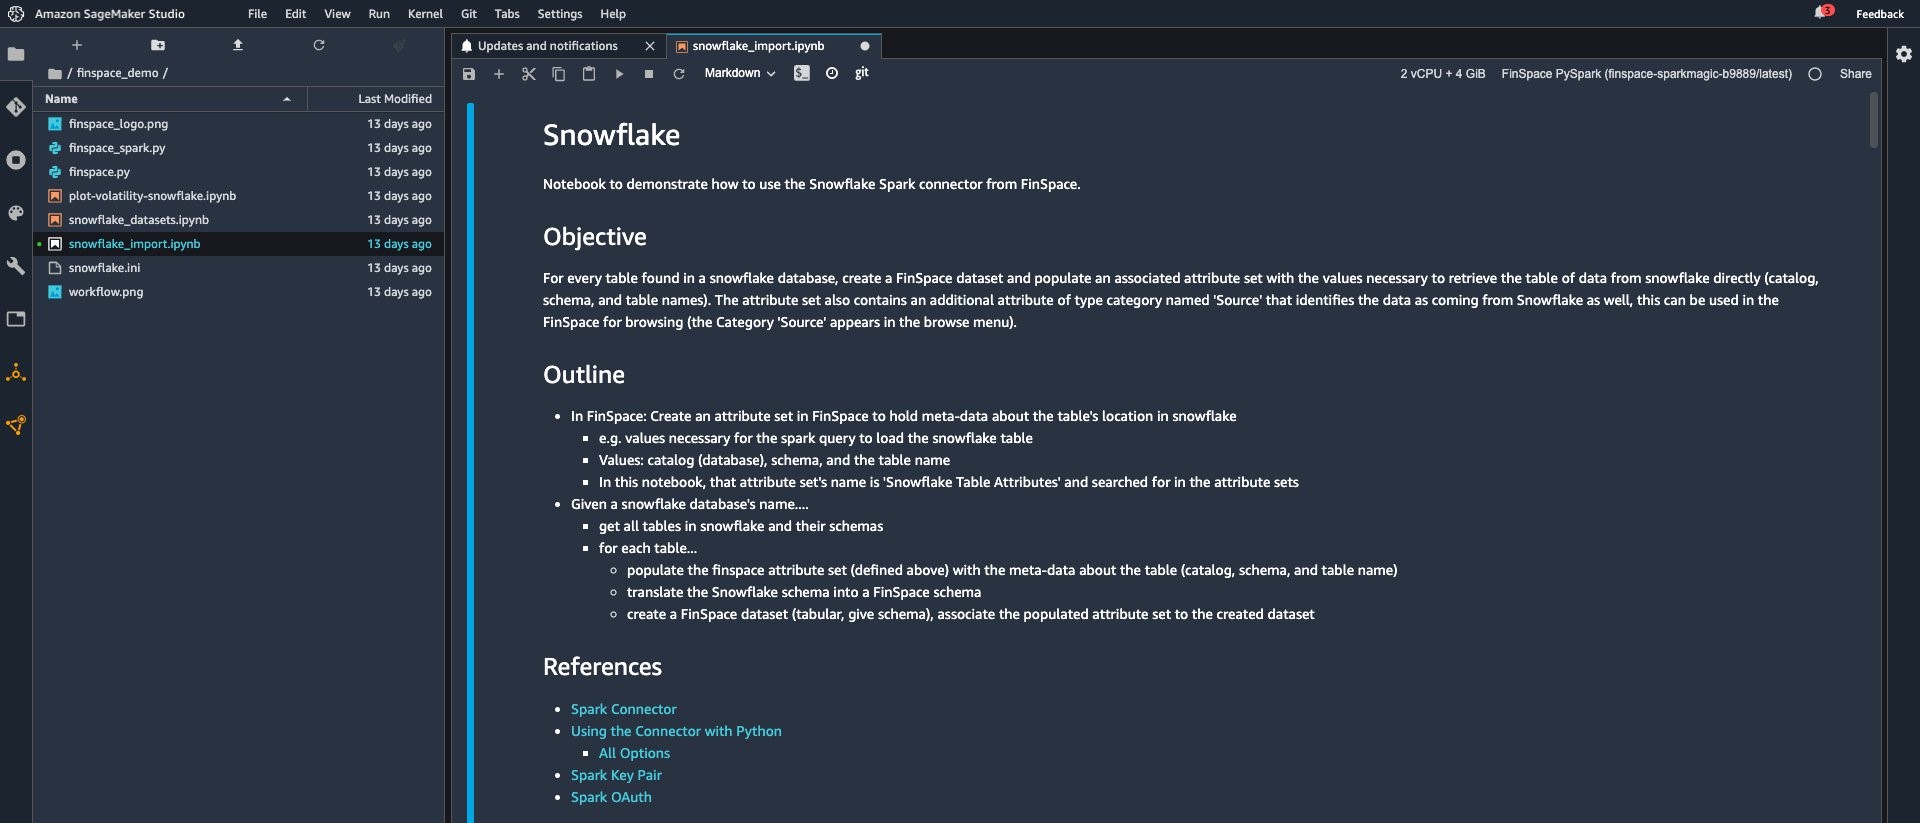
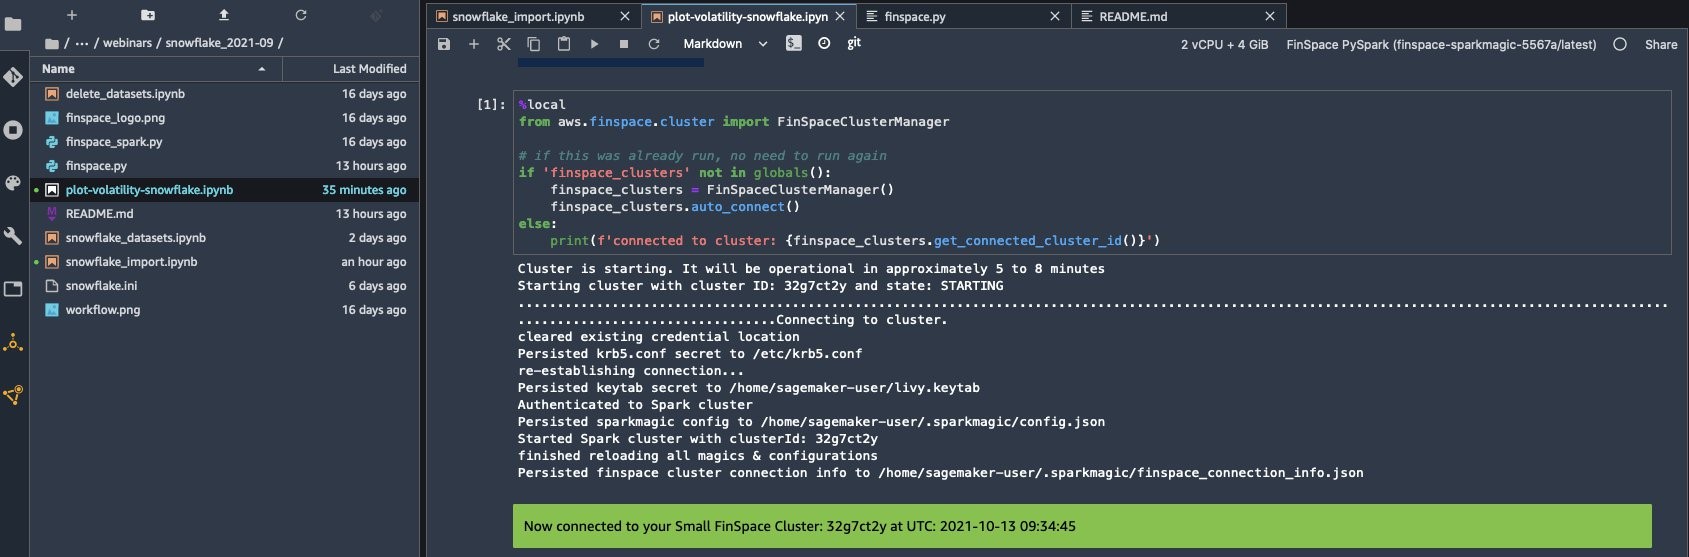
- Double click on the snowflake_import.ipynb notebook and select the FinSpace PySpark latest kernel. The code in this Jupyter notebook will populate the attribute set created in FinSpace with metadata from selected Snowflake tables.

- Run the first cell to start the Spark cluster. Once the connection is established, a “connected to cluster” message appears.

- Run the next cell to add the JDBC driver to Spark jars.

- Click the ‘+’ on the left pane to open ‘New Launcher’ tab. Scroll to the ‘Utilities and files’ section and click on Text File.

- Create a snowflake.ini file with the following content. The strings within and including <<>> below should reflect the Snowflake connection details. In this example, the default role of the user will be used for access control.
[snowflake]
user: <<username>>
password: <<password>>
account: <<account>>
database: <<database>>
warehouse: <<warehouse>>

- On the snowflake_import.ipnyb notebook, under ‘Configure Spark for Snowflake’, run the next cell to deploy packages so the FinSpace cluster can communicate with Snowflake.

- Run the next cell which reads the snowflake.ini file and assigns values.

- Once the values are read from the snowflake.ini file, they need to be sent to the FinSpace Spark instance. Run the next five cells as shown below.

- Run the next cell to define the sfOptions dictionary and identify the Snowflake Spark source class. For further information on these options, refer to Snowflake account identifier documentation.

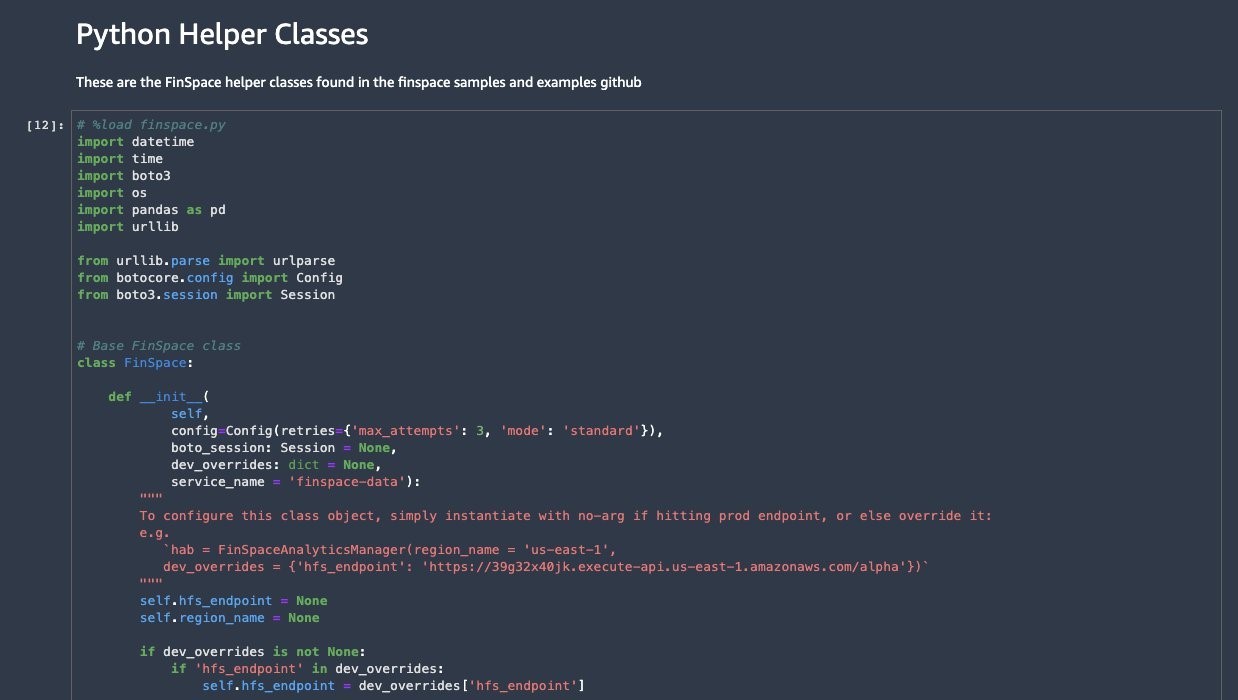
Python helper classes help with schema and table creation, cluster management, and more. The utility functions help translate Snowflake data to a FinSpace schema. The python code for these helper classes is defined in finspace.py and finspace_spark.py.
- The spark magic command “%load [finspace.py|finspace_spark.py]” is used to load and distribute the class code to the FinSpace Spark cluster. Run the next cell under “Python Helper Classes” to import the text.
- Run the next cell to load and run it into Python.

- Run the next cell to create an instance of the SparkFinSpace class.

Import all tables from a Snowflake database
In this section we import the technical metadata from Snowflake into FinSpace. The metadata of a table in Snowflake is ingested into a FinSpace attribute set which is then associated with the FinSpace dataset representing Snowflakes table.
Each FinSpace dataset represents one table in the given Snowflake database.
Any dataset in FinSpace must be assigned to a group with a group ID. To get the ‘Sample Data’ group id:
- In the FinSpace environment, click on the gear icon located on top right-hand corner of the screen, select ‘Users and Groups’ this will show a list of groups.
- Choose Sample Data group.
- Make note of the group ID from the URL as shown below.

In the snowflake_import.ipnyb notebook, replace the dbName variable with the name of the Snowflake database and the group_id variable noted in the previous step.
Run the following cell to set up the Snowflake database, create the datasets, populate the table and schema data frames.

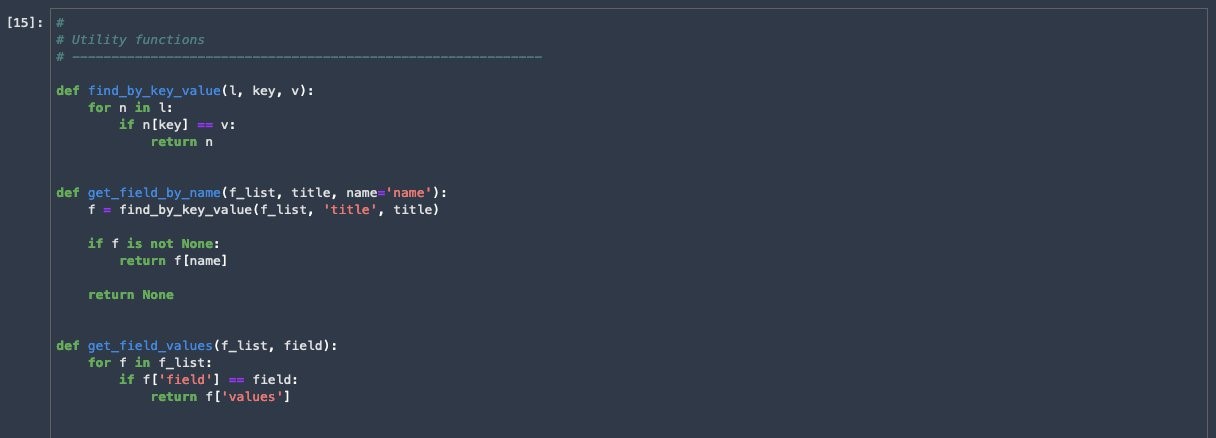
Utility functions
Run the next cell to define functions that translate the Snowflake schema to FinSpace schema and parse the returns from FinSpace.
Get the attribute set
The Snowflake attribute set must be retrieved by name, and its identifiers are used when populating the attribute set for association to the datasets. The exact IDs of the fields are required.
Run the following cell to derive the Snowflake attribute set.

Snowflake source
One of the fields in the Snowflake attribute set identifies the source to be Snowflake, this is through a classification whose values/identifiers need to be extracted from FinSpace and then used to populate the Snowflake attribute set and associate it to the FinSpace datasets that are to be created.
- Run the next cell to set the source to Snowflake in the Snowflake attribute set.

- Run the next cell to display the first 10 rows of tables from the snowflake database.

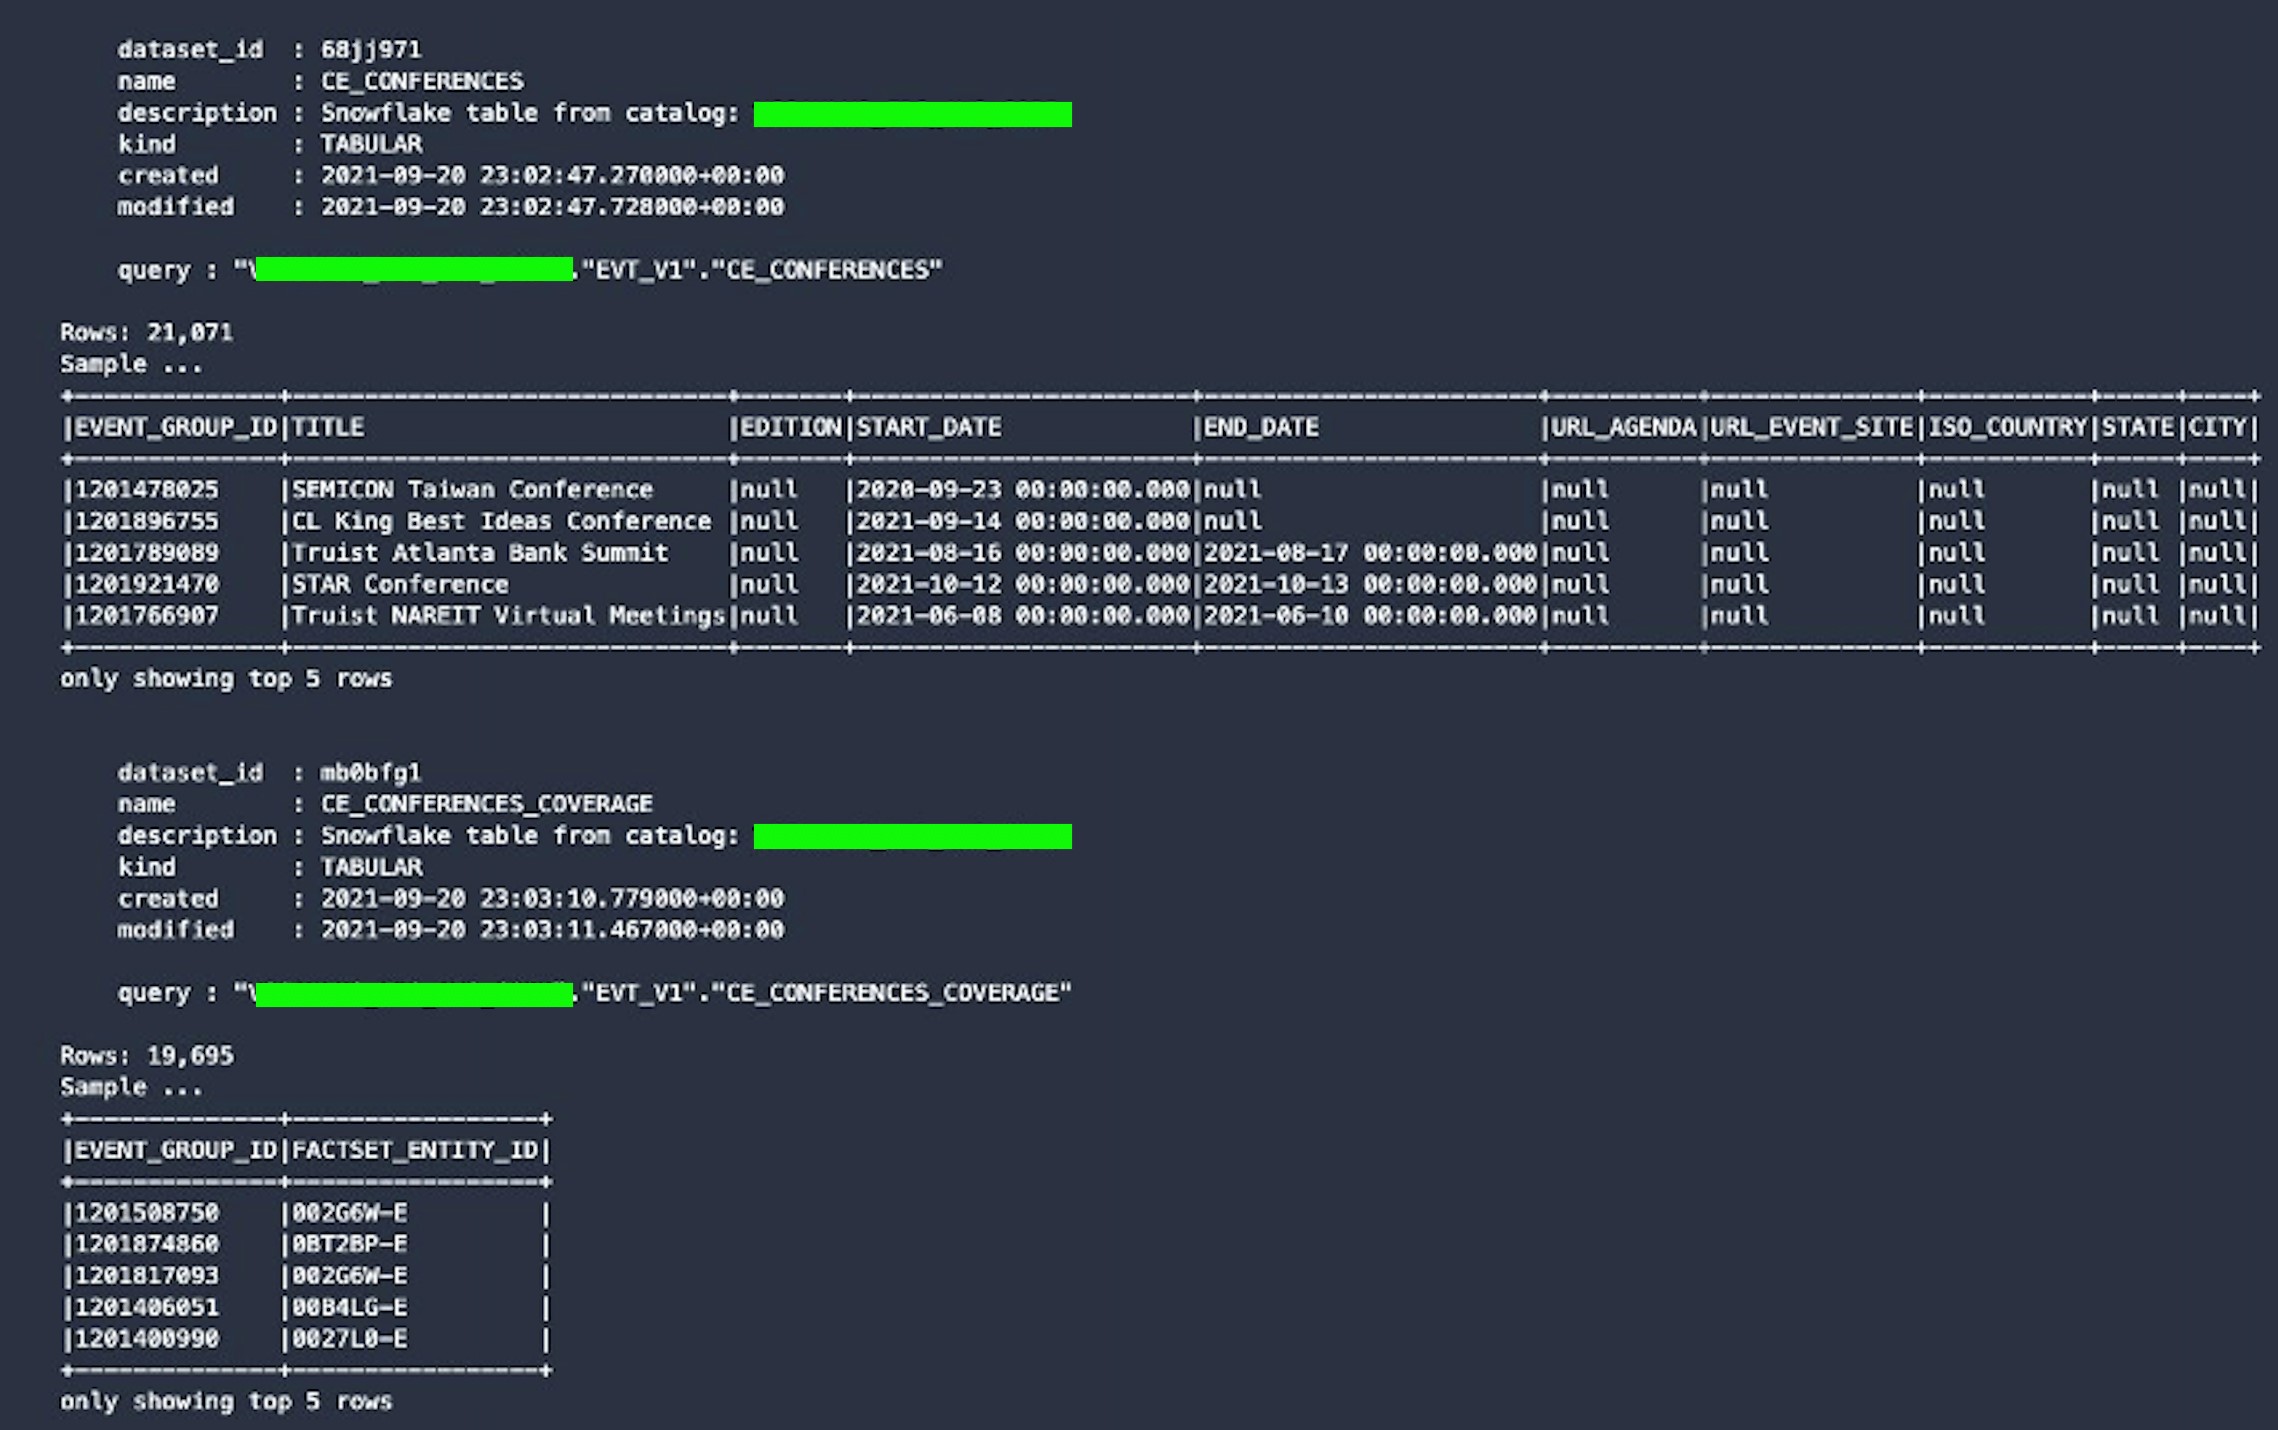
- Run the next cell which will query FinSpace for all datasets that have a ‘Source’ classification of ‘Snowflake’ and then print out the dataset details and sample the dataset itself from Snowflake.

- After this code is run, a blue progress bar appears and takes a few minutes. Once complete, an output similar to the one below appears which is a sample for two datasets.
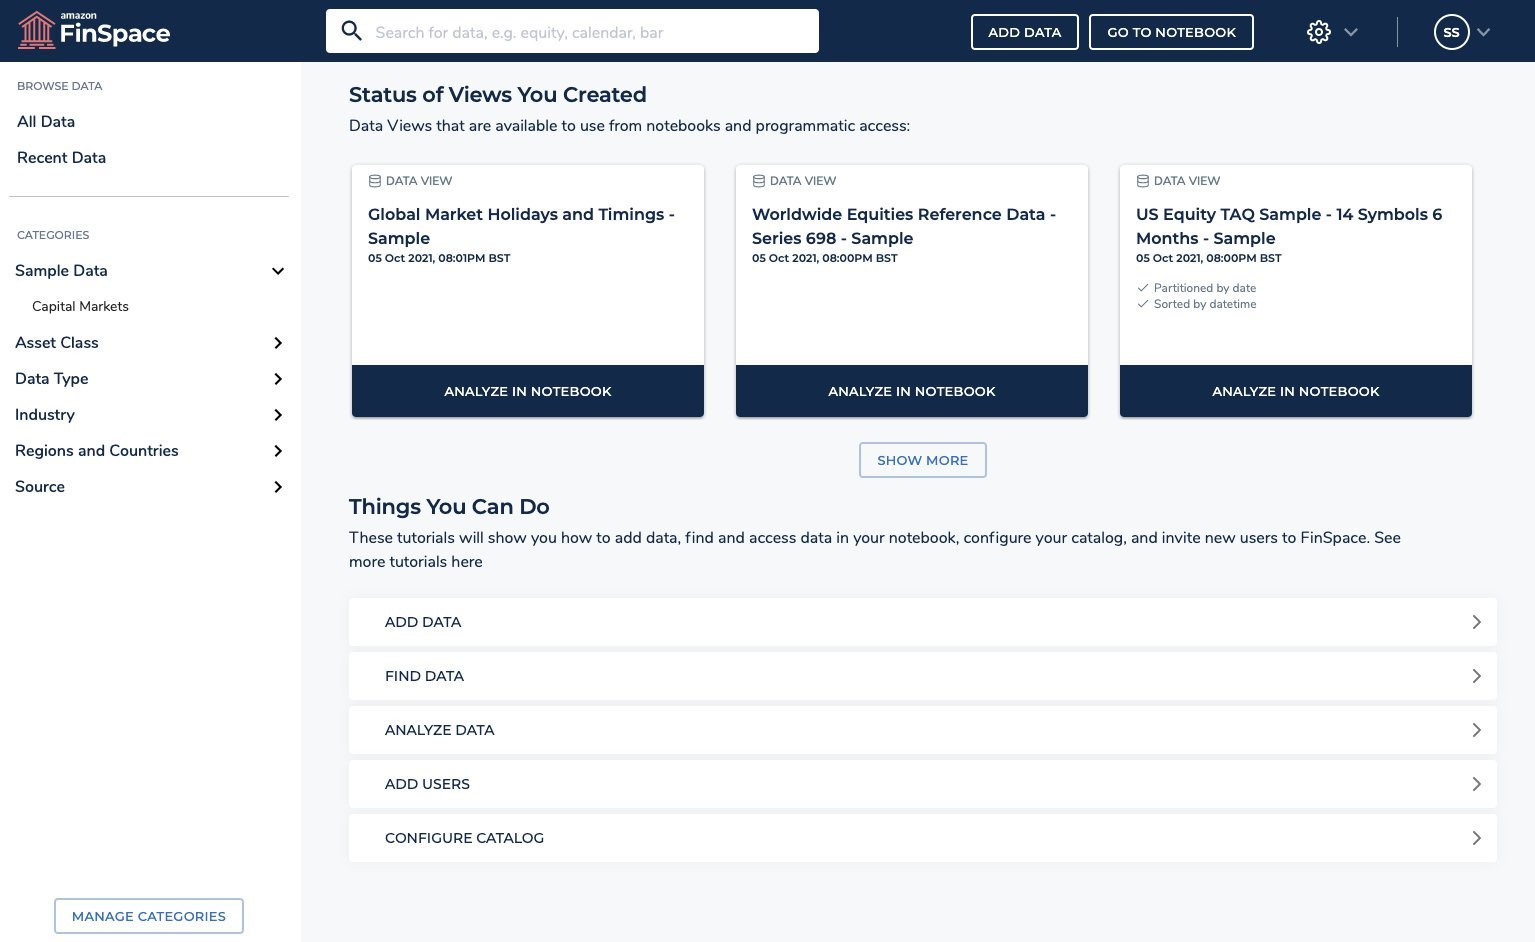
Search the FinSpace catalog for data
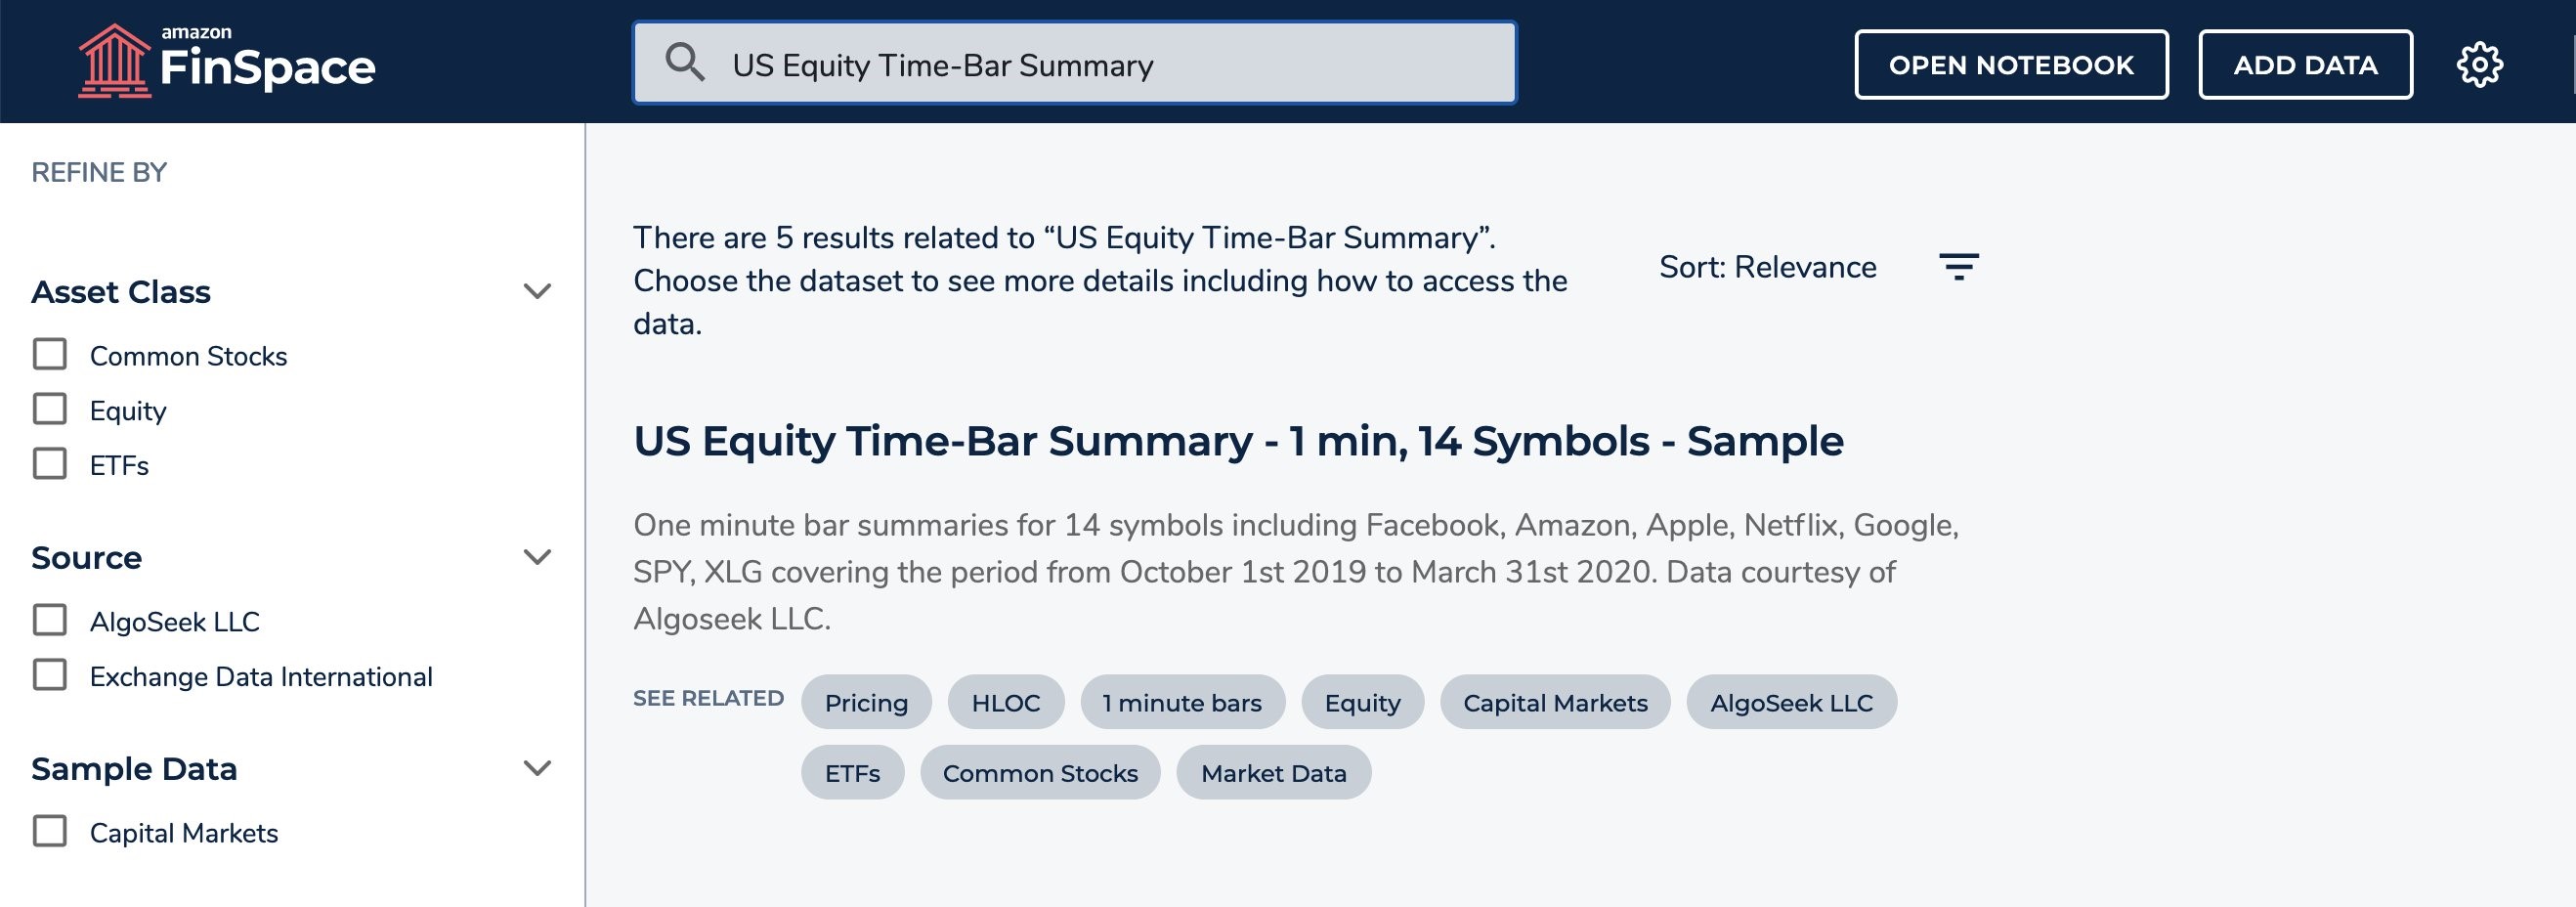
Analysts can search for datasets available to them in FinSpace and refine the results using category filters. To analyze stock volatility in the next section, we need to find two datasets: all trades of AMZN stock, and the events corresponding to stock volatility.
To explore the dataset schema and attribute set, search for “US Equity Time-Bar Summary” to find the “US Equity Time-Bar Summary – 1 min, 14 Symbols – Sample” dataset and the ‘CE_EVENTS’ dataset provided as part of the Capital Markets Sample Data Bundle.

Snapshot data
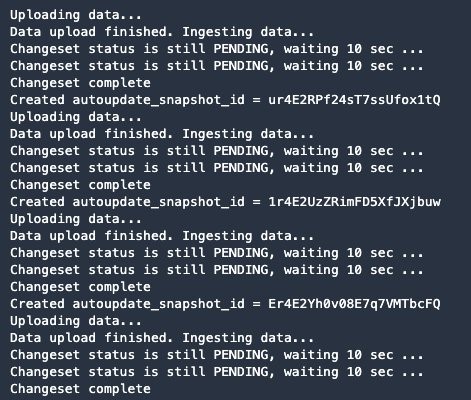
Run the code in this step to snapshot all Snowflake sourced data into FinSpace by ingesting the current data in Snowflake as a new ‘Changeset’. This ‘Changeset’ then represents the current state of the data in Snowflake.
This may take 5-10 minutes based on the number of datasets being uploaded, so you will see a blue progress bar. The output from executing this step will be similar to the following sample.
This completes all the steps in the snowflake_datasets.ipynb Jupyter notebook. You now have a set of datasets within FinSpace that can be used for analysis which we’ll see in the next section.
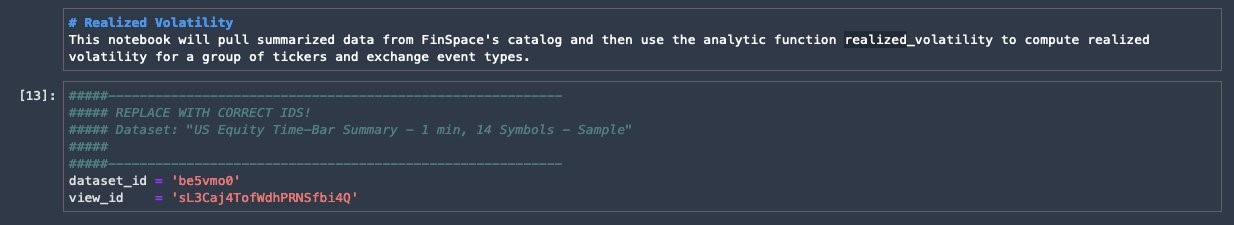
Realized volatility
In this section we will pull summarized data from FinSpace catalog and then use the analytic function realized_volatility to compute realized volatility for a group of tickers and exchange type events.
Double click on the snowflake_import.ipynb notebook and select the FinSpace PySpark latest kernel.
- Run the first cell to start the Spark cluster. Once the connection is established, a “connected to cluster” message appears.
Configure Spark for Snowflake
- Run the next two cells to add the JDBC driver to Spark jars and assign values read from the previously uploaded snowflake.ini file.

- Run the next five cells to send the values to the FinSpace Spark instance.

- Run the next cell to provide Snowflake options for the Spark data source.

Python Helper Classes
- Run the next cell under ‘Python Helper Classes’ to import the text.

- Run next code to initialize the FinSpace helper.

- The next cell requires dataset_id and view_id of the ‘US Equity Time-Bar Summary’ dataset.

- Login to the FinSpace environment, search for ‘US Equity Time-Bar Summary’, click on dataset from the search results.

- Click on ‘ALL DATA VIEWS’.

- Click on ‘Details’ link located under the ‘Data Views’ section and copy the ‘Data View ID’ and ‘Dataset ID’.

- Navigate back to the plot-volatility-snowflake.ipynb notebook and paste values as shown below and run the cell.
- Run the next cell to import required libraries, including for time series, and read the event dataset into a DataFrame.

Spark analytics
All FinSpace analytics functions has help documented. Run the cell below to display help information for ‘realized_volatility’.

Calculated realized volatility
Run the following cell to calculate the realized volatility of the time-series data.

Realized volatility graph
This section plots the realized volatility.
- Calculations are performed on the cluster.
- Results are then collected to the driver as a Pandas DataFrame.
- The plot image is created from Pandas data.
- The plot image is sent to the local notebook for display.
Run the following cell to calculate the realized volatility and plot the graph. This takes a few seconds and a progress bar appears several times before the plot is displayed.

In the following screenshot you see a spike in the volatility graph plotted after importing libraries, sampling the data and using the Time series analysis to compute volatility.
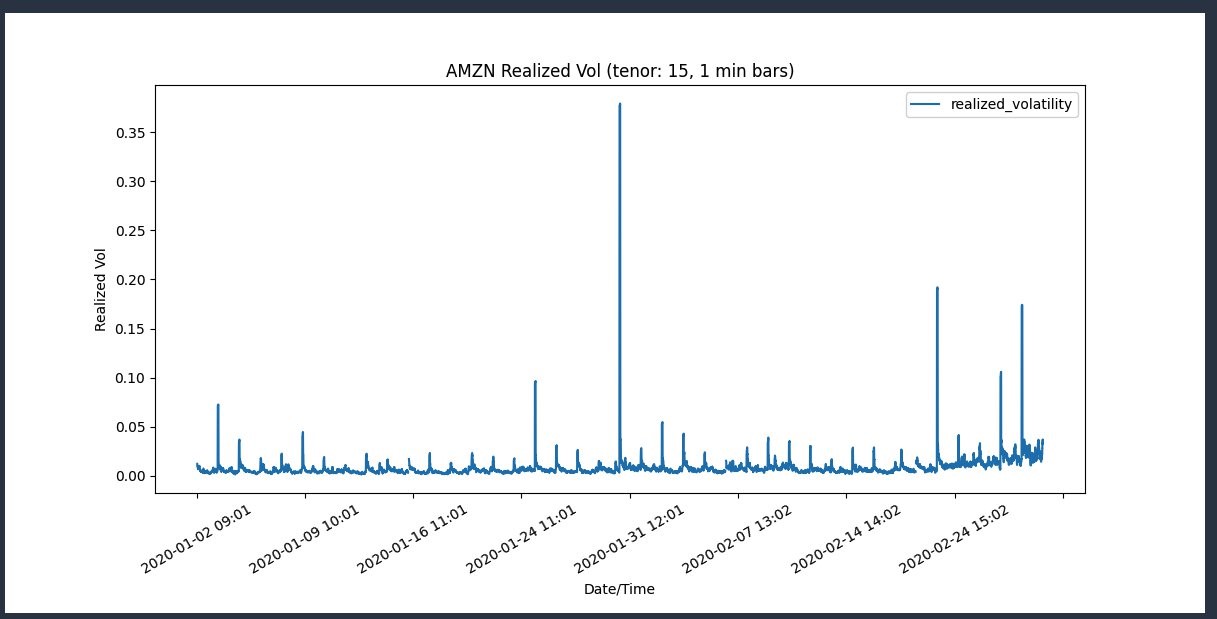
Reference: Amazon soars after huge earnings beat (CNBC).
Incorporate events from FactSet
We can incorporate events data from Snowflake and add it to the realized volatility graph plotted above. FactSet provides event data called FactSet Events in the Snowflake Marketplace documentation.
In the following code, dataset IDs of the data as registered in the FinSpace catalog need to be replaced.

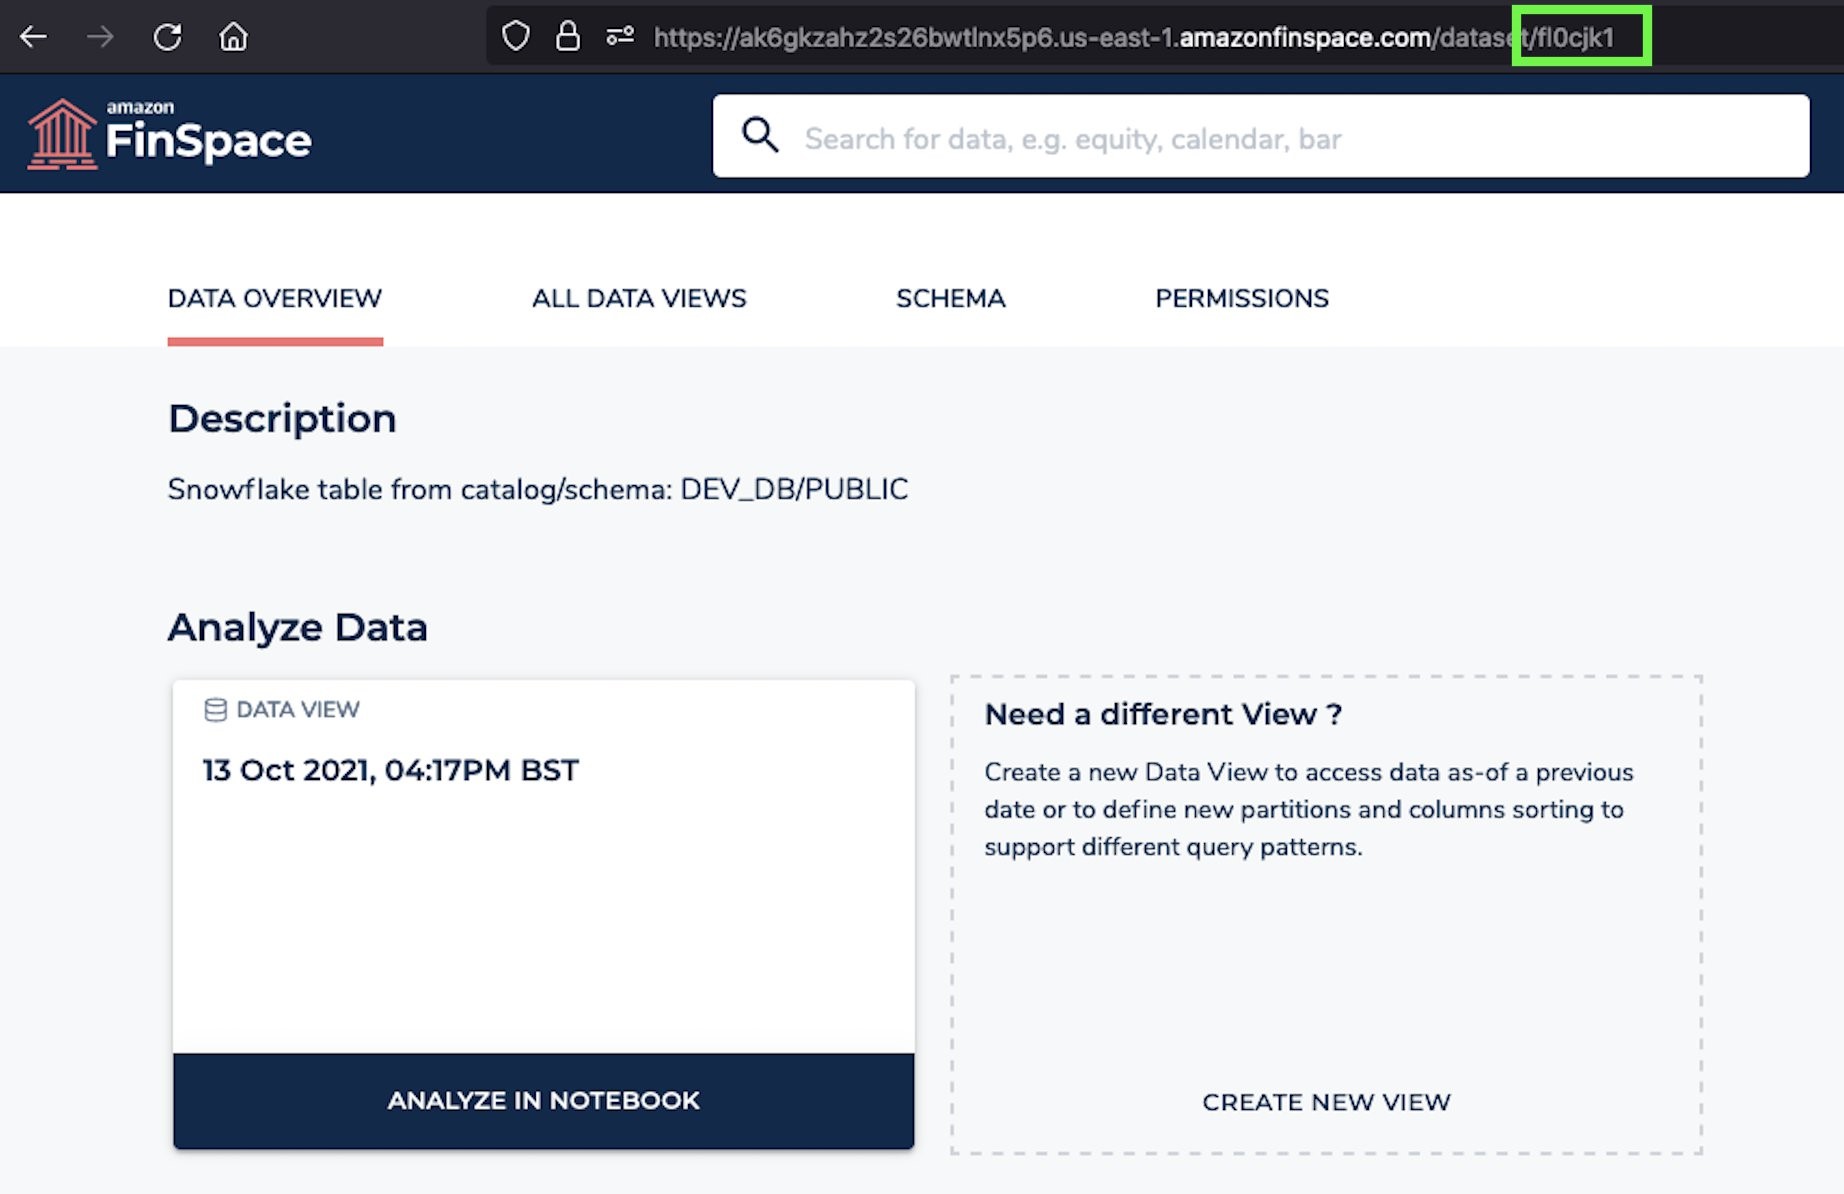
- To find the dataset ID for each of the datasets, use the search functionality within the FinSpace environment. Search for sym_ticker_region within the FinSpace environment and click the dataset.
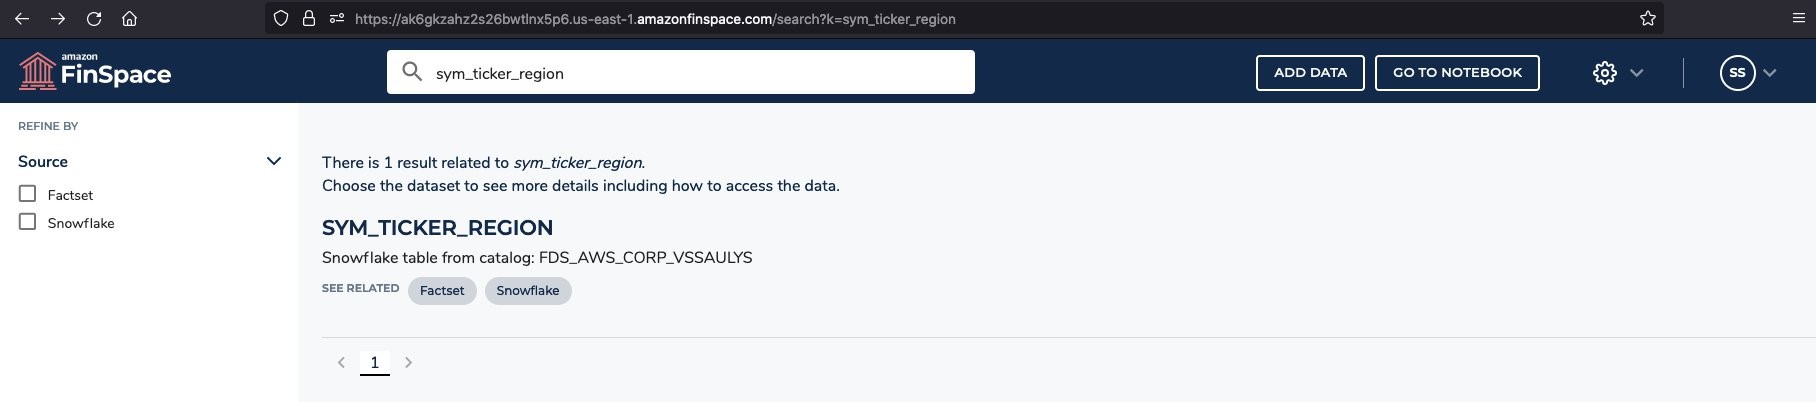
- Copy the dataset ID located in the URL.

- Paste the copied dataset ID in the ‘Incorporate Events from FactSet cell of the plot-volatility-snowflake.ipynb notebook.

Repeat the steps 1-3 for each of the datasets i.e sym_coverage, sym_entity, ce_events, ce_reports, and ce_sec_entity_hist.
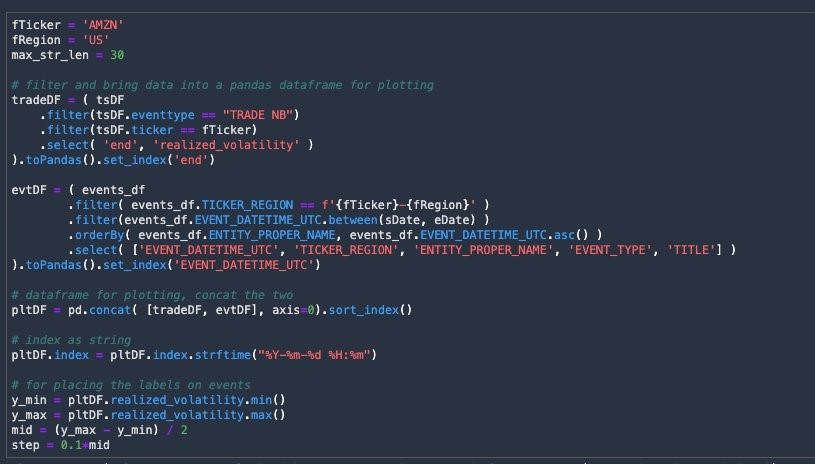
After replacing the dataset IDs for the six datasets, the code should look similar to the following.

Utility functions
Run the next cell to use Snowflake’s metadata in FinSpace to query the data in Snowflake, creating a Spark DataFrame based on the Snowflake table.

Create DataFrames from Snowflake tables
1. Run the following code to create Spark DataFrames from Snowflake tables, using the information about their location that was registered in FinSpace’s catalog.
2. Run the next cell for the Spark DataFrame operations to join the data on necessary keys.
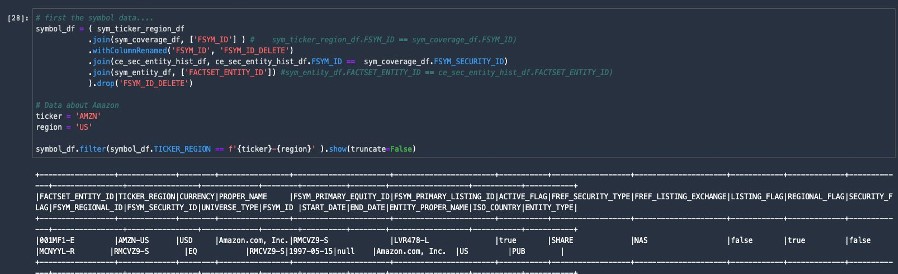
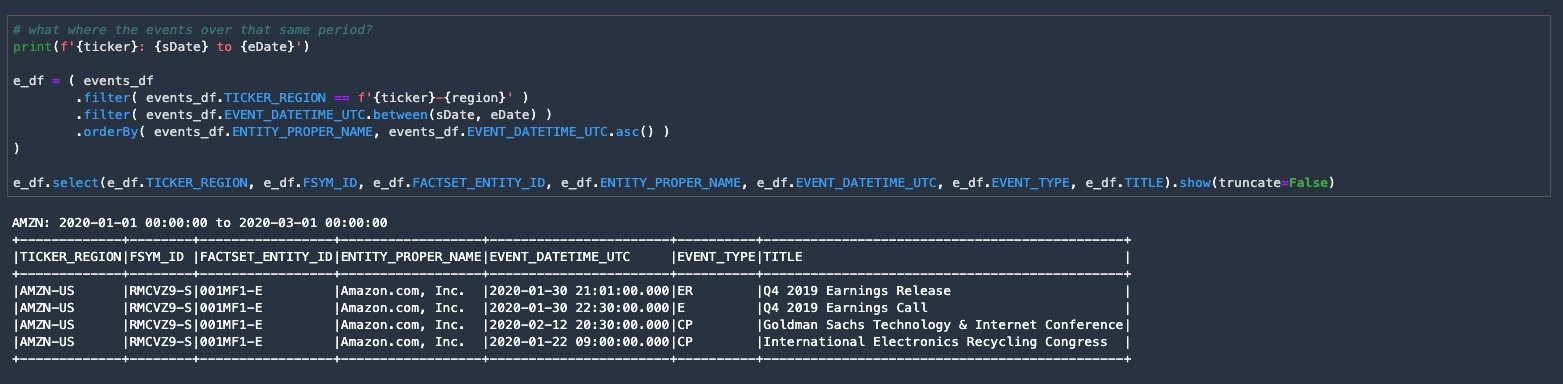
3. Run the next cell to pull in the events.

4. Run the next cell to see the events that occurred during that same period.
Plot with events
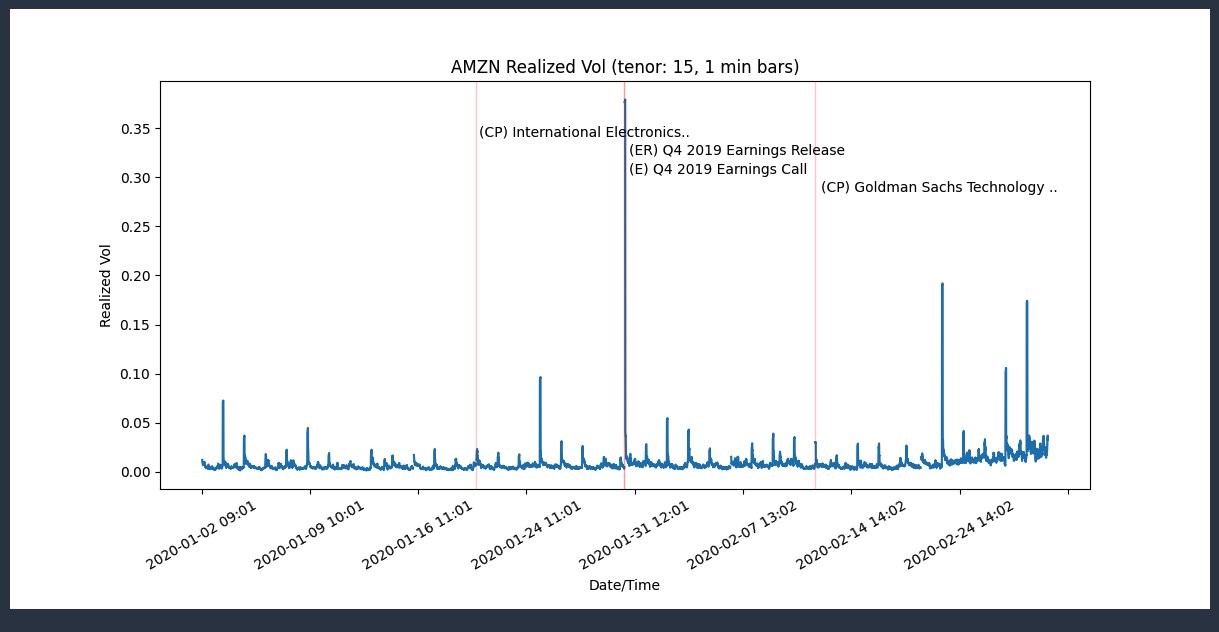
In this section, the events labeled vertical lines are added to the original plot.
1. Run the next cell. This step may take a few seconds and a blue progress bar appears and no output is displayed.
2. Run the next cell to plot the graph.

The following output is displayed where the red vertical lines signify the events and are overlayed with the original volatility plot.
Save the data to Snowflake
Analysts may want to share the data they used to plot the volatility with a table in Snowflake. Any data created in FinSpace can be saved within the FinSpace environment. The original Time Series volatility computation DataFrame can be used along with Snowflakes functionality to write the data to Snowflake. Run the following cell to save the data.

Write to Snowflake
Run the following cell to write this data to Snowflake.

Read data from Snowflake
To demonstrate the data was successfully written to Snowflake, run the following cell to read the data.

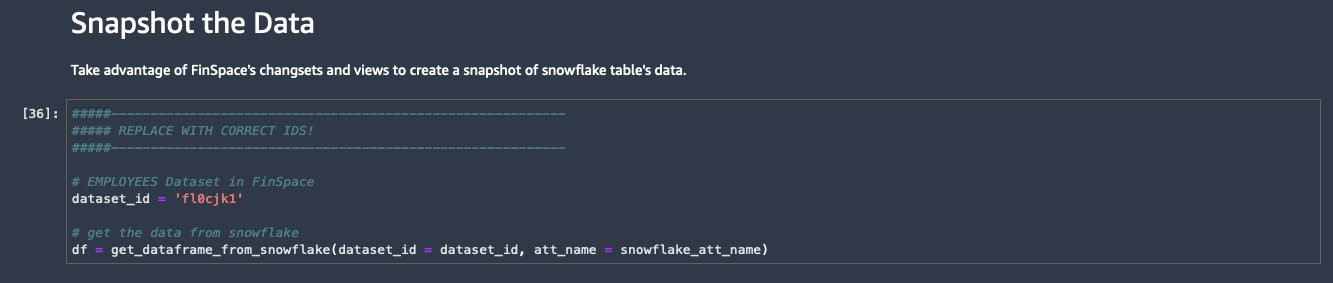
Snapshot the data
The ‘CE_EVENTS’ dataset used in the prior section had no ‘Views’ or ‘Changesets’. You may want to work with a point in time static snapshot of the data you were working with. This can easily be done in FinSpace. In this section, we will take advantage of FinSpace ‘Changesets’ and ‘Views’, to create a snapshot of Snowflake table data.
We will use another dataset to demonstrate how snapshots are created within FinSpace.
- Search for the ‘Employees’ table within the FinSpace environment and copy the dataset ID from the URL.
- Return to the plot-volatility-snowflake.ipyn notebook and paste the previously copied dataset_id and run the next three cells.
- Run the next cell to add the ‘Changeset’ to the dataset.


In this section we calculated realized volatility and the results were collected as a Pandas DataFrame. We then plotted a graph from this data which was displayed in the notebook.
Cleaning up
If your work with Amazon FinSpace and Snowflake is complete, delete your Snowflake database and your FinSpace environment to avoid incurring additional fees.
Conclusion
In this post, we have reviewed how to connect to Snowflake from a FinSpace Jupyter notebook and created new datasets in FinSpace using the table metadata from the Snowflake database. We also explored how to search for data available in the FinSpace web application to locate two datasets to help evaluate Amazon stock volatility and events causing this volatility. As a result, we eliminated the need to copy data into FinSpace, access the data from where it resides while leveraging the catalog within FinSpace to find and discover data.
Visit the FinSpace user guide to learn more about the service, or contact us to discuss FinSpace or Snowflake in more detail. The demo of this blog is published at Snowflake’s Financial Services Data Summit titled ‘Making Financial Data More Accessible in the Cloud’.
To learn more about how you can use FinSpace to analyze daily trading activity using transactional data from Amazon Redshift visit this blog.