The Internet of Things on AWS – Official Blog
Create insights by contextualizing industrial equipment data using AWS IoT SiteWise (Part 2)
Introduction
In the first part of this blog series Create insights by contextualizing industrial equipment data using AWS IoT SiteWise (Part 1) we focused on asset modelling and real-time analytics in AWS IoT SiteWise. We created a dashboard in AWS IoT SiteWise Monitor to get a real-time overview of our furnace heating cycles. But we concluded that a more in-depth analysis was needed to find the root cause of the abnormal heating cycle of Furnace1. In this second part of the blog, we will show how customers can use the AWS IoT SiteWise cold tier storage feature to export the raw, aggregated and meta-data to AWS IoT Analytics for further analysis.
Enable AWS IoT SiteWise cold tier storage and AWS IoT Analytics export
AWS IoT SiteWise cold tier storage feature makes it easy to consume historical data in downstream AWS analytic services. Additionally, it will also lower your storage cost on AWS IoT SiteWise by exporting historical data to Amazon S3. Customer can freely define how long the data will be kept in the time-series optimized AWS IoT SiteWise data before being exported into S3 by setting a data retention threshold.
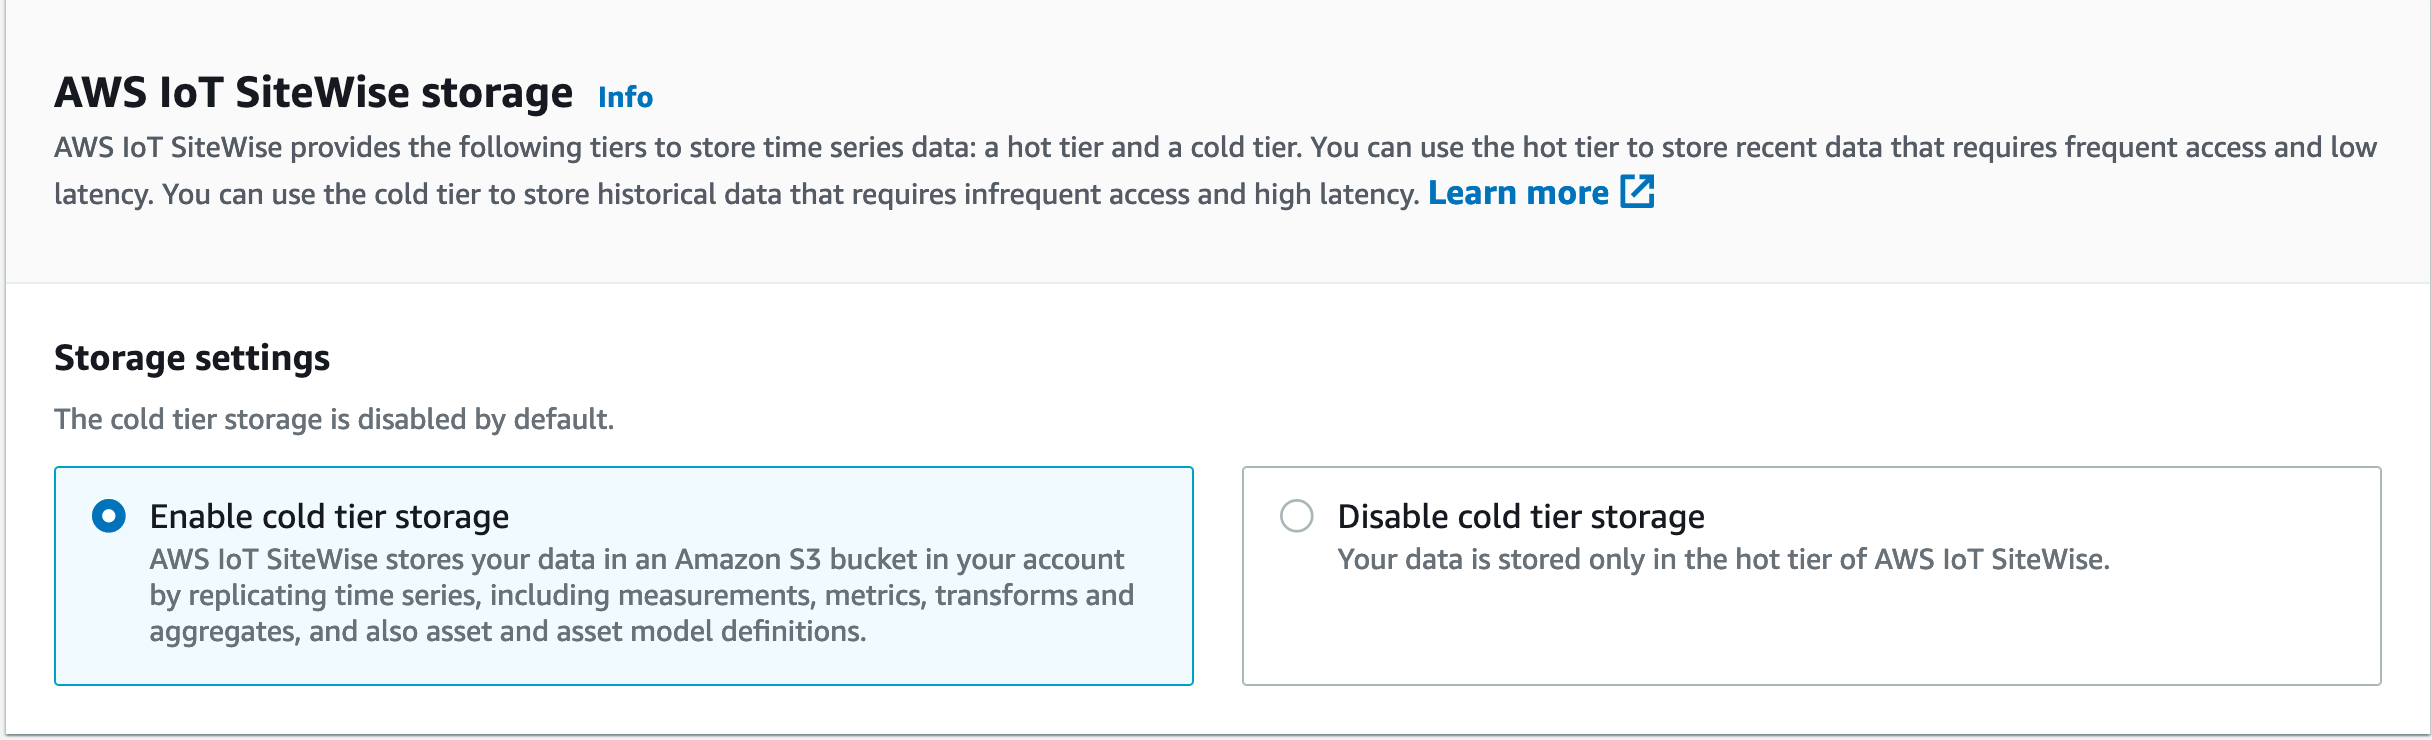
Enabling AWS IoT SiteWise cold tier storage
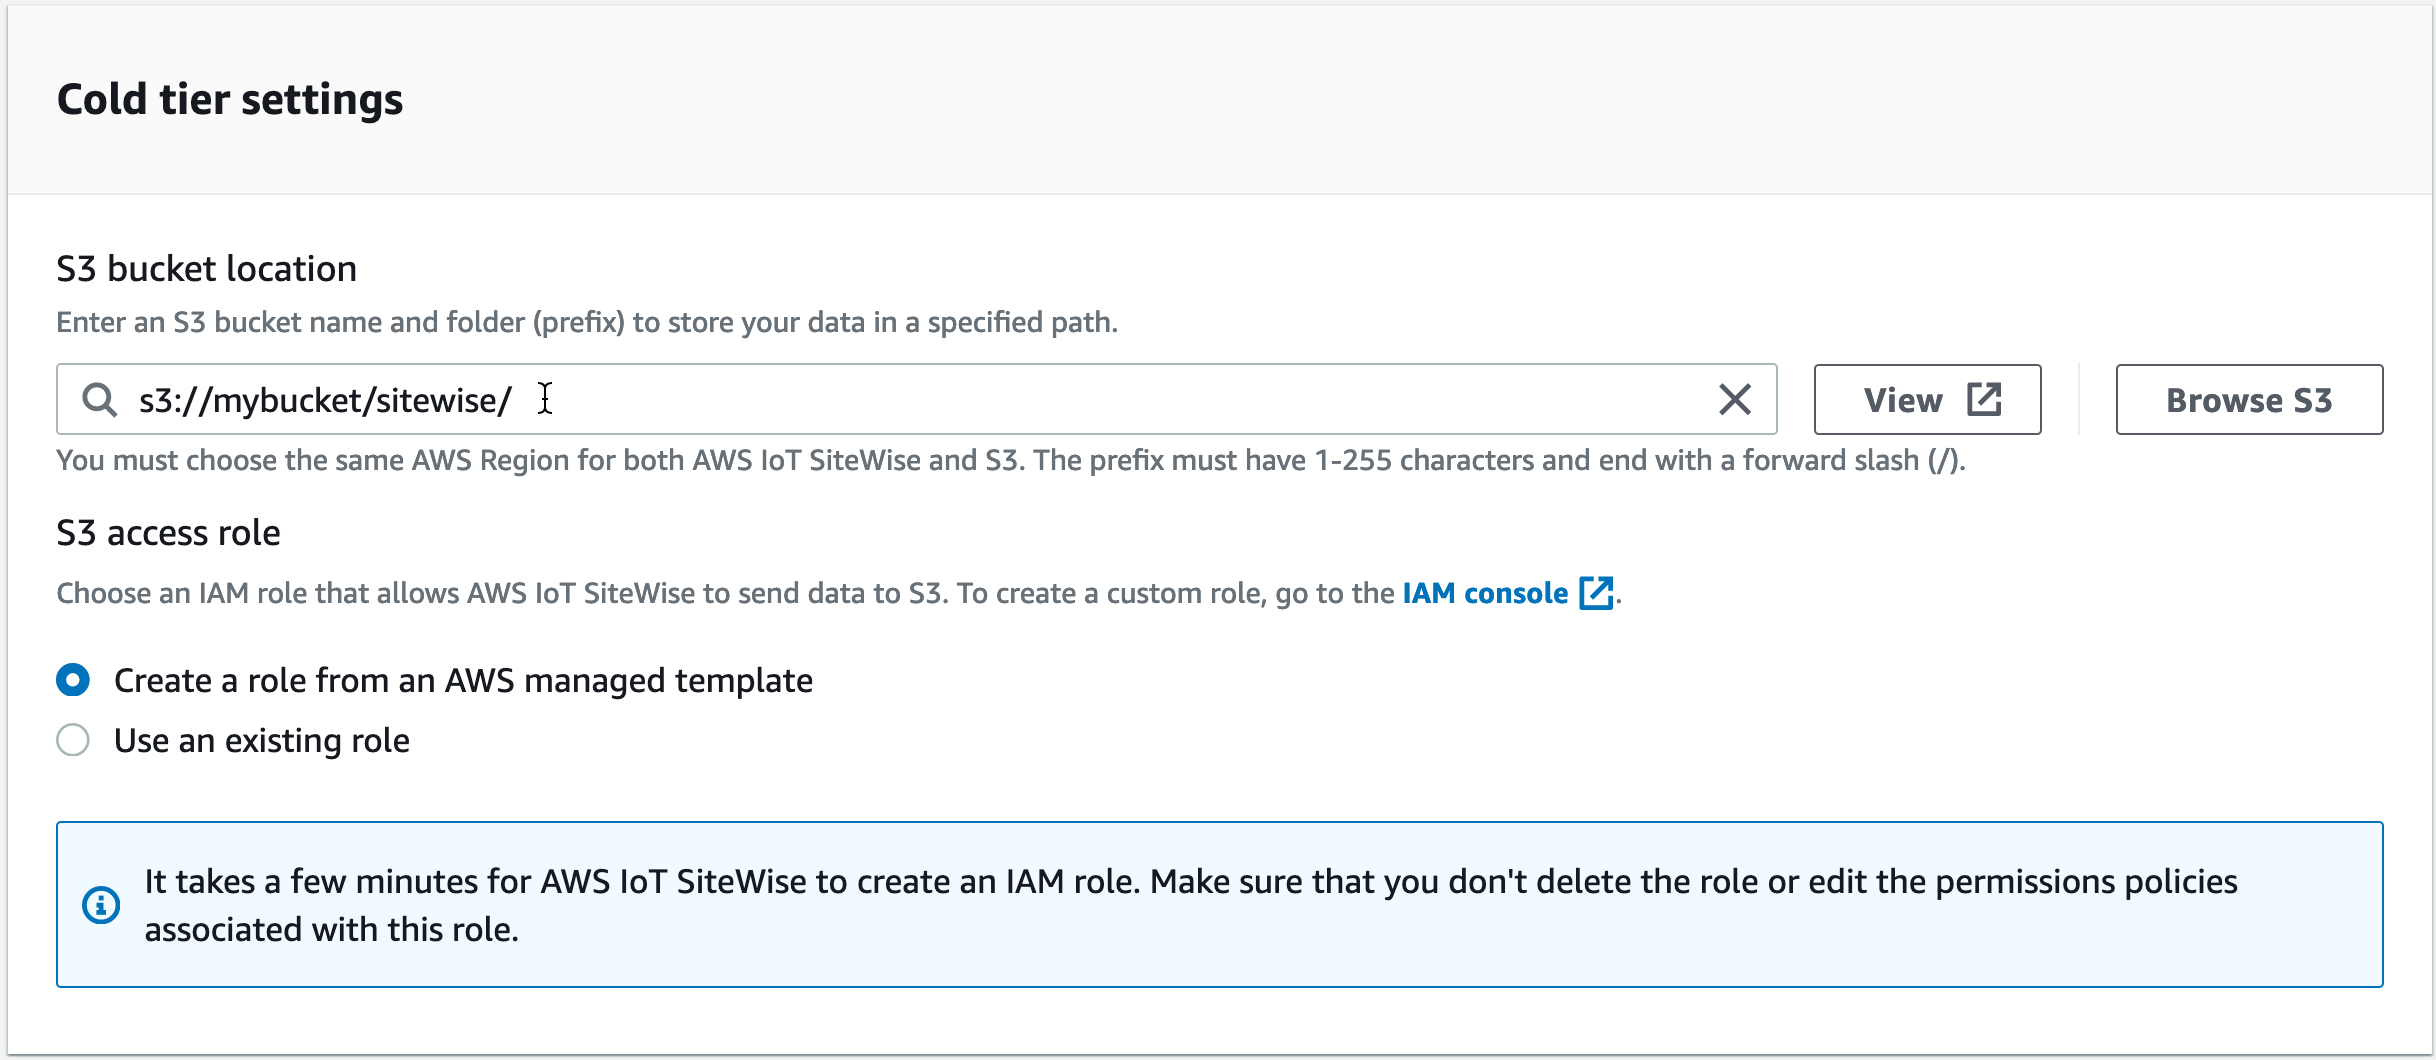
To enable AWS IoT SiteWise S3 export, open the AWS IoT SiteWise console, choose Settings, Storage, Edit in the navigation pane and check Enable Cold tier storage,
Enter an existing S3 bucket location in the same AWS region,
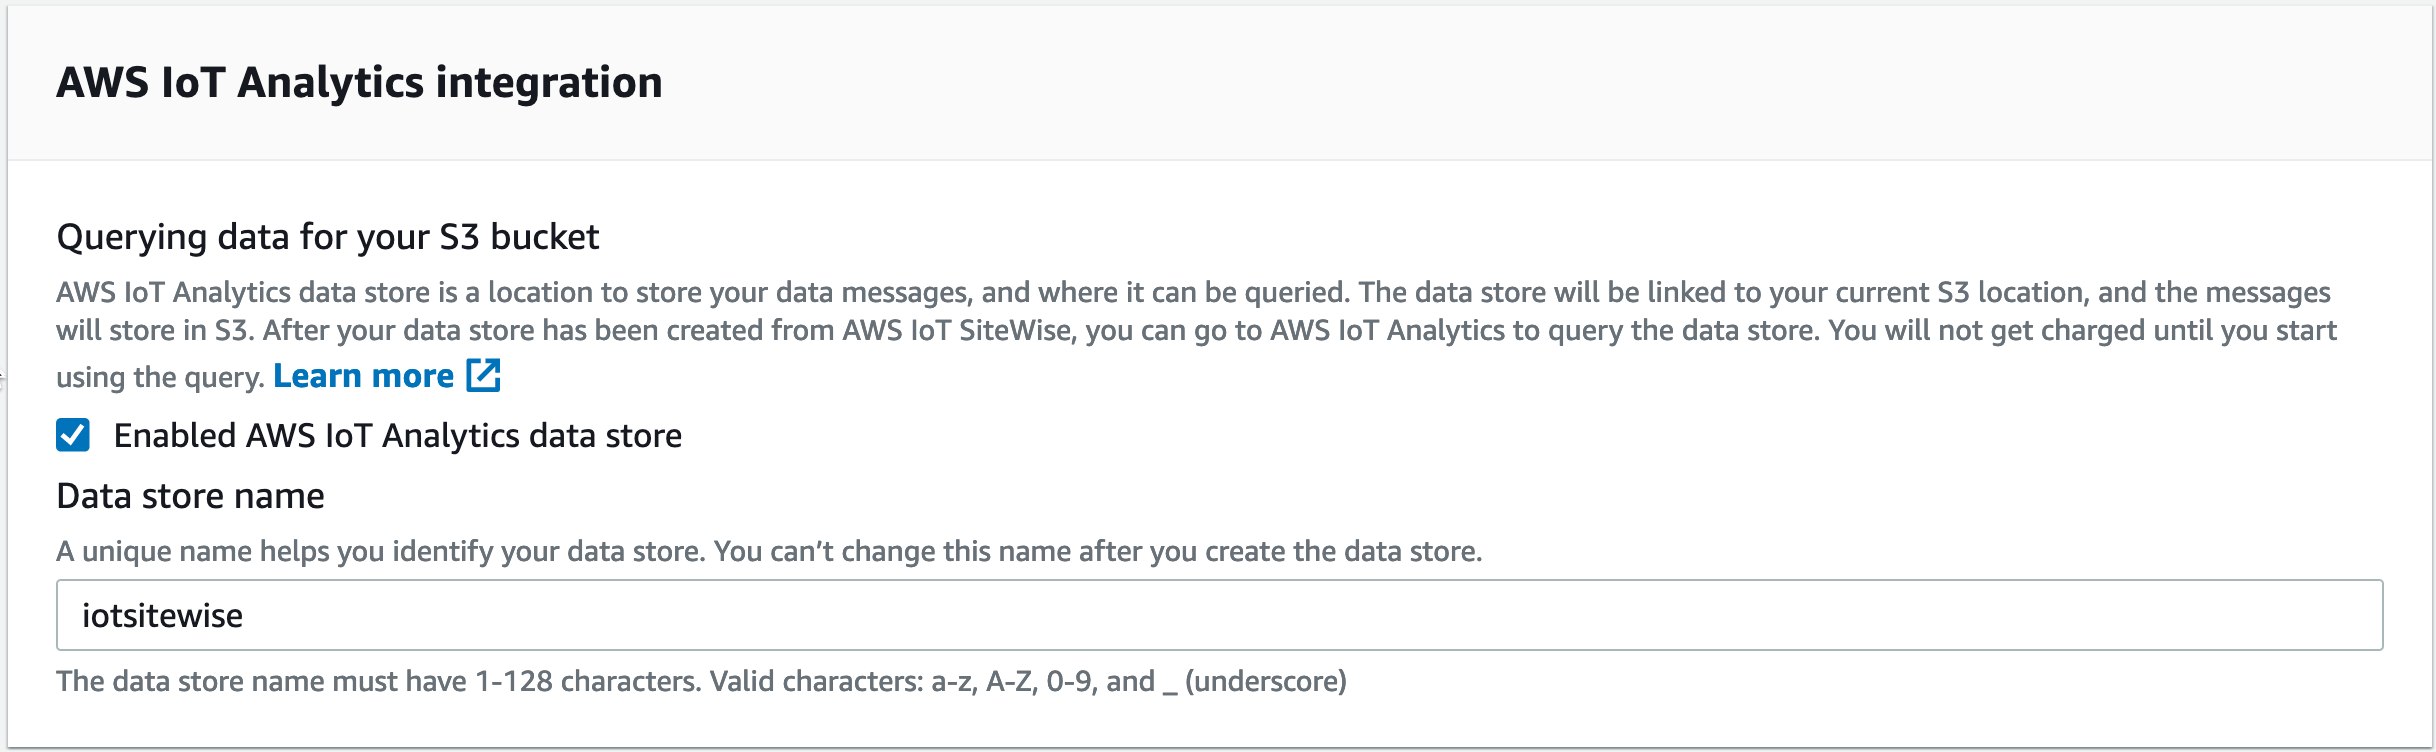
Check Enable AWS IoT Analytics data store, type iotsitewise as the Data store name and choose Save
For this walk through we will use AWS IoT Analytics to query the data and visualize it in Amazon QuickSight.
The AWS IoT SiteWise S3 export feature exports information on asset properties from the asset model into the asset-metadata S3 prefix when the model change. Once the status of the S3 export is enabled, you should see a line delimited JSON file per asset in your S3 bucket. The raw data is exported every 6 hours and will be placed into the raw S3 prefix. For more details on the export format and location, see File paths and schemas of data saved in the cold tier.
Create an AWS IoT Analytics dataset to analyze the raw data
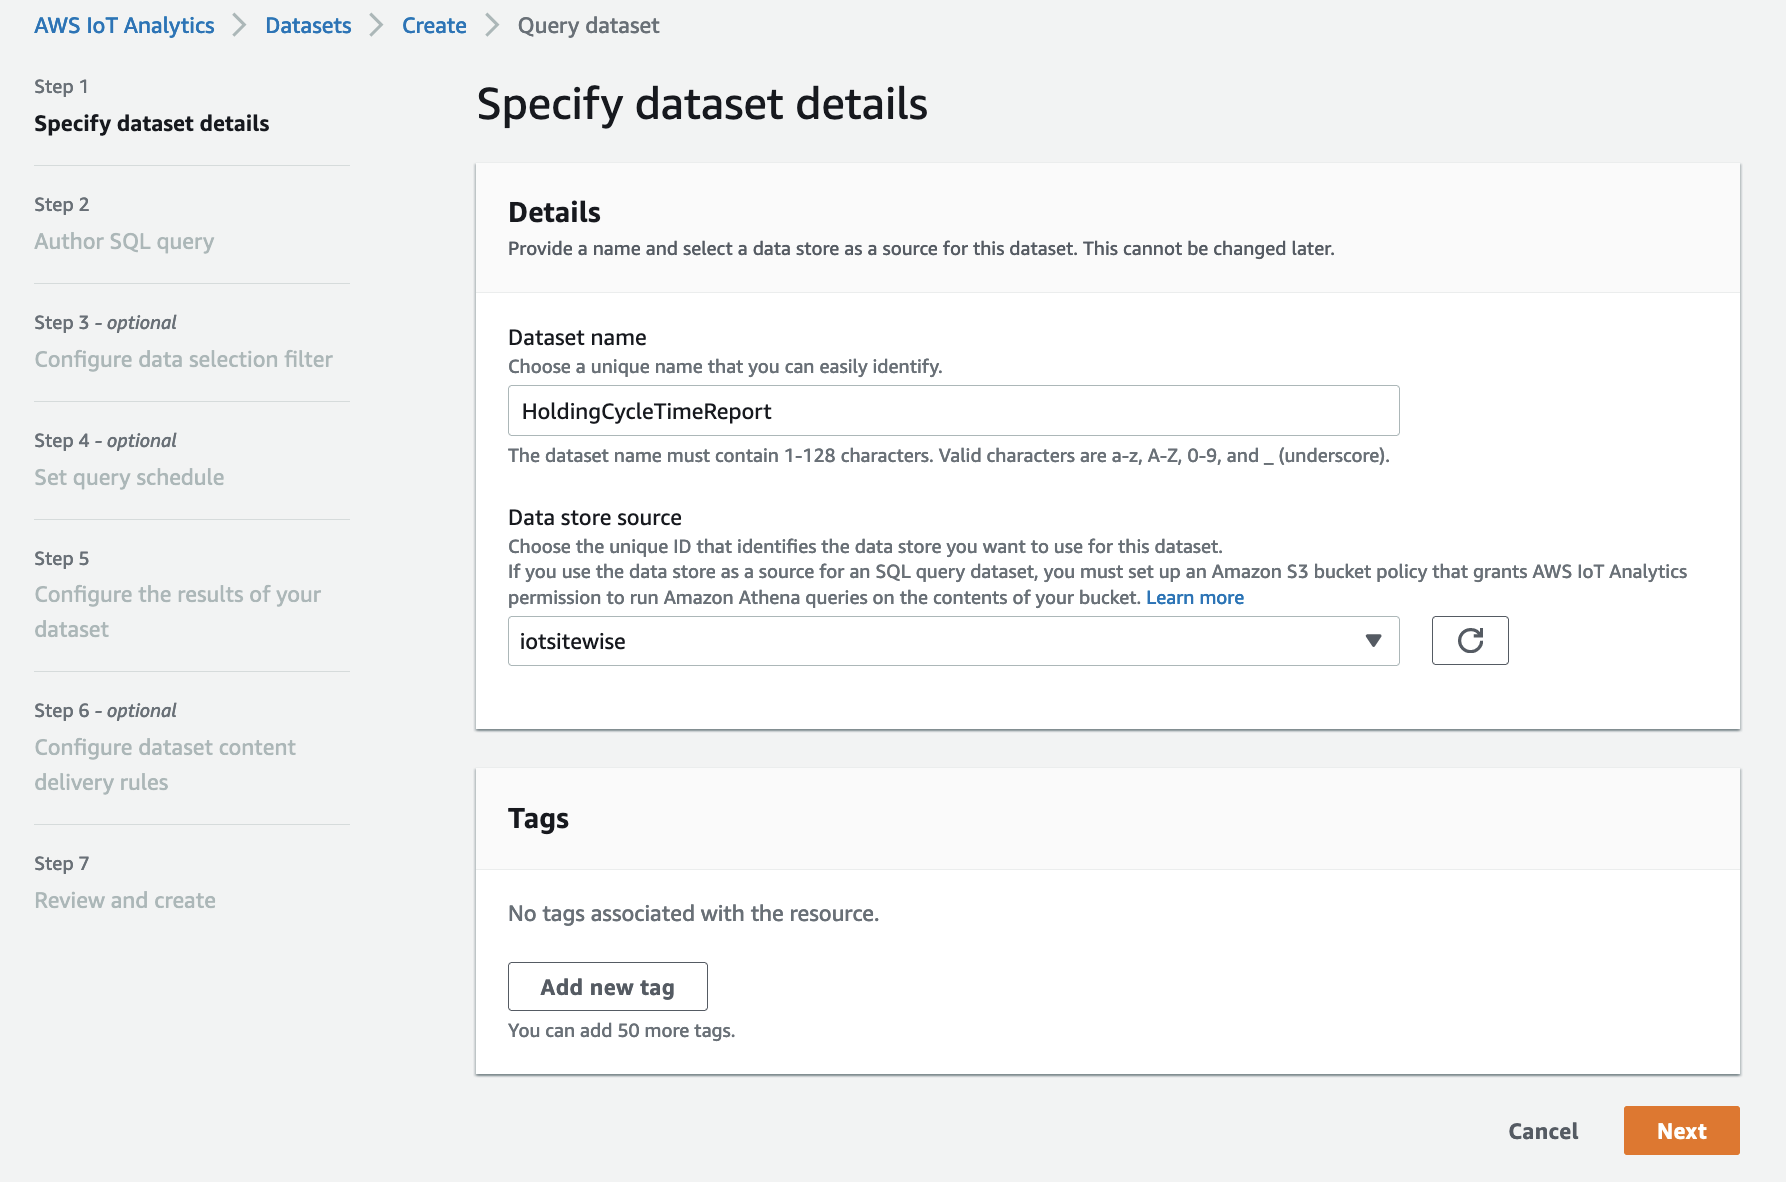
We can now start to analyze the AWS IoT SiteWise exported data with AWS IoT Analytics. Open the AWS IoT Analytics console, choose Datasets in the navigation menu and choose Create dataset, Create SQL. This will open a wizard that will guide you through the Dataset creation. On the first screen name your data set and choose the iotsitewise data store that was created by the AWS IoT SiteWise cold tier export wizard.
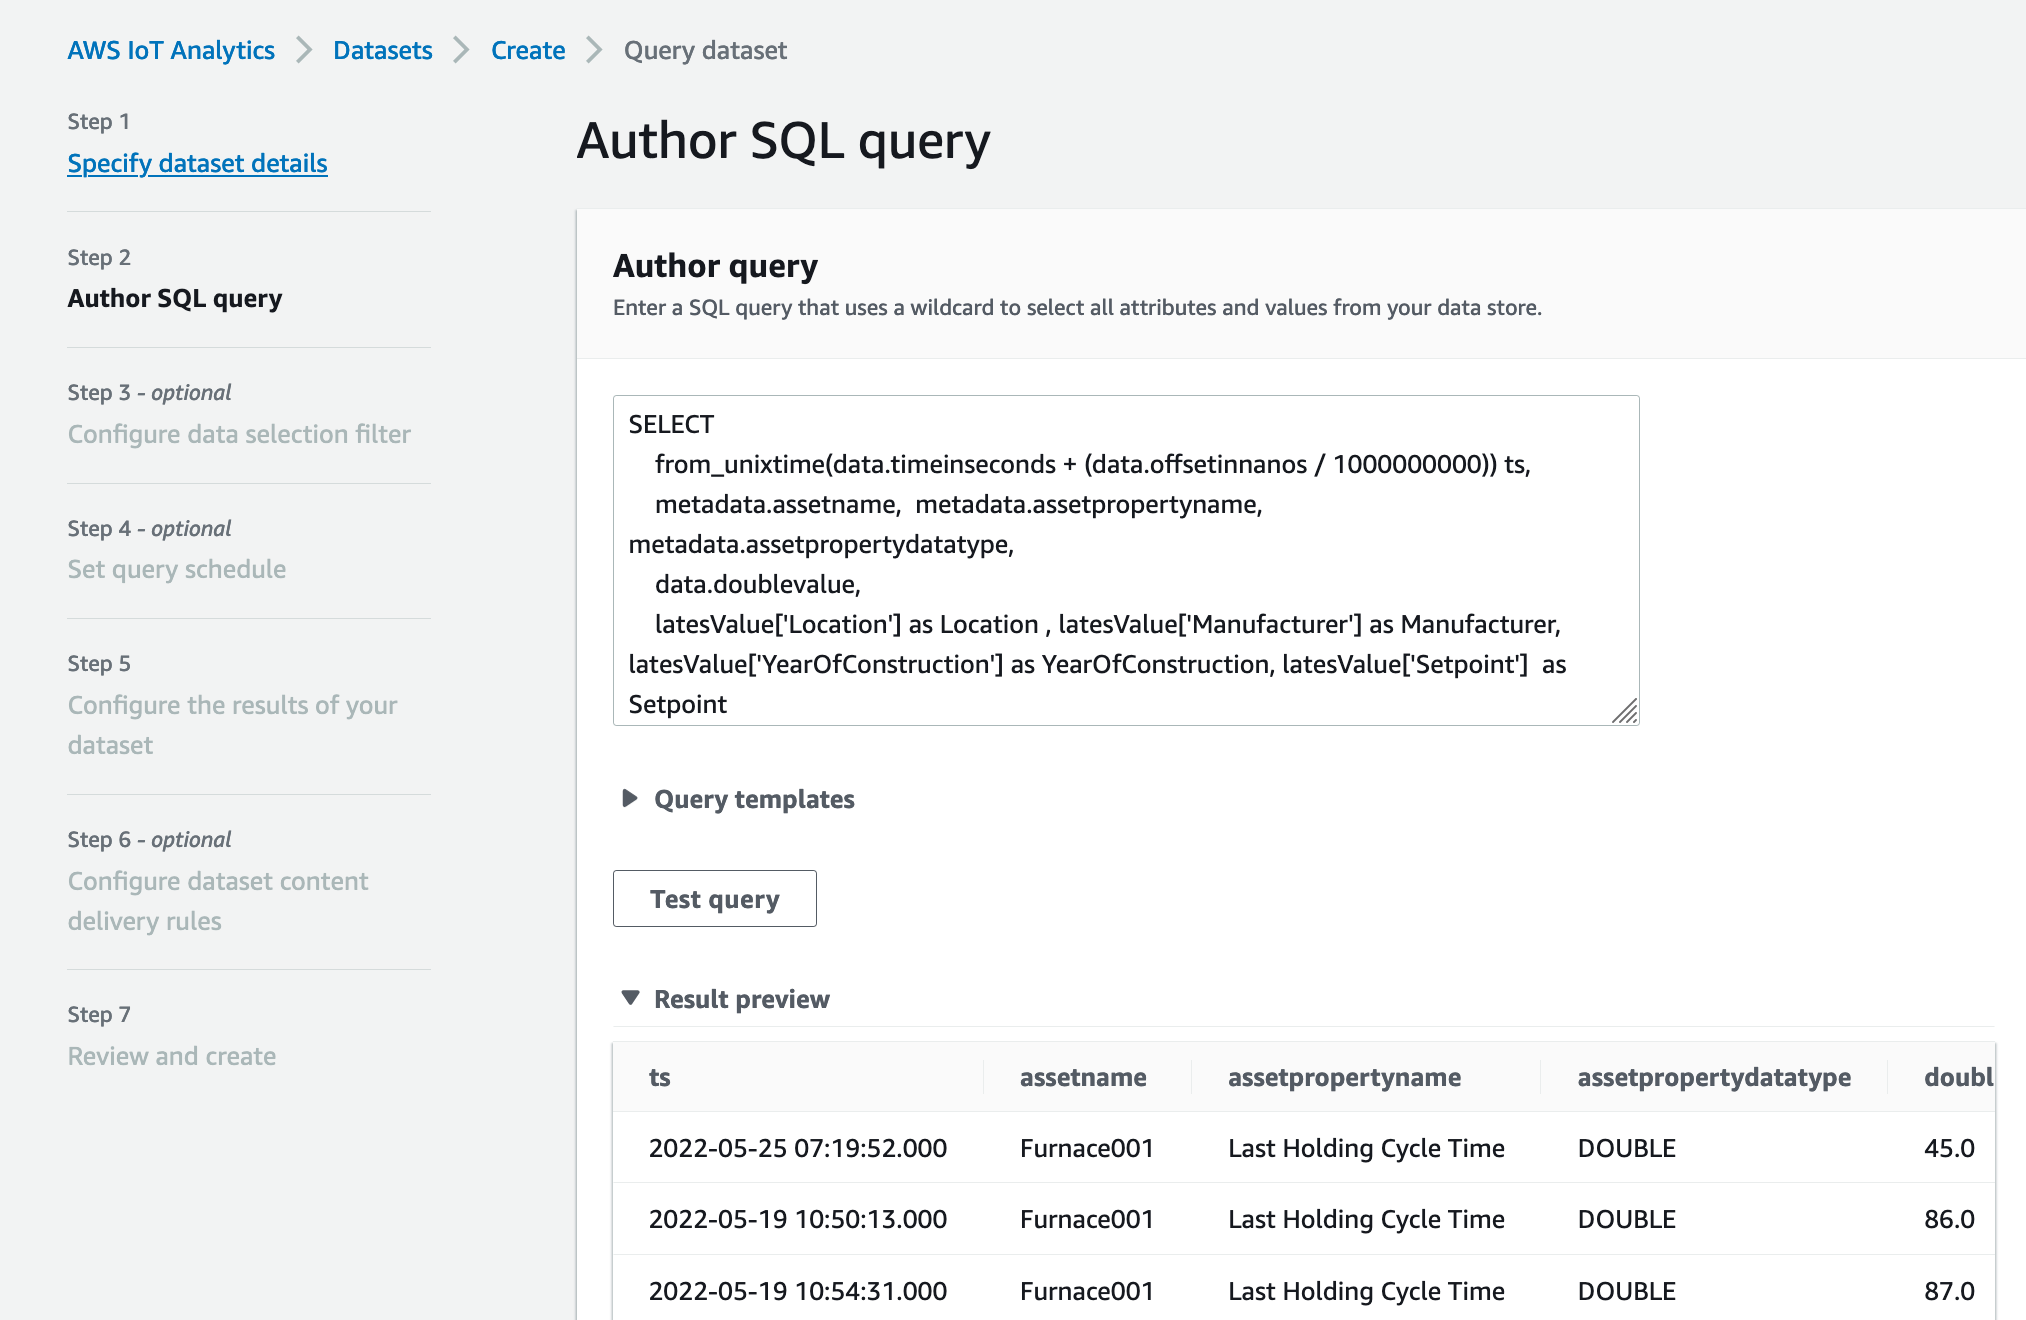
Choose Next to open the Author SQL query dialog, copy and past the sample query below.
The query used some advanced Athena SQL features and also demonstrated how AWS IoT Analytics Dataset queries can be used to join data from different AWS IoT Analytics data stores. For this analysis, we want to query the metric Last Holding Cycle Time for all our assets in the current month. To accomplish this, the query starts from the raw data store filtered by a specific month. It joins the asset_metadata data store to retrieve the property metadata like the asset name. Finally, it joins the asset_metadata again, but this time grouped by asset ID. This last JOIN statement retrieves all static attribute of the corresponding AWS IoT SiteWise asset and adds it to the result row. This data is crucial for our analysis, because we will use it in our last step as dimensional data.
SELECT
    from_unixtime(data.timeinseconds + (data.offsetinnanos / 1000000000)) ts,
    metadata.assetname,  metadata.assetpropertyname, metadata.assetpropertydatatype,
    data.doublevalue,
    latesValue['Location'] as Location , latesValue['Manufacturer'] as Manufacturer,
    latesValue['YearOfConstruction'] as YearOfConstruction, latesValue['Setpoint'] as Setpoint
FROM iotsitewise.raw  as data
-- Join the meta data table
INNER JOIN iotsitewise.asset_metadata as metadata
ON data.seriesid = metadata.timeseriesid
-- Join sub query that retrieves all asset attributes and latest values
LEFT JOIN (
  SELECT assetid, map_agg(assetpropertyname, latestvalue) latesValue from (
    SELECT assetid,  assetpropertyid, assetpropertyname,
            coalesce (
            max_by(data.stringvalue, data.timeinseconds),
            max_by(cast(data.integervalue as VARCHAR), data.timeinseconds),
            max_by(cast(data.doublevalue as  VARCHAR), data.timeinseconds)
            ) latestvalue
    FROM iotsitewise.raw data
    INNER JOIN iotsitewise.asset_metadata metadata
    ON data.seriesid = metadata.timeseriesid
    GROUP BY assetid, assetpropertyid, assetpropertyname)
  GROUP BY assetid) as dim
ON metadata.assetid = dim.assetid
WHERE data.startyear = year(current_date)
AND data.startmonth = month(current_date)
AND metadata.assetpropertyname = 'Last Holding Cycle Time'
To test the query, choose Test query. If the query contains no syntax errors, you should see a preview of the data in the Result preview section.
Leave the rest of the steps 3-6 with the default value by choosing Next and choose Create dataset on the last review step 7.
To validate if everything is correctly setup, navigate to your newly created dataset
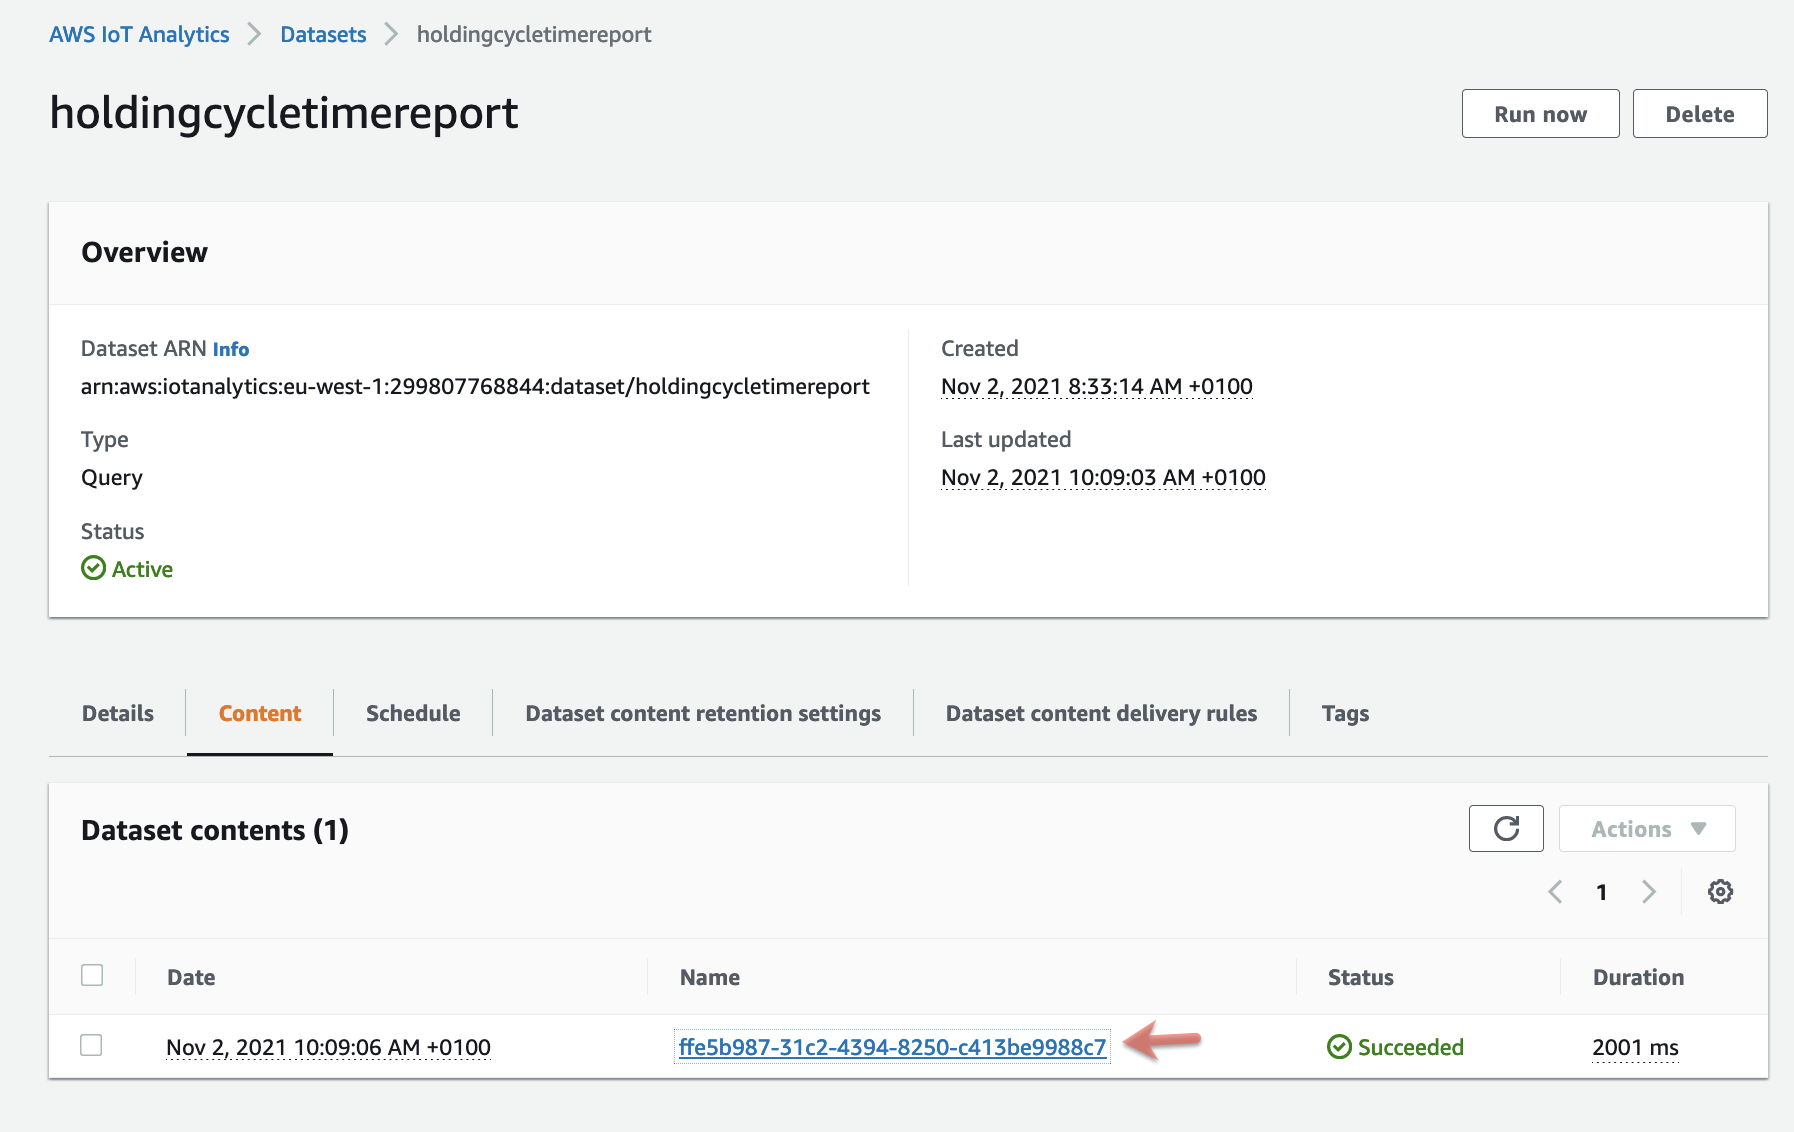
Choose Run now and wait until the result content appears on the Content tab with Succeeded. When you choose the Result link, the console shows you a preview of the query result:

The result shows the Last Holding Cycle Time metric by time. The query also added the AWS IoT SiteWise model information, like the asset name and model name, and the asset attribute values to each row. Such flattened data rows make it easier to analyze the data in BI tools. In the next step we will use Amazon QuickSight to analyze the IoT Analytics dataset.
Analyze the result in Amazon QuickSight
As a final step, we will analyze the data in Amazon QuickSight. Amazon QuickSight comes with a built-in connector for AWS IoT Analytics, so it’s easy to visualize the data.
Open the Amazon QuickSight console and chose New Analysis, when prompted for a data sources, create a new one by choosing New Dataset. Choose AWS IoT Analytics and select the SiteWise AWS IoT Analytics dataset holdingcycletimereport we created in the previous step. To create the data source choose Create Data Source.
 |
 |
Choose Visualize to start using Amazon QuickSight Visual Types to display the data set.

In this specific use case, we want understand how the Manufacture and the Construction Year influences the HOLDING cycle duration, the Amazon QuickSight heat map is a good choice to visualize this data.

And from this view, we can clearly identify that the furnaces manufactured by Furnace Corp in 1999 have the longest cycle time (>=88) and need to be prioritized for replacement.
Conclusion
This concludes the two part blog series on how to use AWS IoT SiteWise and AWS IoT Analytics to contextualize your industrial equipment data. We started by ingesting raw time series data into AWS IoT SiteWise. Next, we used the AWS IoT SiteWise asset model to add context about the industrial equipment that produced the time series data. Finally, we demonstrated how to use dataset queries in AWS IoT Analytics to combine the time series data points and context data into a flattened format that is easy to consume in BI tools like Amazon QuickSights.
About the author

Jan Borch is a Principal Specialist Solution Architect for IoT at Amazon Web Services (AWS) and spent the last 10 years helping customers design and build best-in-class cloud solutions on AWS. The last 5 years, he focused on the intersection of Cloud and IoT, leading the AWS IoT Prototyping Team to co-develop innovative connected IoT solutions with AWS customers in Europe, Middle East and Africa and recently his focal point shifted to customers with strategic IoT workloads on AWS.