The Internet of Things on AWS – Official Blog
Strengthening Operational Insights for Industrial Assets with AWS IoT AIML Solution (part 1)
Customers that manage and maintain industrial assets strive to keep them functioning as efficiently as possible, which they can do by monitoring and analyzing the health of their assets. Plant operators measure efficiency with key performance indicators (KPIs) like overall equipment effectiveness (OEE) or mean time before failure (MTBF) and act to improve these metrics at predetermined intervals. Ideally, plant operators would only act at the time when there is a justifiable gain for a taken action, like recalibration or replacement. Meanwhile, the operational technology (OT) team will only perform maintenance during a time period with the least impact to production. Acting too soon wastes resources on lesser gains while acting too late risks unplanned downtime. Customers want a solution that automates asset monitoring, learns from past performance issues, and provides actionable insights that maintain a high standard for their KPIs.
A condition-based monitoring solution that combines the disciplines of the Internet of Things (IoT) and machine learning (ML) can accelerate the OT team’s ability to meet their KPI goals. The objective of a condition-based monitoring solution is to track machine telemetry data in real time and forecast abnormalities in KPIs so that maintenance may be planned only when it is needed. This kind of solution can alert OT teams about abnormal performances and provide insights about the root cause based on past performance, creating opportunities to prevent problems before they impact your operations.
There are two primary obstacles to overcome when engineering a condition-based monitoring solution.
- Data Storage and Management: The vast amount of data collected from sensors, along with equipment and site metadata, need to be properly stored and cataloged.
- A scalable and easy-to-adopt approach to implement advanced analytics in IoT: multiple ML models need to be developed for different types of equipment, and be integrated into IoT platforms for conditional maintenance operation.
These obstacles can obscure insights driven from the AI solution, and can intimidate teams already responsible for maintaining hundreds of industrial assets by adding a ML component to asset management.
In this two-part series, we walk you through examples of how AWS IoT is helping customers solve these core challenges.
We address the obstacles of data storage and analysis, demonstrating how you can deploy a solution that will:
- Collect, store, organize, and monitor data from industrial equipment at scale with AWS IoT SiteWise. With AWS IoT SiteWise, multiple sensors can be structured with asset model and hierarchy levels, so data can be easily consumed for training ML models.
- Detect and diagnose equipment abnormalities with speed and precision to reduce expensive downtime with Amazon Lookout for Equipment. The OT team can use automated ML to develop multivariate ML models for complex industrial assets and achieve nearly continuous monitoring with ease.
- Integrate inference outputs from Amazon Lookout for Equipment with AWS IoT SiteWise, so the OT team can identify issues quickly at component levels for industrial assets. The OT team can also be automatically notified of anomalies with the AWS IoT SiteWise alarm feature, to make maintenance decisions.
Solution Overview
AWS IoT SiteWise is a managed service that makes it simple to collect, store, organize, and monitor data from industrial equipment at scale, helping you make more informed decisions. You may use AWS IoT SiteWise to manage operations across many sites, easily calculate industrial performance indicators, and build applications that analyze industrial equipment data to avoid costly equipment failures. With consolidated data, you can gather data consistently across devices, rapidly discover issues through remote monitoring, and achieve multi-site management.
Amazon Lookout for Equipment analyzes data from equipment sensors to train an ML model automatically for your equipment based only on your data—no data science skills necessary. Lookout for Equipment analyzes incoming sensor data in real time and accurately identifies early warning signals that could lead to preventable dips in health metrics like OEE or MTBF. This means you can identify anomalies in equipment quickly and precisely, diagnose problems efficiently, take action to avoid costly downtime, and minimize false alarms.
In this solution, we demonstrate the integration of these complementary AWS managed services for nearly continuous monitoring and alerting of a simulated pump station with two assets. Each asset is a pump like the one displayed in the following photo. It is used to move a fluid by transferring the rotational energy provided by a motor to hydrodynamic energy.
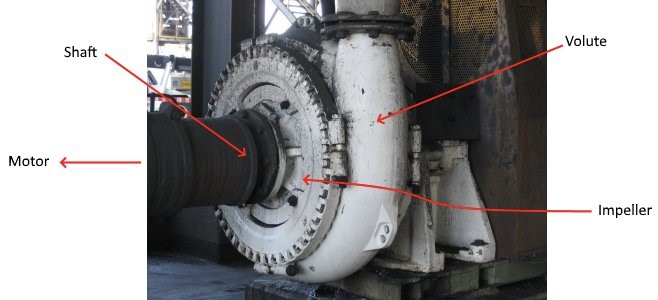
Figure 1: Centrifugal Pump, a Warman centrifugal pump in a coal preparation plant application, by Bernard S. Janse, licensed under CC BY 2.5
Customers can extend the steps outlined in this blog to develop a solution that can lead to optimizing their industrial assets. The result is a real-time dashboard to:
- Achieve real-time monitoring with alarm notification at scale;
- Provide detailed component-level diagnostics of an industrial asset fleet, so the OT team can perform maintenance with a clear root cause.
The following dashboard figure shows that pump #2 is currently in alarm and indicates which sensors are most associated with the detected anomaly.
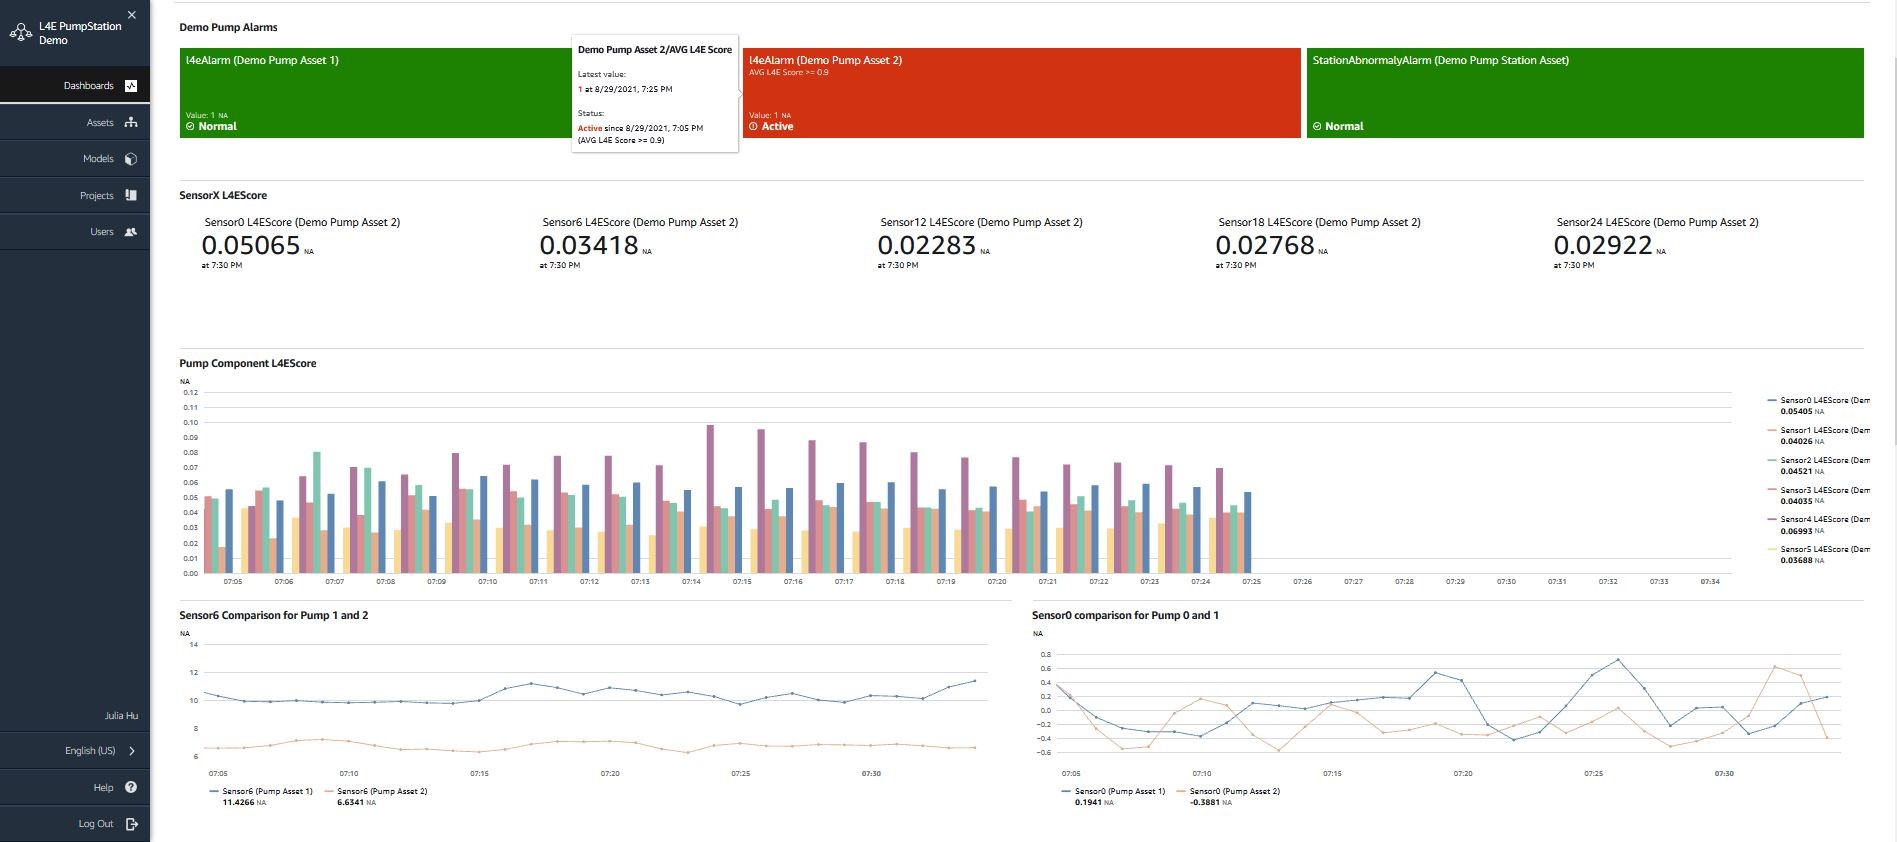
Figure 2: AWS IoT SiteWise Monitor dashboard developed with this solution to monitor pump assets
Measurements were taken around the four main components of the centrifugal pump: impeller, shaft, motor, and volute. For other sensors not positioned on one of these four components, they are organized under a general category: pump. From this reference, sensors 0-5 are within the pump level, sensors 6-11 are within the impeller component, sensors 12-17 are within the motor, sensors 18-23 are within the volute, and sensors 24-29 are within the shaft.
The solution scope includes:
1. “SiteWiseSimulator” AWS CloudFormation template that contains the following core workflows:
- Create AWS IoT SiteWise asset models for pump station and pump, and define their hierarchy relationship;
- Create AWS IoT SiteWise alarm model to enable automatic alert notification for anomalies;
- Create AWS IoT SiteWise assets based on asset models defined earlier, and enable MQTT notification for AWS IoT SiteWise data streaming to Amazon Simple Storage Service (Amazon S3);
- AWS Lambda function to write sensor data periodically to AWS IoT SiteWise with BatchPutAssetPropertyValue API call.
2. Amazon Lookout for Equipment workflow with Amazon SageMaker notebooks:
- Train Lookout for Equipment ML model;
- Create inference scheduler to monitor multiple assets nearly continuously.
3. “l4esitewise_pipeline” AWS CloudFormation template that contains the following data engineering pipeline to integrate Lookout for Equipment with AWS IoT SiteWise:
- Stream AWS IoT SiteWise data to S3 in near-real time;
- Lambda function for transforming raw telemetry data from AWS IoT SiteWise to the dataset format required by Lookout for Equipment on a predefined schedule (see l4einference-schedule.zip)
- Lambda function for sending the inference results from Lookout for Equipment back into AWS IoT SiteWise. This Lambda function will also send a diagnosis from Lookout for Equipment to AWS IoT SiteWise, so the OT team can use this diagnosis to identify which sensor/component is behaving abnormally (see l4eoutput-2sitewise.zip)
4. An AWS IoT SiteWise Monitor dashboard to visualize the Lookout for Equipment diagnosis with AWS IoT SiteWise data in real time.
Architecture
For this solution, a simulator is created to publish telemetry of the physical operations of two industrial assets—the two centrifugal pumps. Each pump contains 30 sensor readings as measurements. Sensor measurement values of these assets are updated at a frequency of 1 Hz to AWS IoT SiteWise. To transform AWS IoT SiteWise data to the format accepted by Amazon Lookout for Equipment, the data pipeline needs to perform the following steps:
- AWS IoT SiteWise data is exported to Amazon S3 first;
- A Lambda function will be initiated at a 5-minute interval to analyze and process AWS IoT SiteWise data in S3;
- The processed data will be saved as csv files in S3 as inference data inputs.
Lookout for Equipment first trains two models based on historical datasets from these two assets. Next, it deploys the best-fit model by setting up an inference scheduler at five-minute intervals, and produces an anomaly score on the csv files containing the AWS IoT SiteWise data. Once the inference scheduler outputs the predictions as csv files in S3, a Lambda function is initiated to update model diagnostics from Lookout for Equipment in AWS IoT SiteWise. If the prediction from Lookout for Equipment is abnormal, alarms defined within AWS IoT SiteWise will be initiated, and alarms can be visualized in a SiteWise Monitor application in real time. Further notifications to the OT team can also be set up if desired. In this architecture, Lambda functions play a pivotal role to connect the two key services together. Lambda functions can achieve high concurrency, and therefore easily scale up to meet the demand of complex industrial system with many assets.
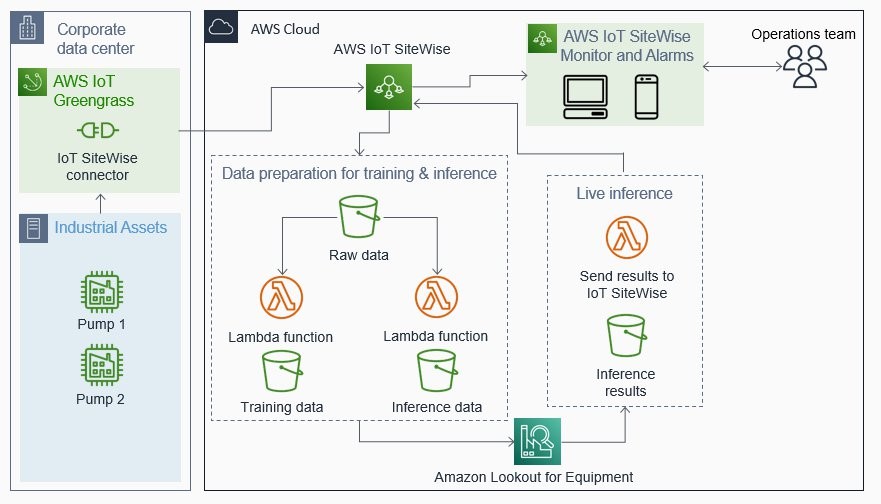
Figure 3: Solution Architecture for AWS IoT SiteWise integration with Amazon Lookout for Equipment
Walkthrough
This post features the key solution milestones for conciseness, but readers should visit the GitHub repository for a full walkthrough and source code. This two-part post contains:
Part 1 (this post):
- Step 1: deploy a simulator of a pump station. This step shows how to create industrial assets with AWS IoT SiteWise, and monitor data flow with a dashboard built in AWS IoT SiteWise Monitor.
- Step 2: Create data pipeline resources to (1) transform data for Lookout for Equipment as inference input and (2) fetch Lookout for Equipment inference results back to AWS IoT SiteWise.
Part 2:
- Step 1: Train the Lookout for Equipment model with historical training data and evaluate model performance.
- Step 2: Use Lookout for Equipment to establish inference scheduler to provide anomaly prediction for assets.
- Step 3: Augment the dashboard built in Part 1 with the Lookout for Equipment service for anomaly alerts and remote monitoring.
The following steps will provide detailed instructions on developing this solution. To follow this blog to build the previously mentioned workflow, you don’t need any specialized ML or IoT experience to set this up.
Prerequisites
For this walkthrough, you should have the following prerequisites:
- An AWS account. If you don’t have an AWS account, follow the instructions to create one.
- A user role with AdministratorAccess (service access associated with this role can be constrained further when the workflow goes to production).
- A modern web browser (such as latest versions of Mozilla Firefox or Google Chrome).
- No specialized knowledge is required to build this solution, but basic Linux and Python knowledge will help.
Step 1: Create a pump station simulator
In realistic industrial settings, AWS IoT SiteWise uses AWS IoT SiteWise Edge software to automate the process of collecting industrial data by using multiple industrial protocols with pre-packaged connectors. Besides AWS IoT SiteWise Edge data ingestion, AWS IoT SiteWise supports other data ingestion methods, including using an AWS IoT SiteWise API call with BatchPutAssetPropertyValue call function. The API accepts a payload that contains timestamp-quality-value (TQV) structures, so developers can collect data from several devices and send it all in a single request. In this blog, a simulator is set up via a CloudFormation stack and uses the BatchPutAssetPropertyValue API call to send data from 30 sensors at the frequency of 1 Hz to pump assets. We recommend using the API call to publish data to avoid lengthy instruction for a device simulator, such as Kepware server.
To set up the simulator, log on to the AWS Management Console for CloudFormation, and use this AWS CloudFormation stack to create the following AWS resources:
- Three AWS IoT SiteWise assets: two for centrifugal pumps (child asset) and one for a pump station (parent asset);
- Two AWS IoT SiteWise alarm models: one for the pump station and one for a centrifugal pump;
- AWS Lambda functions to create alarm models, asset models, and assets, and publish sensor data to AWS IoT SiteWise programmatically.
For a full list of resources created from this CloudFormation, refer to the GitHub project.
Next, proceed to Specify stack details, provide a Stack name, and DemoDurationDays, then choose Next(Figure 4). Note that this simulator stack will be deleted automatically once the DemoDurationDays specified here is reached, and AWS IoT SiteWise resources created from this stack will be deleted. This does not include the AWS IoT SiteWise Monitor resources you will create manually later.
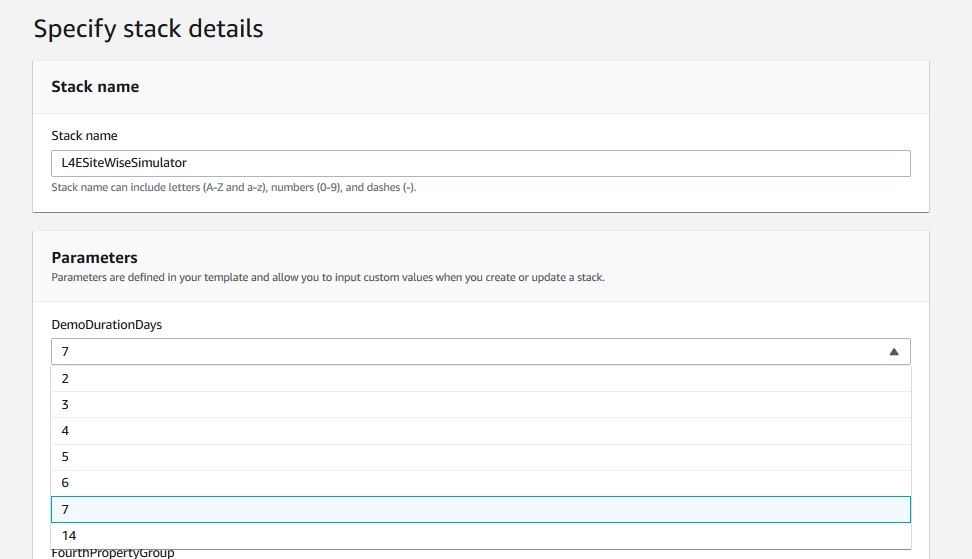
Figure 4: Specify the CloudFormation stack details
On the next screen, called Configure stack options, choose Continue. Finally select the “I acknowledge that AWS CloudFormation might create IAM resources” agreement and choose Create. More detailed instructions on CloudFormation stack creation can be found in the AWS documentation.
After deployment of the CloudFormation, check that the template has the status CREATE_COMPLETE on the AWS CloudFormation console. Select the stack and then choose the Outputs tab. Take note of both FirstAssetId and SecondAssetId, since you will use them in step 2 to set up the Lookout for Equipment integration workflow.
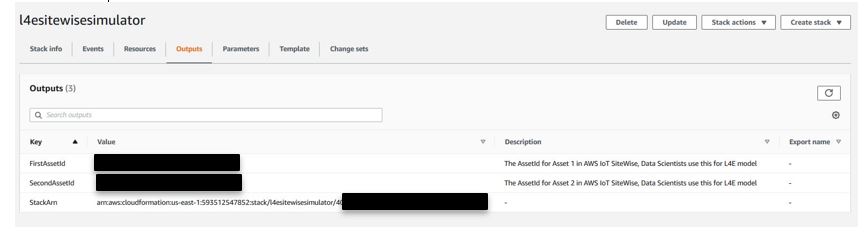
Figure 5: Output section of the CloudFormation stack
Now that you have finished deploying the SiteWiseSimulator stack, navigate to the AWS IoT SiteWise console. First select Assets, and check the assets’ status as ACTIVE for both pump assets and the pump station asset.
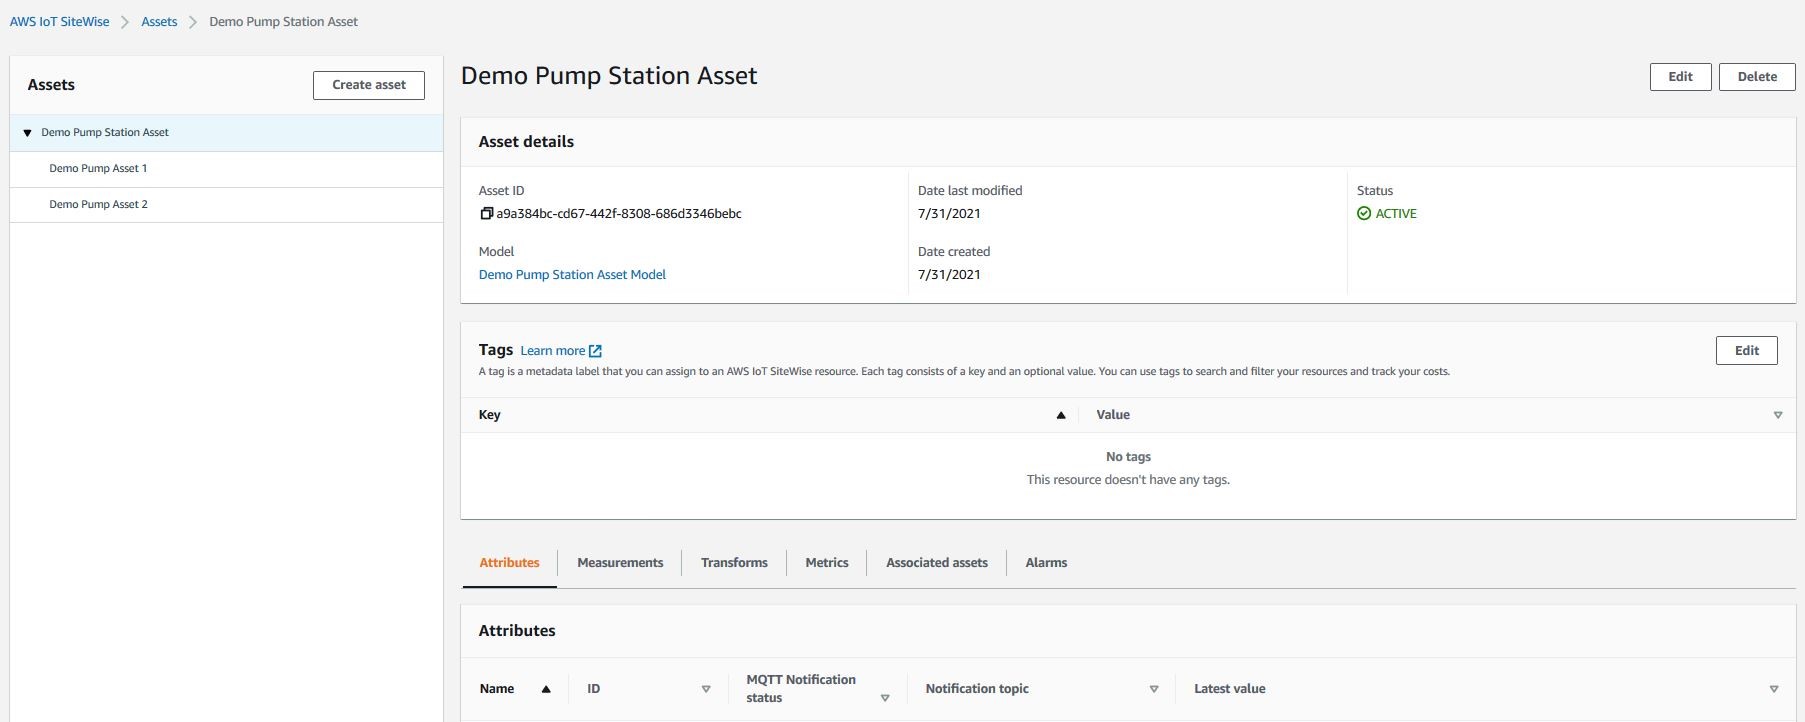
Figure 6: AWS IoT SiteWise console
To manage industrial asset data streams efficiently, AWS IoT SiteWise uses the concept of asset to model the physical operations of industrial assets. Using AWS IoT SiteWise asset, industrial data can be organized within a specific hierarchy level with associated parent and child models. In this blog, a pump station asset is set up as a parent asset, and it comprises of two child assets: each individual centrifugal pump. With the asset hierarchy, you can calculate statistics across multiple assets and achieve management for large-scale assets. For example, the pump station anomaly score metric (“Total L4EScore” measurement tag) is calculated as a sum of the individual anomaly score from each child pump asset.
To facilitate a detailed component-level diagnosis, Amazon Lookout for Equipment provides model diagnostics for each detected abnormal behavior. These diagnostics indicate which sensors within the asset are contributing to the anomaly. This blog shows a solution to ingest the anomaly score for each sensor to AWS IoT SiteWise via a specific measurement tag for each sensor as: Sensor X L4EScore. A high L4EScore is a strong indicator of an anomaly that warrants action from the operations team. Customers can use these insights to diagnose the problem and take corrective action.
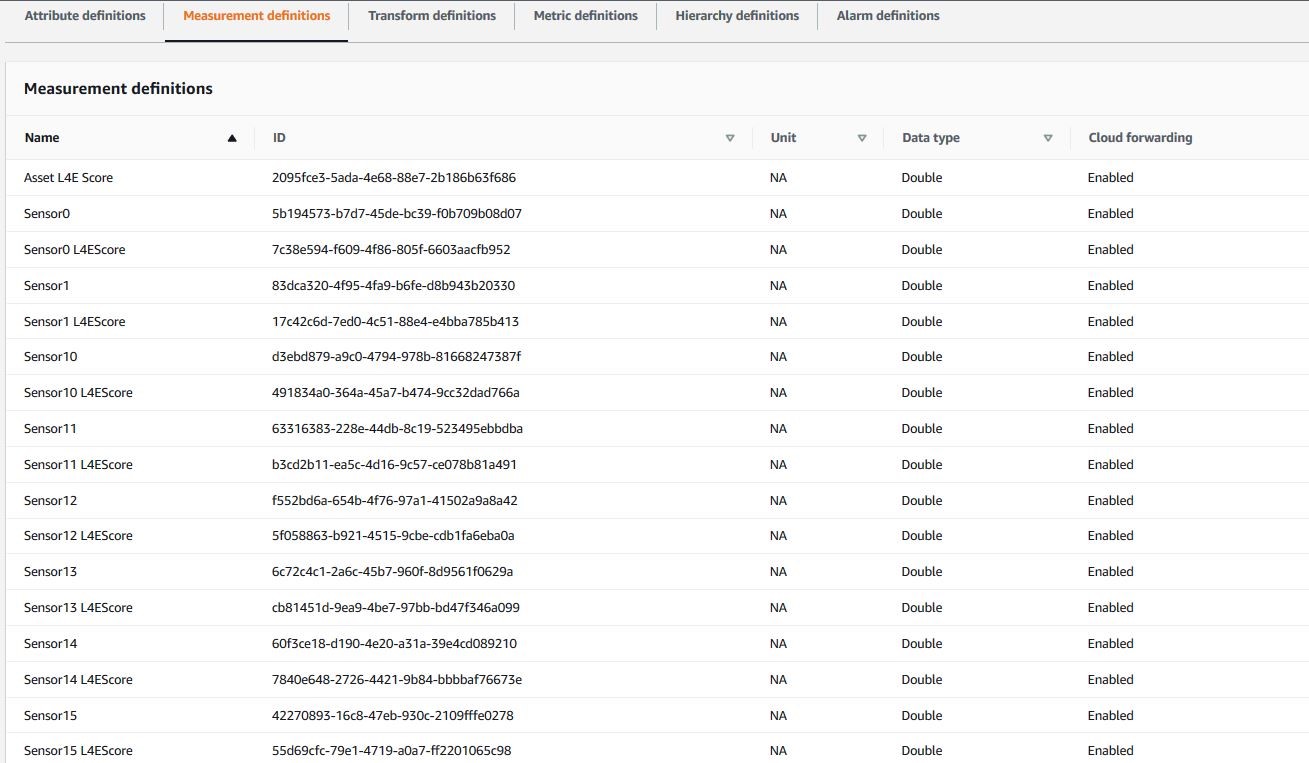
Figure 7: Measurement definition within AWS IoT SiteWise
With the latest AWS IoT SiteWise alarm function, an alarm can be directly configured within an AWS IoT SiteWise asset model. The OT teams can then use such an alarm to get alerted quickly to suboptimal equipment status. To avoid false positive alarms, the metric AVG L4E Score is used to calculate the average Asset L4E Score inferred by Lookout for Equipment in the past 5 minutes. The AWS IoT SiteWise alarm l4e Alarm will evaluate the AVG L4E Score against a user-defined threshold to set the state of the alarm. Once the alarm threshold is exceeded, suitable notification methods can be defined accordingly, such as using Amazon Simple Notification Service to send emails or text messages.
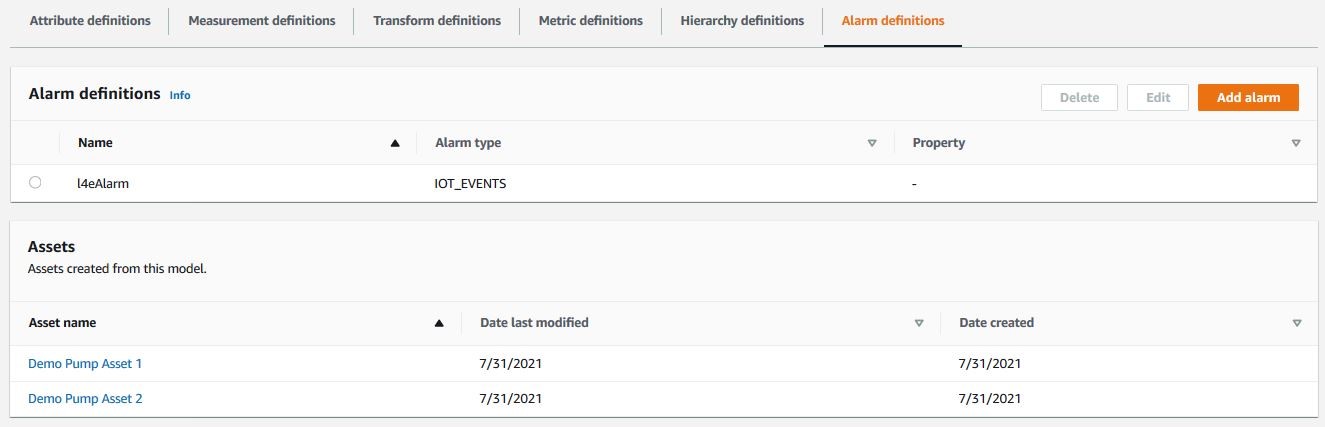
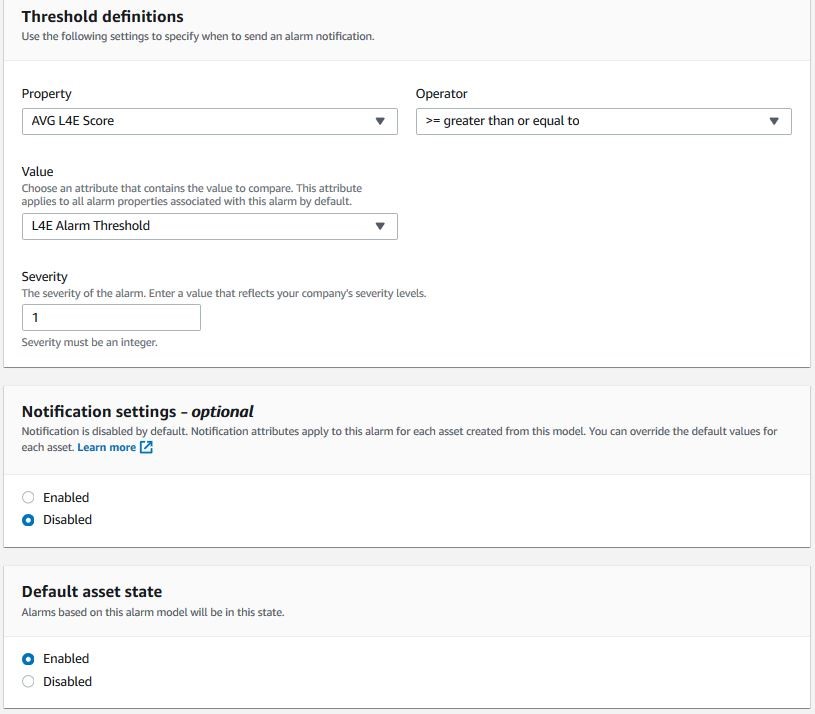
Figure 8: AWS IoT SiteWise alarm definition
To verify the data flow in AWS IoT SiteWise, customers can quickly set up a SiteWise Monitor dashboard to monitor real-time data ingestion. SiteWise Monitor is a feature of AWS IoT SiteWise that lets you create portals as a managed web application. To monitor the data from your assets, you will create a project and dashboards for assets within AWS IoT SiteWise. Your portal can also be shared with other users without the need for them to have an AWS account. First, you’ll create a portal and a project with associated assets within AWS IoT SiteWise. Next, you can create a dashboard within the project you created earlier. The initial dashboard contains the real-time sensor data values from Demo Pump Asset 1 ingested in AWS IoT SiteWise. For each visual, sensor values from the same component are plotted together.
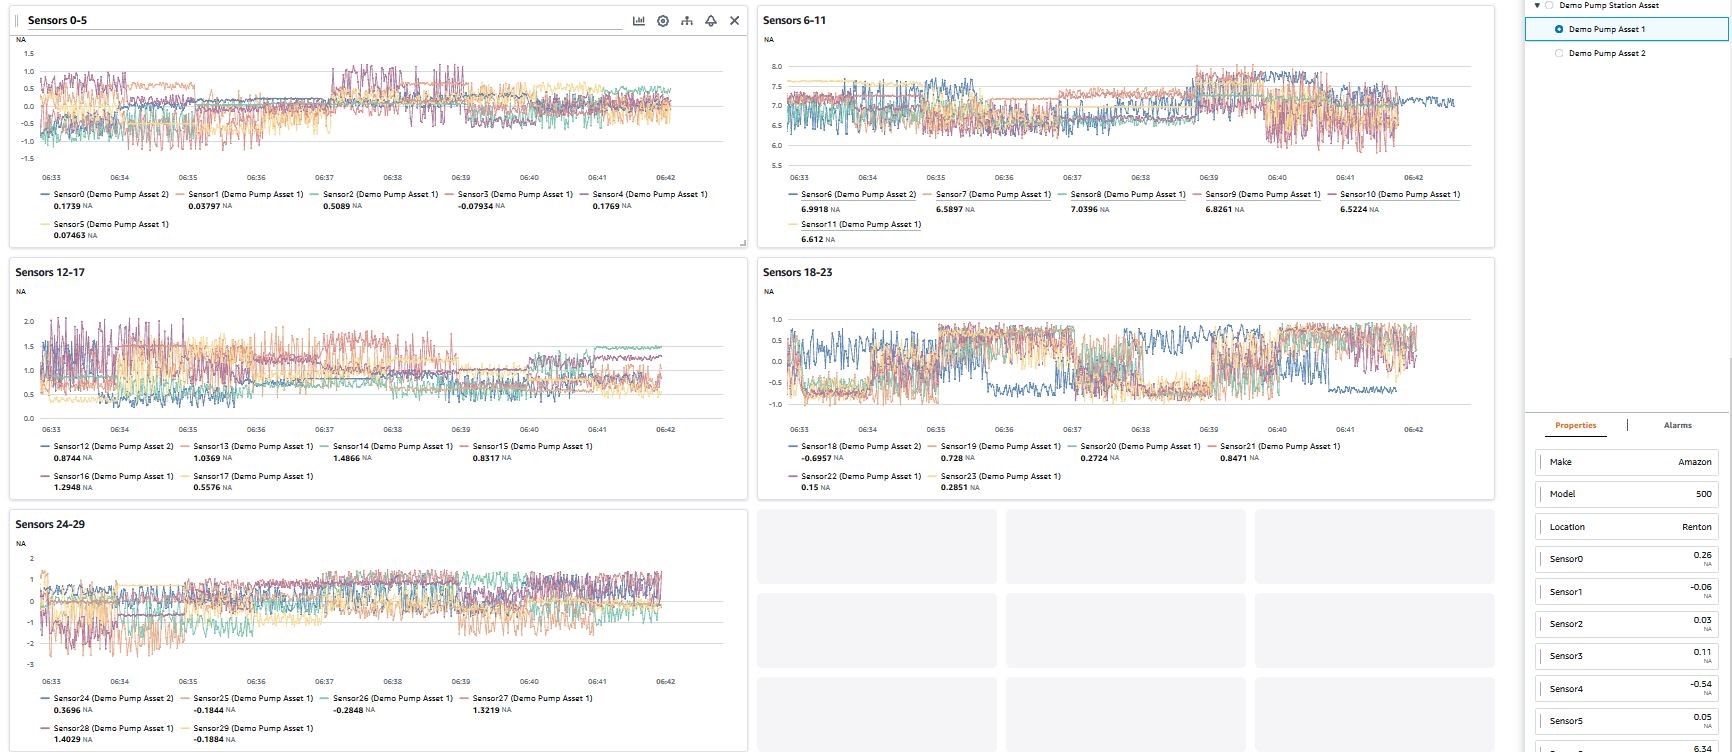
Figure 9: AWS IoT SiteWise Monitor dashboard
Step 2: Create Data Pipeline to Integrate Amazon Lookout for Equipment and AWS IoT SiteWise
Amazon Lookout for Equipment requires sensor and label data in a .csv format. The inference output from Lookout for Equipment is exported as a JSON file into the Amazon S3 bucket that you specified. To integrate AWS IoT SiteWise asset data with Lookout for Equipment, a low-latency data pipeline is needed to perform two tasks:
- Transform AWS IoT SiteWise data to the specific data format used by Lookout for Equipment;
- Publish inference results back to AWS IoT SiteWise as new measurements.
This data pipeline is comprised of four parts:
- Stream AWS IoT SiteWise data to S3 in near-real time;
- Use a Lambda function to initiate Amazon Athena at a scheduled time to reformat data in S3, and output data as .csv file for the Lookout for Equipment inference;
- After the Lookout for Equipment inference has finished, use the Lambda function to ingest Lookout for Equipment output data to specific measurement tags in AWS IoT SiteWise;
- Set up AWS resources for running Lookout for Equipment service (for example, a SageMaker notebook containing API calls to Lookout for Equipment).
This data pipeline is deployed as a CloudFormation stack in this blog. For a full list of AWS resources created from this CloudFormation, refer to the GitHub project. Since this CloudFormation resource provisioning step is similar to the procedure described in Step 1, detailed instruction can be found on GitHub.
After the stack is successfully created, you can review the following data pipeline. These steps are optional and covered here for a deeper understanding of the solution.
Review your asset property and asset metadata in Amazon S3. Navigate to the S3 console, and check the S3 bucket that was created from the stack for AWS IoT SiteWise data storage. There are two different approaches to export AWS IoT SiteWise data to S3. The first approach is to use an AWS CloudFormation template to create the required resources to stream incoming data from AWS IoT SiteWise to an S3 bucket in near-real time (one export per minute). Then, the S3 bucket saves all AWS IoT SiteWise property value update messages in the folder asset-property-updates. The S3 bucket also stores metadata for AWS IoT SiteWise assets, which include asset and property names and other information, in the folder asset-metadata. The second approach is to opt-in export measurement data to S3 from the AWS IoT SiteWise console. Once you opt in to export your data to S3, all you need to do is to provide the URL to an S3 bucket in your AWS account. However, the frequency of asset metadata export is once per 6 hours. In this blog, the first approach is used to export AWS IoT SiteWise data to reduce inference latency for Lookout for Equipment.
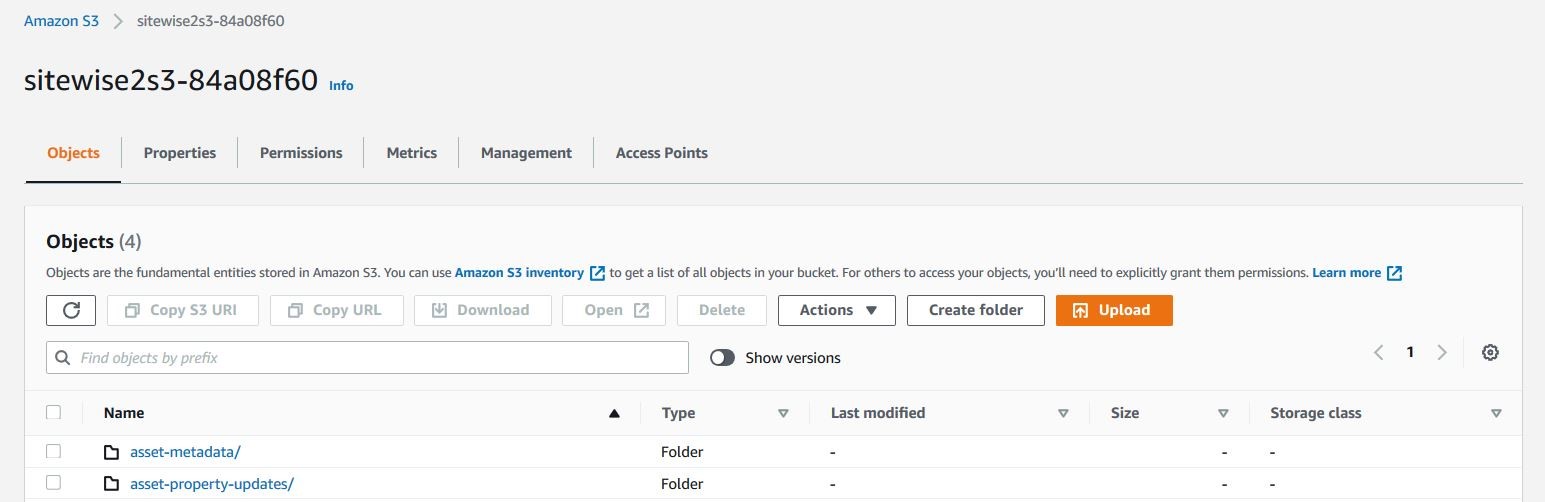
Figure 10: S3 folders created to store AWS IoT SiteWise data
Run Amazon Athena named query for both demo pump assets and review the output data format. Navigate to the Athena console, select the database from the list that looks similar to sitewise2s3_firehouse_glue_database (yours may differ based on the specified prefix), and you will find two Athena views created by the Athena named query: l4e_inference_data_pump1 and l4e_inference_data_pump2. You can select Preview from the contextual action menu icon (⋮) on the right of l4e_inference_data_pump1. The sensor data from all 30 sensors of this pump are shown in Figure 11.
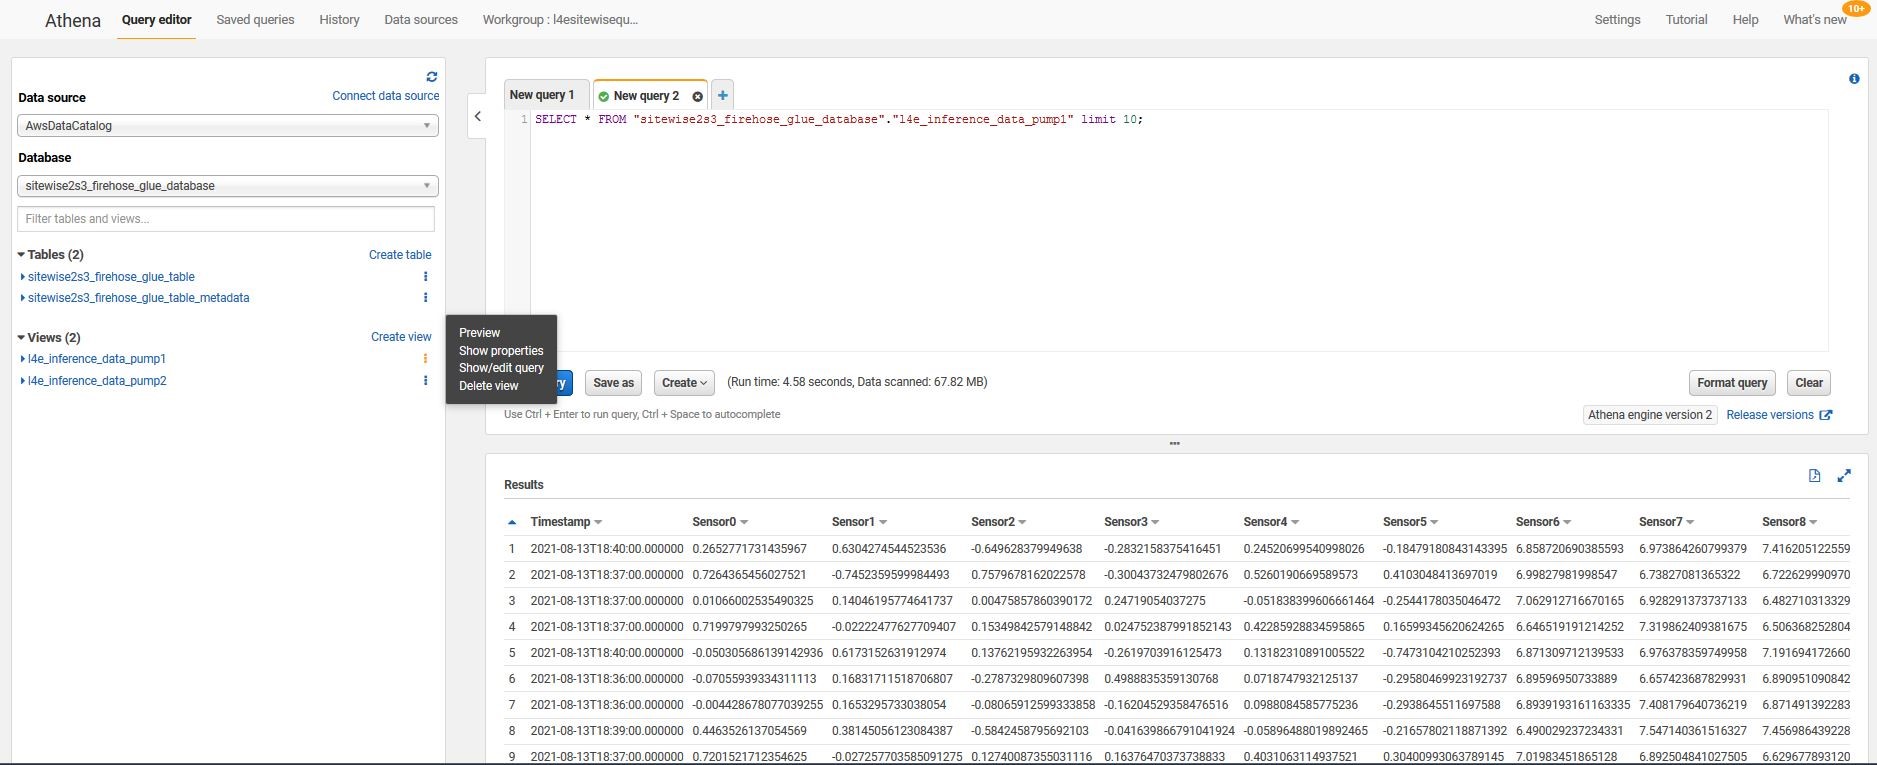
Figure 11: Outputs from Amazon Athena query
The output from the Athena query pivoted the asset property values, and it follows a schema that Lookout for Equipment accepts for inference. You can find more details in the AWS documentation on how to use AWS Glue and Athena to analyze AWS IoT SiteWise data.
Lambda function LocalResourcePrefix__l4einferenceschedule. The Lambda function prepares inference input data in an S3 bucket for Lookout for Equipment. This Lambda will first collect reformatted AWS IoT SiteWise data generated by Athena NamedQuery. Fill in the empty property value and output the data as a csv file with a file name defined by Lookout for Equipment inference scheduler. Since the minimum inference frequency of Lookout for Equipment is once per 5 minutes, the Lambda function will be initiated by a CloudWatch Event at the same frequency to process data. You can navigate to the Monitoring section in the AWS Lambda console to monitor the Lambda functions, to troubleshoot, or to optimize the pipeline performance. As shown in Figure 12, this Lambda function is concurrently invoked twice, one for each Demo Pump asset dataset. The multiple invocation is achieved by using the UUID of AWS IoT SiteWise assets as part of the input events of the Lambda function. Such multiple invocation patterns can be extended for monitoring hundreds of industrial assets.

Figure 12: CloudWatch metrics for the Lambda function
Lambda function “LocalResourcePrefix_l4einferenceoutput”. This Lambda function is deployed to publish Lookout for Equipment predictions to AWS IoT SiteWise. A prediction field 0 indicates normal equipment behavior, and a prediction field 1 indicates abnormal equipment behavior. Once the JSON prediction output from Lookout for Equipment is uploaded to the S3 bucket, the Lambda function will be initialized by this S3 PutObject action. This Lambda function will update the Asset L4E Score measurement in AWS IoT SiteWise with the Lookout for Equipment prediction. When the prediction is 1, Lookout for Equipment returns an object that contains a diagnostic list. The diagnostics list has the name of the sensors and the weights of the sensors’ contributions in indicating abnormal equipment behavior. In this blog, the diagnostics for each sensor is also ingested to AWS IoT SiteWise via the measurement tag SensorX L4EScore, where X stands for sensor number. Note that this measurement tag is only updated when the Asset L4E Score is equal to 1, otherwise this measurement tag remains as null. Also note, this Lambda function will not be invoked until the Lookout for Equipment inference service has initiated, as explained in detail in part 2 of this series.
Other relevant resources. This data pipeline CloudFormation stack also creates other Amazon ML resources, including a SageMaker notebook instance for running SageMaker notebooks. The purpose of these SageMaker notebooks is to provide API calls to Lookout for Equipment for ML model training and inference. They also show readers a data exploration and model evaluation process to understand the business problem. Note that these notebooks are not required with Lookout for Equipment. Users can directly use this service with relevant API call as well. To use Lookout for Equipment to schedule inference, two S3 paths are created, one for Demo Pump Asset1 as l4ebucketprefix-asset1-train-inference, and one for Demo Pump Asset 2 as l4ebucketprefix-asset2-train-inference.
Summary of Part 1
In Part 1 of this two-part series, you learned:
- How to create industrial assets with AWS IoT SiteWise, and monitor data flow with a dashboard built in AWS IoT SiteWise Monitor;
- How to create data pipeline resources to integrate Amazon Lookout for Equipment service with AWS IoT SiteWise.
In Part 2, you will learn how to train ML models for pump assets, and evaluate the model with the historical dataset. You will create an inference scheduler with Lookout for Equipment to monitor your device nearly continuously with this applied ML service. Finally, you will learn how to visualize ML-driven asset performance monitoring from Lookout for Equipment with AWS IoT SiteWise Monitor.
About the authors
 Julia Hu is a ML&IoT Architect with Amazon Web Services. She has extensive experience in IoT architecture and Applied Data Science, and is part of both the Machine Learning and IoT Technical Field Community. She works with customers, ranging from start-ups to enterprises, to develop AWSome IoT machine learning (ML) solutions, at the Edge and in the Cloud. She enjoys leveraging latest IoT technology to scale up her ML solution, reduce latency, and accelerate industry adoption. Julia Hu is a ML&IoT Architect with Amazon Web Services. She has extensive experience in IoT architecture and Applied Data Science, and is part of both the Machine Learning and IoT Technical Field Community. She works with customers, ranging from start-ups to enterprises, to develop AWSome IoT machine learning (ML) solutions, at the Edge and in the Cloud. She enjoys leveraging latest IoT technology to scale up her ML solution, reduce latency, and accelerate industry adoption. |
 Dastan Aitzhanov is a Specialist Solutions Architect in Applied AI with Amazon Web Services. He specializes in architecting and building scalable cloud-based platforms with an emphasis on machine learning, internet of things, and big data-driven applications. When not working, he enjoys going camping, skiing, and spending time in the great outdoors with his family. Dastan Aitzhanov is a Specialist Solutions Architect in Applied AI with Amazon Web Services. He specializes in architecting and building scalable cloud-based platforms with an emphasis on machine learning, internet of things, and big data-driven applications. When not working, he enjoys going camping, skiing, and spending time in the great outdoors with his family. |
 Michaël Hoarau is an AI/ML specialist solution architect at AWS who alternates between a data scientist and machine learning architect, depending on the moment. He is passionate about bringing the power of AI/ML to the shop floors of his industrial customers and has worked on a wide range of ML use cases, ranging from anomaly detection to predictive product quality or manufacturing optimization. When not helping customers develop the next best machine learning experiences, he enjoys observing the stars, traveling, or playing the piano. Michaël Hoarau is an AI/ML specialist solution architect at AWS who alternates between a data scientist and machine learning architect, depending on the moment. He is passionate about bringing the power of AI/ML to the shop floors of his industrial customers and has worked on a wide range of ML use cases, ranging from anomaly detection to predictive product quality or manufacturing optimization. When not helping customers develop the next best machine learning experiences, he enjoys observing the stars, traveling, or playing the piano. |
|
Sebastian Salomon is a Sr IoT Data Architect with Amazon Web Services.
|