Artificial Intelligence
Visualize your Amazon Lookout for Metrics anomaly results with Amazon QuickSight
One of the challenges encountered by teams using Amazon Lookout for Metrics is quickly and efficiently connecting it to data visualization. The anomalies are presented individually on the Lookout for Metrics console, each with their own graph, making it difficult to view the set as a whole. An automated, integrated solution is needed for deeper analysis.
In this post, we use a Lookout for Metrics live detector built following the Getting Started section from the AWS Samples, Amazon Lookout for Metrics GitHub repo. After the detector is active and anomalies are generated from the dataset, we connect Lookout for Metrics to Amazon QuickSight. We create two datasets: one by joining the dimensions table with the anomaly table, and another by joining the anomaly table with the live data. We can then add these two datasets to a QuickSight analysis, where we can add charts in a single dashboard.
We can provide two types of data to the Lookout for Metrics detector: continuous and historical. The AWS Samples GitHub repo offers both, though we focus on the continuous live data. The detector monitors this live data to identify anomalies and writes the anomalies to Amazon Simple Storage Service (Amazon S3) as they’re generated. At the end of a specified interval, the detector analyzes the data. Over time, the detector learns to more accurately identify anomalies based on patterns it finds.
Lookout for Metrics uses machine learning (ML) to automatically detect and diagnose anomalies in business and operational data, such as a sudden dip in sales revenue or customer acquisition rates. The service is now generally available as of March 25, 2021. It automatically inspects and prepares data from a variety of sources to detect anomalies with greater speed and accuracy than traditional methods used for anomaly detection. You can also provide feedback on detected anomalies to tune the results and improve accuracy over time. Lookout for Metrics makes it easy to diagnose detected anomalies by grouping together anomalies related to the same event and sending an alert that includes a summary of the potential root cause. It also ranks anomalies in order of severity so you can prioritize your attention to what matters the most to your business.
QuickSight is a fully-managed, cloud-native business intelligence (BI) service that makes it easy to connect to your data to create and publish interactive dashboards. Additionally, you can use Amazon QuickSight to get instant answers through natural language queries.
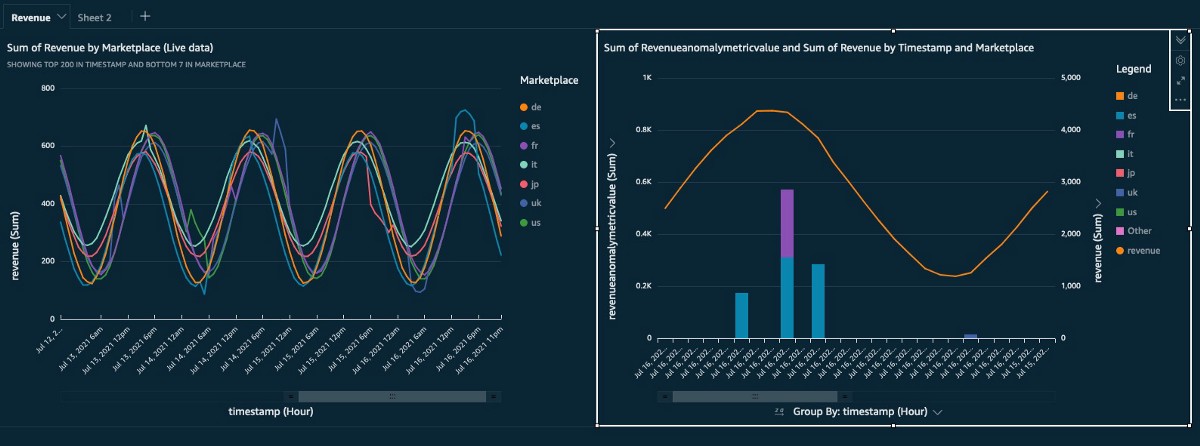
You can access serverless, highly scalable QuickSight dashboards from any device, and seamlessly embed them into your applications, portals, and websites. The following screenshot is an example of what you can achieve by the end of this post.
Overview of solution
The solution is a combination of AWS services, primarily Lookout for Metrics, QuickSight, AWS Lambda, Amazon Athena, AWS Glue, and Amazon S3.
The following diagram illustrates the solution architecture. Lookout for Metrics detects and sends the anomalies to Lambda via an alert. The Lambda function generates the anomaly results as CSV files and saves them in Amazon S3. An AWS Glue crawler analyzes the metadata, and creates tables in Athena. QuickSight uses Athena to query the Amazon S3 data, allowing dashboards to be built to visualize both the anomaly results and the live data.
This solution expands on the resources created in the Getting Started section of the GitHub repo. For each step, we include options to create the resources either using the AWS Management Console or launching the provided AWS CloudFormation stack. If you have a customized Lookout for Metrics detector, you can use it and adapt it the following notebook to achieve the same results.
The implementation steps are as follows:
- Create the Amazon SageMaker notebook instance (
ALFMTestNotebook) and notebooks using the stack provided in the Initial Setup section from the GitHub repo. - Open the notebook instance on the SageMaker console and navigate to the
amazon-lookout-for-metrics-samples/getting_startedfolder. - Create the S3 bucket and complete the data preparation using the first notebook (
1.PrereqSetupData.ipynb). Open the notebook with theconda_python3kernel, if prompted.
We skip the second notebook because it’s focused on backtesting data.
- If you’re walking through the example using the console, create the Lookout for Metrics live detector and its alert using the third notebook
(3.GettingStartedWithLiveData.ipynb).
If you’re using the provided CloudFormation stacks, the third notebook isn’t required. The detector and its alert are created as part of the stack.
- After you create the Lookout for Metrics live detector, you need to activate it from the console.
This can take up to 2 hours to initialize the model and detect anomalies.
- Deploy a Lambda function, using Python with a Pandas library layer, and create an alert attached to the live detector to launch it.
- Use the combination of Athena and AWS Glue to discover and prepare the data for QuickSight.
- Create the QuickSight data source and datasets.
- Finally, create a QuickSight analysis for visualization, using the datasets.
The CloudFormation scripts are typically run as a set of nested stacks in a production environment. They’re provided individually in this post to facilitate a step-by-step walkthrough.
Prerequisites
To go through this walkthrough, you need an AWS account where the solution will be deployed. Make sure that all the resources you deploy are in the same Region. You need a running Lookout for Metrics detector built from notebooks 1 and 3 from the GitHub repo. If you don’t have a running Lookout for Metrics detector, you have two options:
- Run notebooks 1 and 3, and continue from the step 1 of this post (creating the Lambda function and alert)
- Run notebook 1 and then use the CloudFormation template to generate the Lookout for Metrics detector
Create the live detector using AWS CloudFormation
The L4MLiveDetector.yaml CloudFormation script creates the Lookout for Metrics anomaly detector with its source pointing to the live data in the specified S3 bucket. To create the detector, complete the following steps:
- Launch the stack from the following link:
- On the Create stack page, choose Next.
- On the Specify stack details page, provide the following information:
- A stack name. For example,
L4MLiveDetector. - The S3 bucket,
<Account Number>-lookoutmetrics-lab. - The Role ARN,
arn:aws:iam::<Account Number>:role/L4MTestRole. - An anomaly detection frequency. Choose
PT1H(hourly).
- A stack name. For example,
- Choose Next.
- On the Configure stack options page, leave everything as is and choose Next.
- On the Review page, leave everything as is and choose Create stack.
Create the live detector SMS alert using AWS CloudFormation (Optional)
This step is optional. The alert is presented as an example, with no impact on the dataset creation. The L4MLiveDetectorAlert.yaml CloudFormation script creates the Lookout for Metrics anomaly detector alert with an SMS target.
- Launch the stack from the following link:
- On the Create stack page, choose Next.
- On the Specify stack details page, update the SMS phone number and enter a name for the stack (for example,
L4MLiveDetectorAlert). - Choose Next.
- On the Configure stack options page, leave everything as is and choose Next.
- On the Review page, select the acknowledgement check box, leave everything else as is, and choose Create stack.
Resource cleanup
Before proceeding with the next step, stop your SageMaker notebook instance to ensure no unnecessary costs are incurred. It is no longer needed.
Create the Lambda function and alert
In this section, we provide instructions on creating your Lambda function and alert via the console or AWS CloudFormation.
Create the function and alert with the console
You need a Lambda AWS Identity and Access Management (IAM) role following the least privilege best practice to access the bucket where you want the results to be saved.
-
- On the Lambda console, create a new function.
- Select Author from scratch.
- For Function name¸ enter a name.
- For Runtime, choose Python 3.8.
- For Execution role, select Use an existing role and specify the role you created.
- Choose Create function.

- Download the ZIP file containing the necessary code for the Lambda function.
- On the Lambda console, open the function.
- On the Code tab, choose Upload from, choose .zip file, and upload the file you downloaded.
- Choose Save.
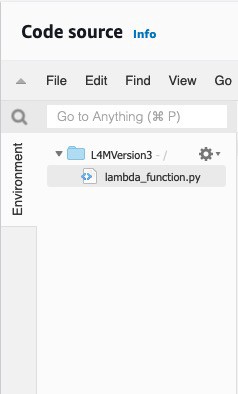
Your file tree should remain the same after uploading the ZIP file.
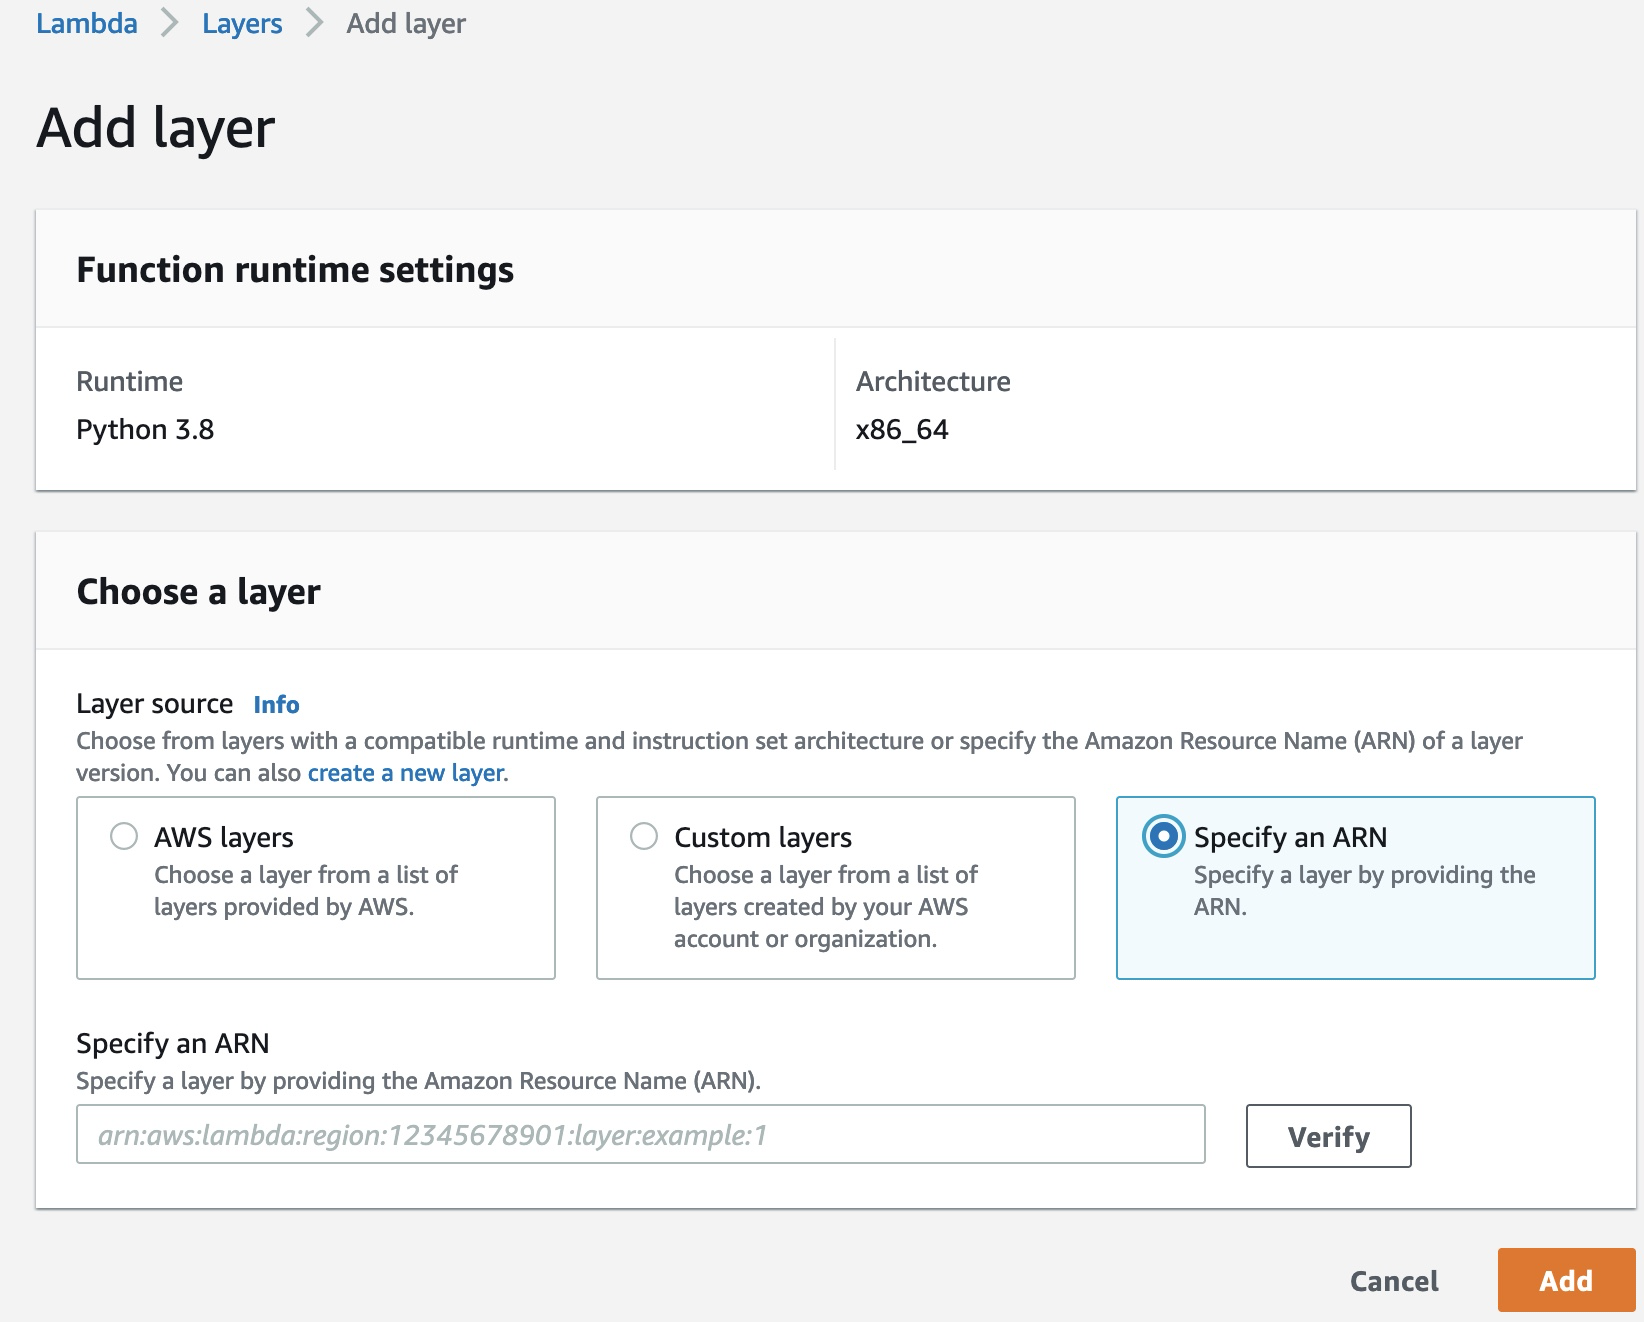
- In the Layers section, choose Add layer.
- Select Specify an ARN.
- In the following GitHub repo, choose the CSV corresponding to the Region you’re working in and copy the ARN from the latest Pandas version.
- For Specify an ARN, enter the ARN you copied.
- Choose Add.
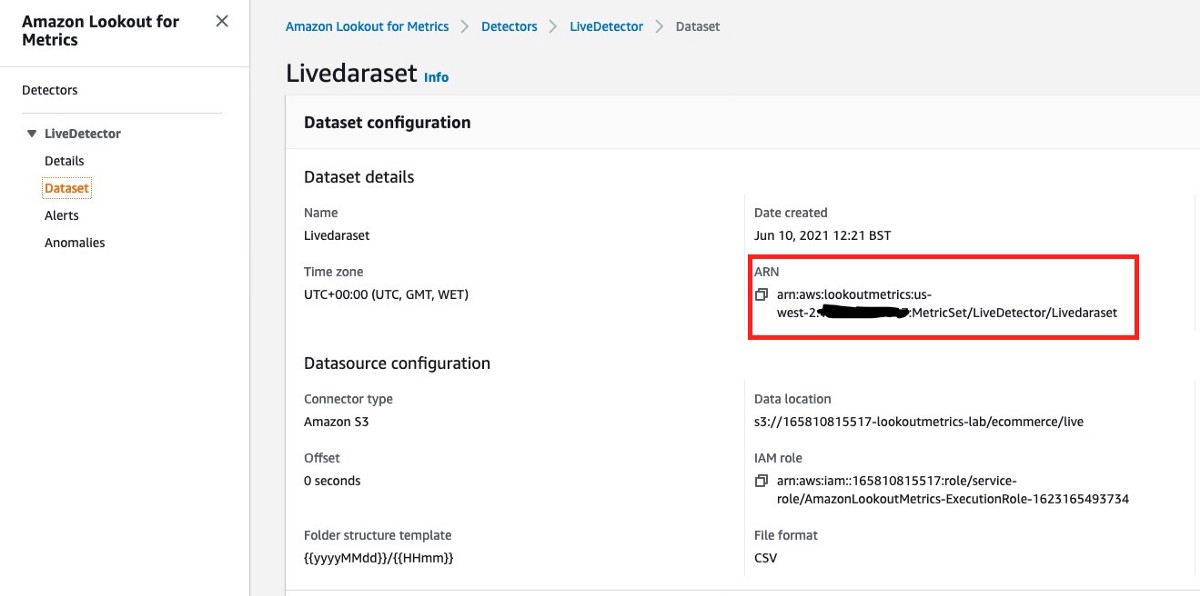
- To adapt the function to your environment, at the bottom of the code from the lambda_function.py file, make sure to update the bucket name with your bucket where you want to save the anomaly results, and the
DataSet_ARNfrom your anomaly detector. - Choose Deploy to make the changes active.
You now need to connect the Lookout for Metrics detector to your function.
- On the Lookout for Metrics console, navigate to your detector and choose Add alert.
- Enter the alert name and your preferred severity threshold.
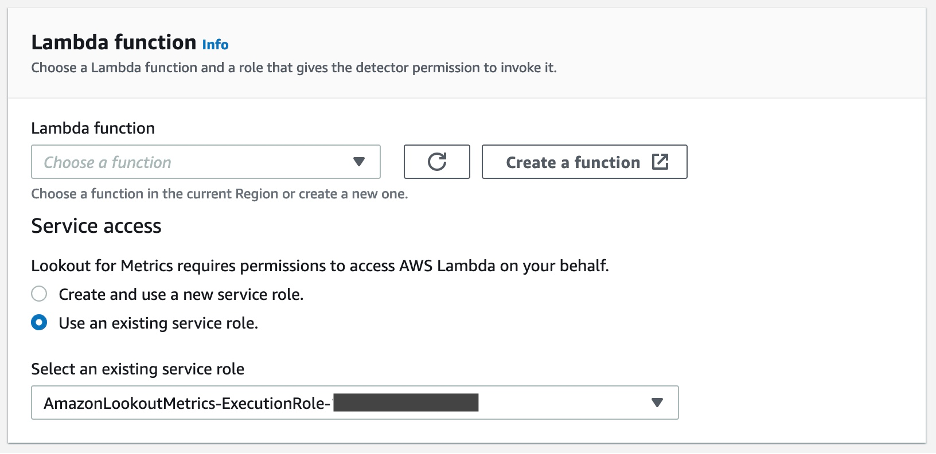
- From the channel list, choose Lambda.
- Choose the function you created and make sure you have the right role to trigger it.
- Choose Add alert.
Now you wait for your alert to trigger. The time varies depending on when the detector finds an anomaly.
When an anomaly is detected, Lookout for Metrics triggers the Lambda function. It receives the necessary information from Lookout for Metrics and checks if there is already a saved CSV file in Amazon S3 at the corresponding timestamp of the anomaly. If there isn’t a file, Lambda generates the file and adds the anomaly data. If the file already exists, Lambda updates the file with the extra data received. The function generates a separated CSV file for each different timestamp.
Create the function and alert using AWS CloudFormation
Similar to the console instructions, you download the ZIP file containing the necessary code for the Lambda function. However, in this case it needs to be uploaded to the S3 bucket in order for the AWS CloudFormation code to load it during function creation.
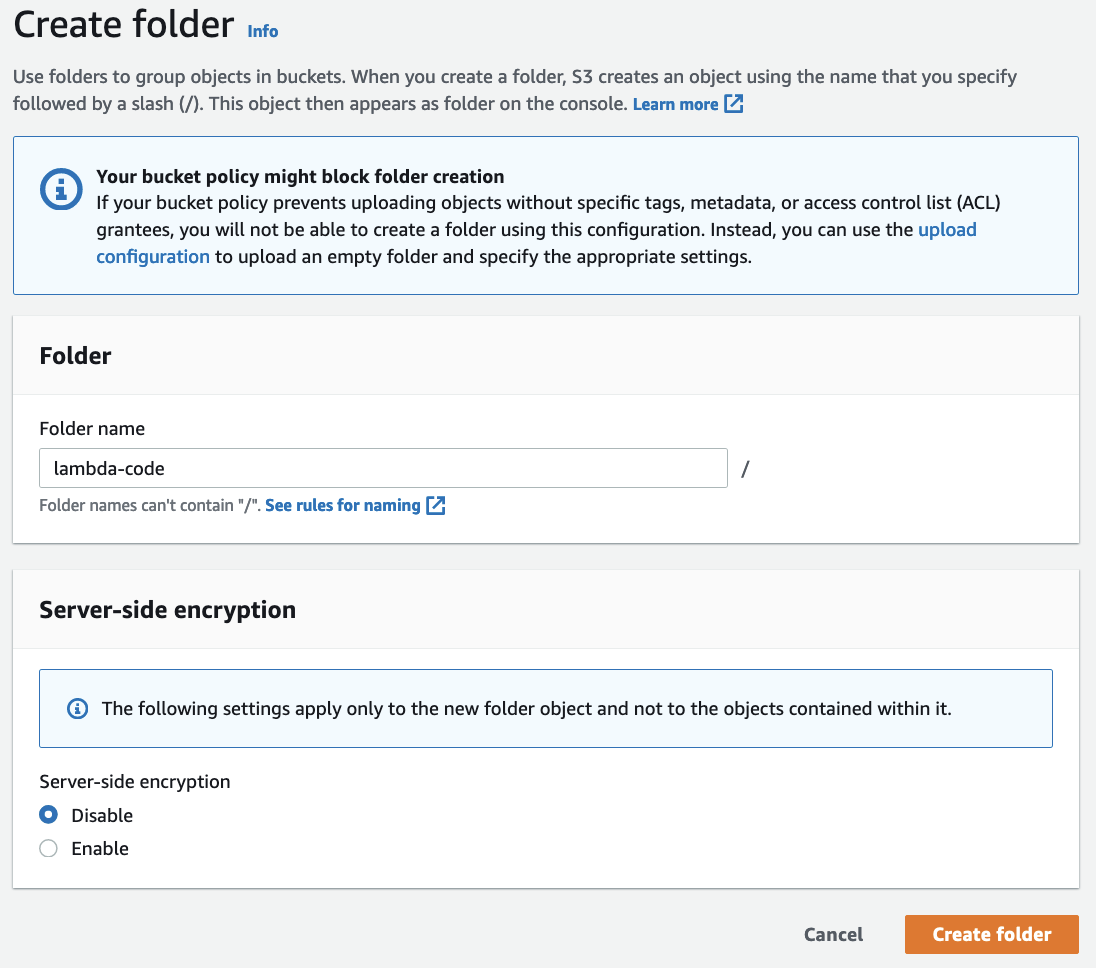
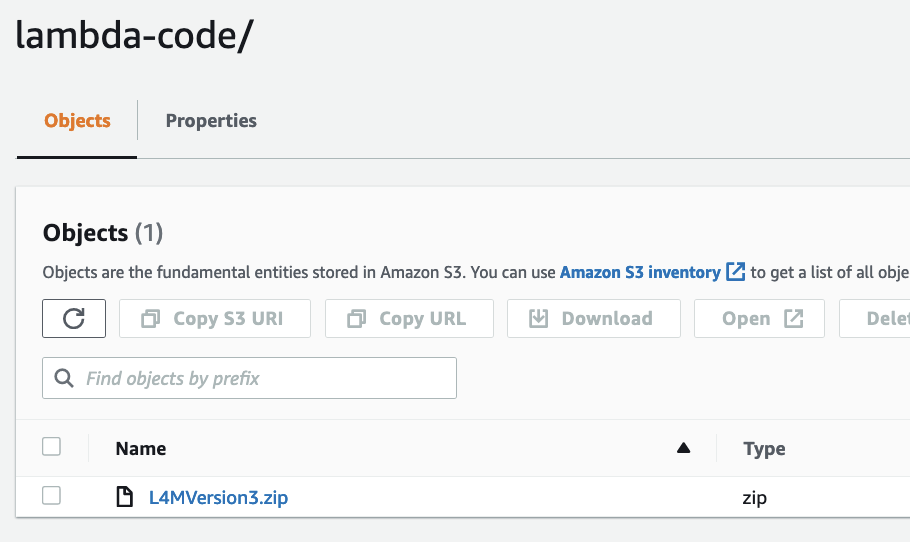
In the S3 bucket specified in the Lookout for Metrics detector creation, create a folder called lambda-code, and upload the ZIP file.
The Lambda function loads this as its code during creation.
The L4MLambdaFunction.yaml CloudFormation script creates the Lambda function and alert resources and uses the function code archive stored in the same S3 bucket.
- Launch the stack from the following link:
- On the Create stack page, choose Next.
- On the Specify stack details page, specify a stack name (for example,
L4MLambdaFunction). - In the following GitHub repo, open the CSV corresponding to the Region you’re working in and copy the ARN from the latest Pandas version.
- Enter the ARN as the Pandas Lambda layer ARN parameter.
- Choose Next.
- On the Configure stack options page, leave everything as is and choose Next.
- On the Review page, select the acknowledgement check box, leave everything else as is, and choose Create stack.
Activate the detector
Before proceeding to the next step, you need to activate the detector from the console.
- On the Lookout for Metrics console, choose Detectors in the navigation pane.
- Choose your newly created detector.
- Choose Activate, then choose Activate again to confirm.
Activation initializes the detector; it’s finished when the model has completed its learning cycle. This can take up to 2 hours.
Prepare the data for QuickSight
Before you complete this step, give the detector time to find anomalies. The Lambda function you created saves the anomaly results in the Lookout for Metrics bucket in the anomalyResults directory. We can now process this data to prepare it for QuickSight.
Create the AWS Glue crawler on the console
After some anomaly CSV files have been generated, we use an AWS Glue crawler to generate the metadata tables.
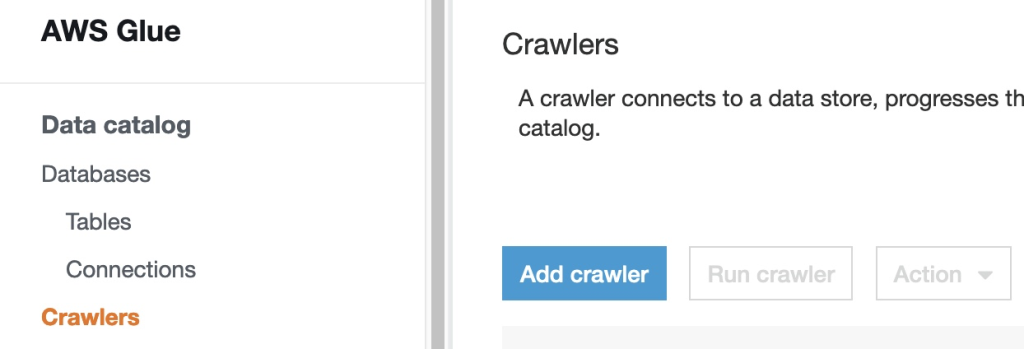
- On the AWS Glue console, choose Crawlers in the navigation pane.
- Choose Add crawler.
- Enter a name for the crawler (for example,
L4MCrawler). - Choose Next.
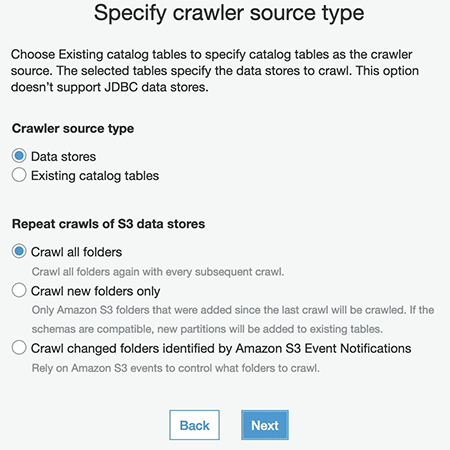
- For Crawler source type, select Data stores.
- For Repeat crawls of S3 data stores, select Crawl all folders.
- Choose Next.
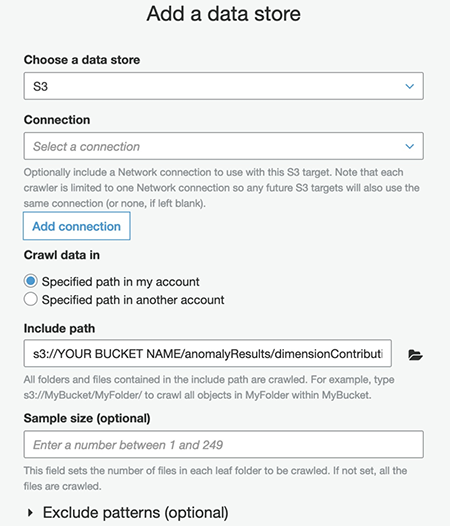
- On the data store configuration page, for Crawl data in, select Specified path in my account.
- For Include path, enter the path of your
dimensionContributionsfile (s3://YourBucketName/anomalyResults/dimensionContributions). - Choose Next.
- Choose Yes to add another data store and repeat the instructions for
metricValue_AnomalyScore(s3://YourBucketName/anomalyResults/metricValue_AnomalyScore). - Repeat the instructions again for the live data to be analyzed by the Lookout for Metrics anomaly detector (this is the S3 dataset location from your Lookout for Metrics detector).
You should now have three data stores for the crawler to process.
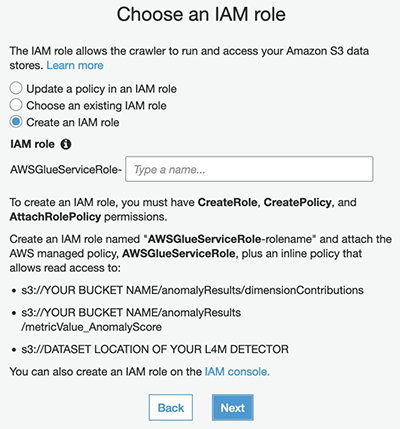
Now you need to select the role to allow the crawler to go through the S3 locations of your data.
- For this post, select Create an IAM role and enter a name for the role.
- Choose Next.
- For Frequency, leave as Run on demand and choose Next.
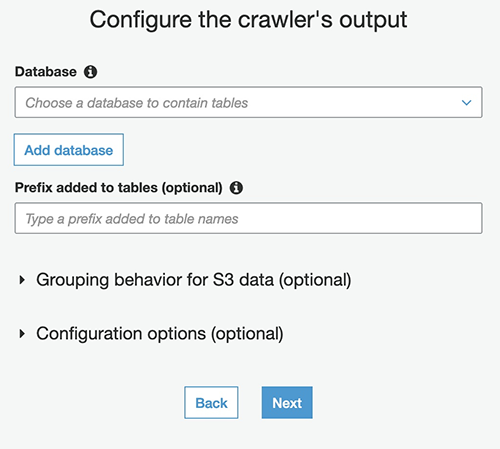
- In the Configure the crawler’s output section, choose Add database.
This creates the Athena database where your metadata tables are located after the crawler is complete.
- Enter a name for your database and choose Create.
- Choose Next, then choose Finish.
- On the Crawlers page of the AWS Glue console, select the crawler you created and choose Run crawler.
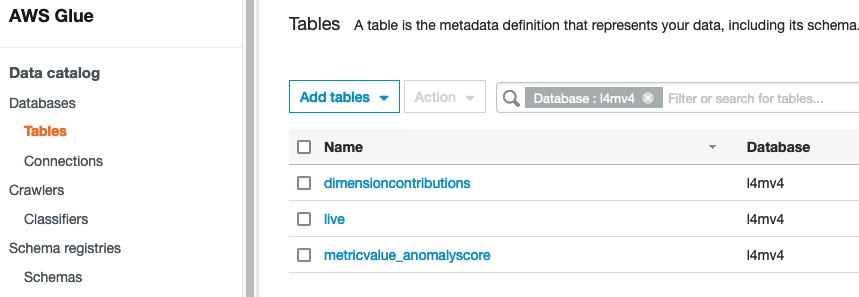
You may need to wait a few minutes, depending on the size of the data. When it’s complete, the crawler’s status shows as Ready. To see the metadata tables, navigate to your database on the Databases page and choose Tables in the navigation pane.
In this example, the metadata table called live represents the S3 dataset from the Lookout for Metrics live detector. As a best practice, it’s recommended to encrypt your AWS Glue Data Catalog metadata.
Athena automatically recognizes the metadata tables, and QuickSight uses Athena to query the data and visualize the results.
Create the AWS Glue crawler using AWS CloudFormation
The L4MGlueCrawler.yaml CloudFormation script creates the AWS Glue crawler, its associated IAM role, and the output Athena database.
- Launch the stack from the following link:
- On the Create stack page, choose Next.
- On the Specify stack details page, enter a name for your stack (for example,
L4MGlueCrawler), and choose Next. - On the Configure stack options page, leave everything as is and choose Next.
- On the Review page, select the acknowledgement check box, leave everything else as is, and choose Create stack.
Run the AWS Glue crawler
After you create the crawler, you need to run it before moving to the next step. You can run it from the console or the AWS Command Line Interface (AWS CLI). To use the console, complete the following steps:
- On the AWS Glue console, choose Crawlers in the navigation pane.
- Select your crawler (
L4MCrawler). - Choose Run crawler.
When the crawler is complete, it shows the status Ready.
Create a QuickSight account
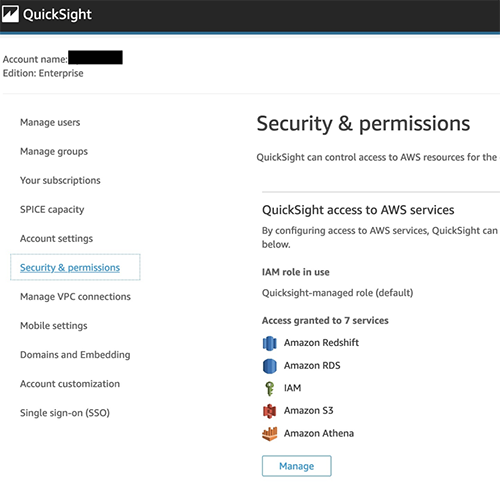
Before starting this next step, navigate to the QuickSight console and create an account if you don’t already have one. To make sure you have access to the corresponding services (Athena and S3 bucket), choose your account name on the top right, choose Manage QuickSight, and choose Security and Permissions, where you can add the necessary services. When setting up your Amazon S3 access, make sure to select Write permission for Athena Workgroup.
Now you’re ready to visualize your data in QuickSight.
Create the QuickSight datasets on the console
If this is your first time using Athena, you have to configure the output location of the queries. For instructions, refer to Steps 1–6 in Create a database. Then complete the following steps:
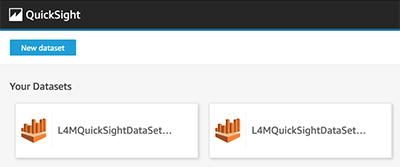
- On the QuickSight console, choose Datasets.
- Choose New dataset.
- Choose Athena as your source.
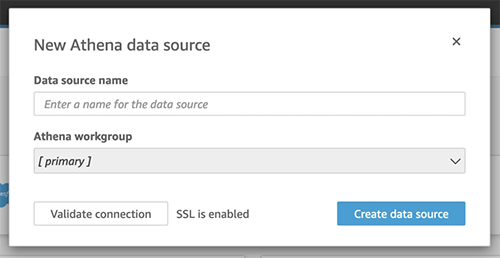
- Enter a name for your data source.
- Choose Create data source.
- For your database, specify the one you created earlier with the AWS Glue crawler.
- Specify the table that contains your live data (not the anomalies).
- Choose Edit/preview data.
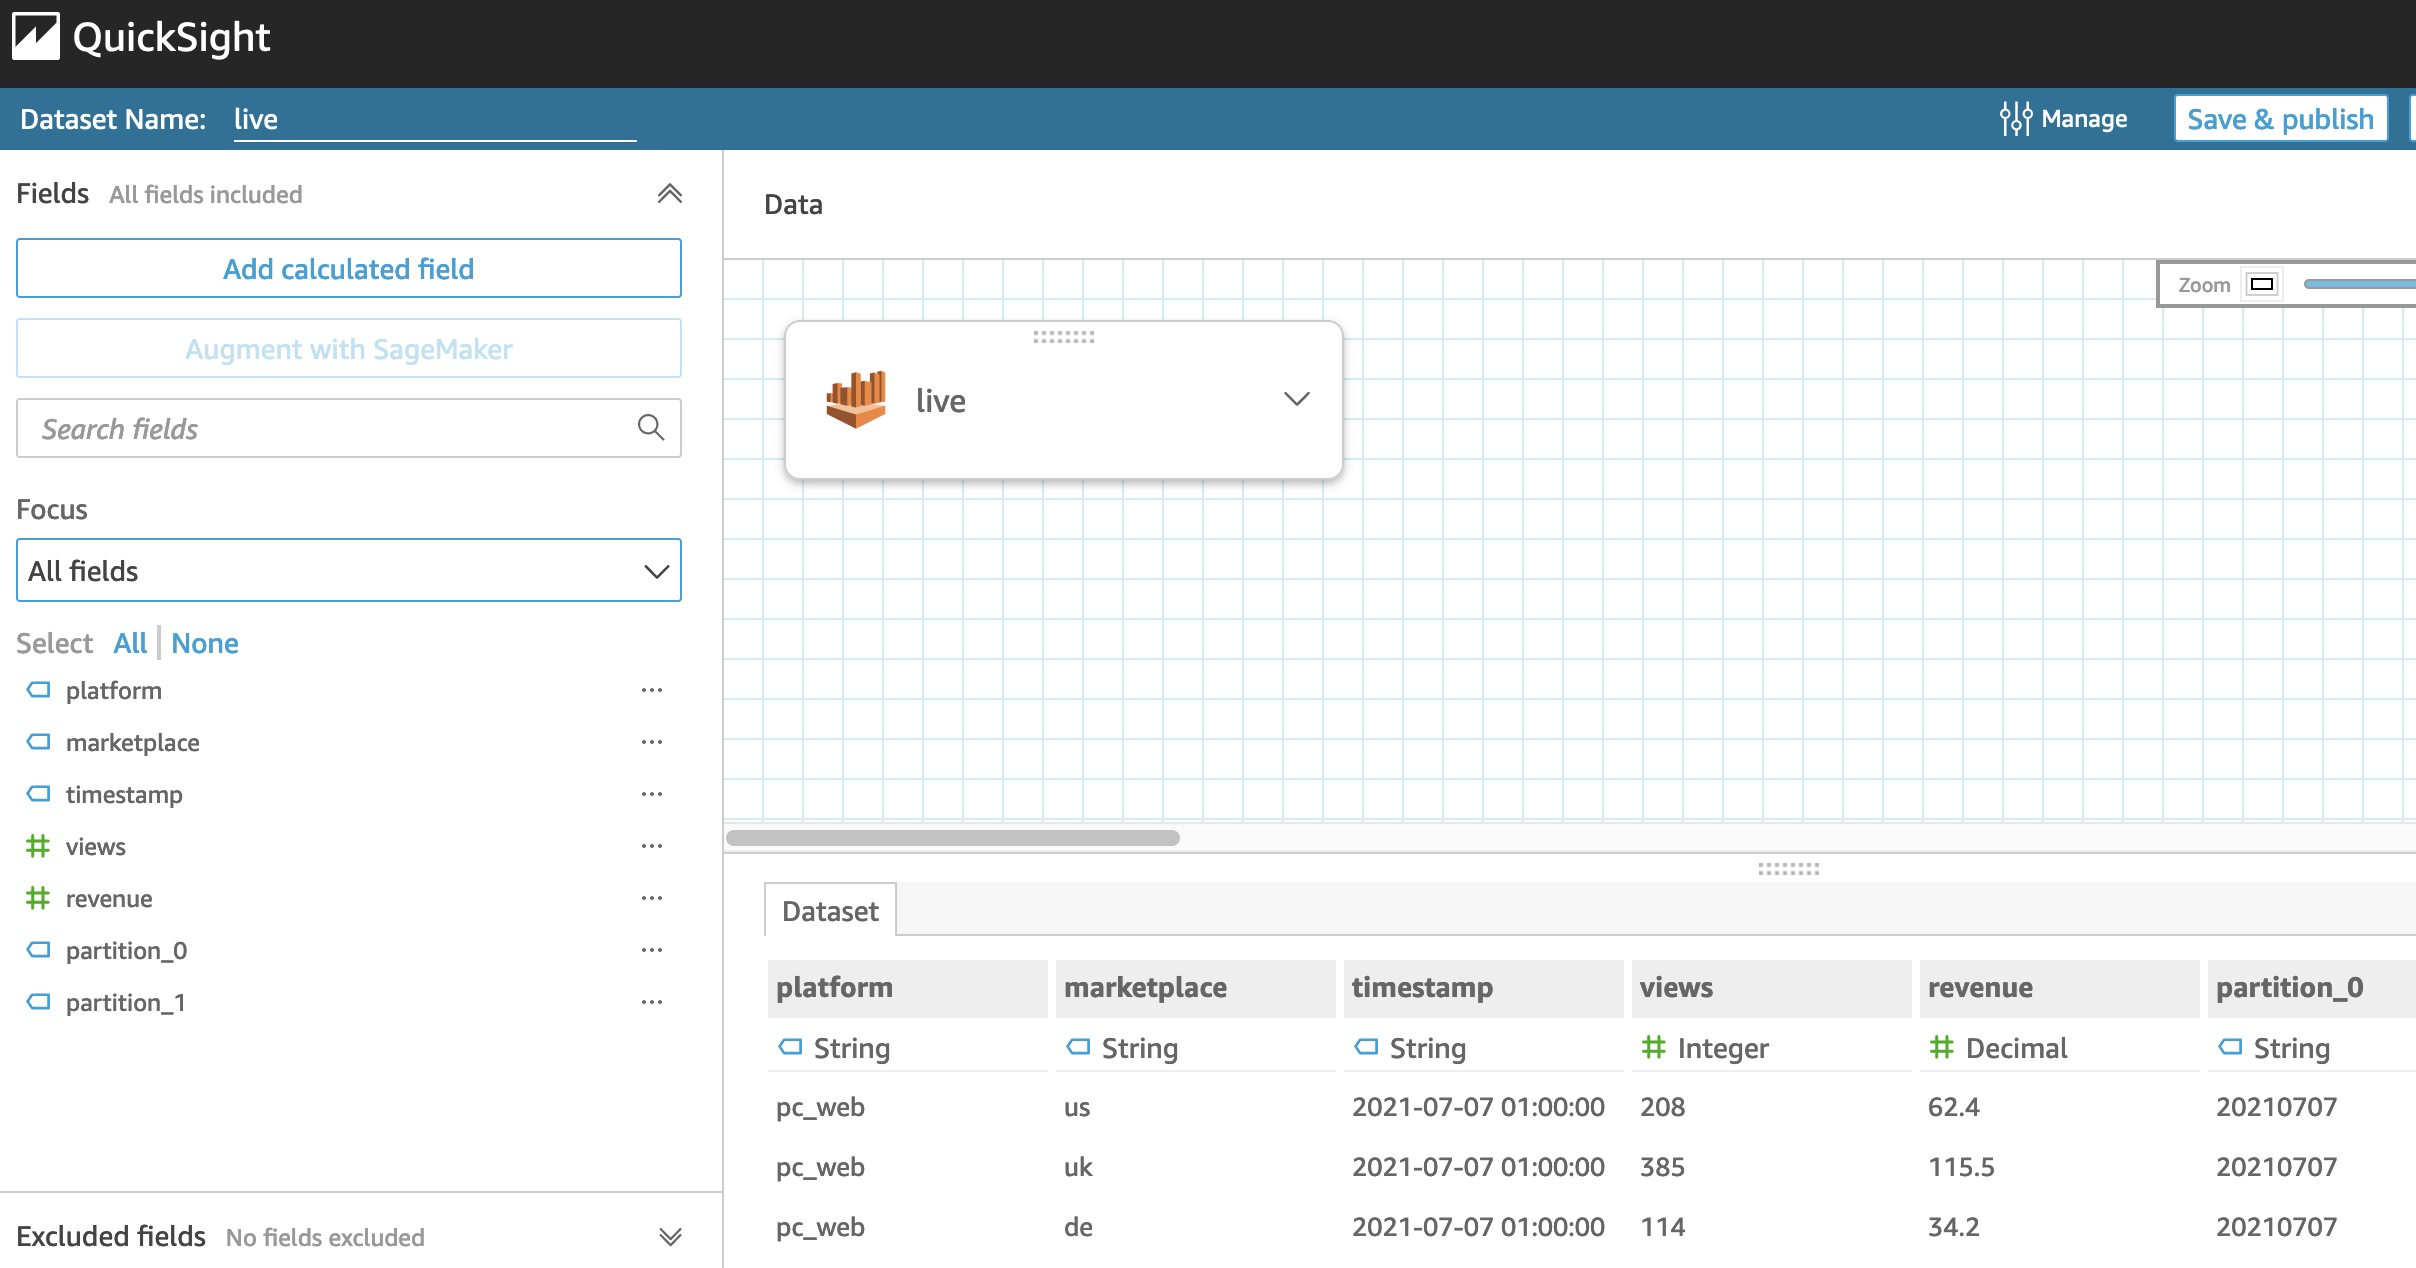
You’re redirected to an interface similar to the following screenshot.
The next step is to add and combine the metricValue_AnomalyScore data with the live data.
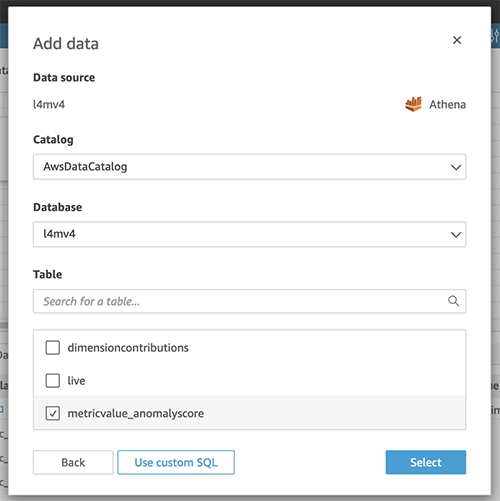
- Choose Add data.
- Choose Add data source.
- Specify the database you created and the
metricValue_AnomalyScoretable. - Choose Select.
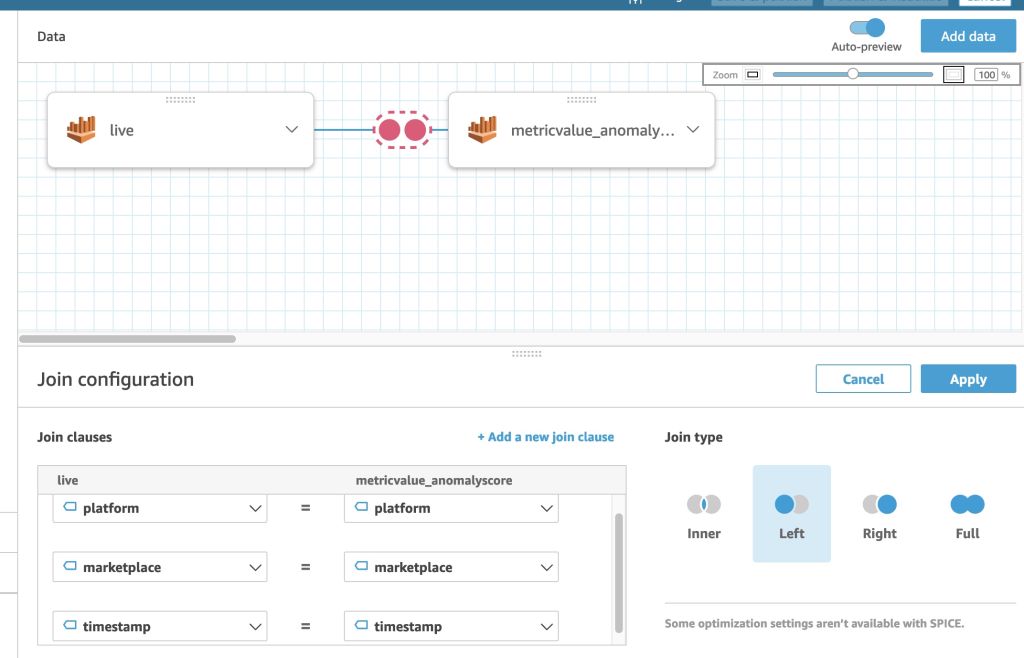
You need now to configure the join of the two tables.
- Choose the link between the two tables.
- Leave the join type as Left, add the timestamp and each dimension you have as a join clause, and choose Apply.
In the following example, we use timestamp, platform, and marketplace as join clauses.
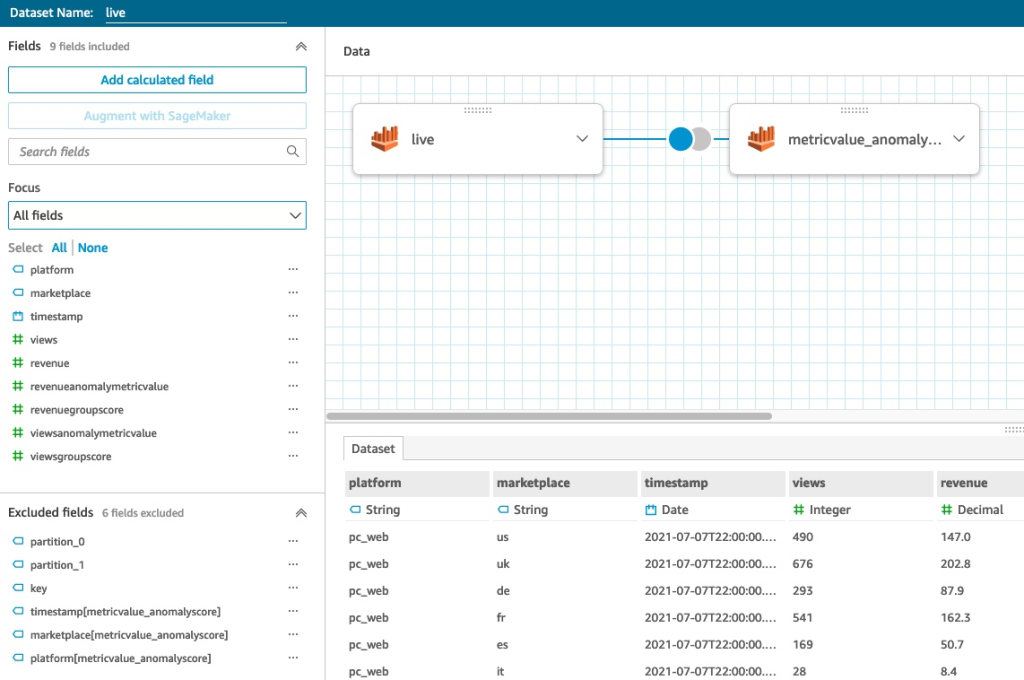
On the right pane, you can remove the fields you’re not interested in keeping.
- Remove the timestamp from the
metricValue_AnomalyScoretable to not have a duplicated column. - Change the timestamp data type (of the live data table) from string to date, and specify the correct format. In our case, it should be
yyyy-MM-dd HH:mm:ss.
The following screenshot shows your view after you remove some fields and adjust the data type.
- Choose Save and visualize.
- Choose the pencil icon next to the dataset.
- Choose Add dataset and choose
dimensioncontributions.
Create the QuickSight datasets using AWS CloudFormation
This step contains three CloudFormation stacks.
The first CloudFormation script, L4MQuickSightDataSource.yaml, creates the QuickSight Athena data source.
- Launch the stack from the following link:
- On the Create stack page, choose Next.
- On the Specify stack details page, enter your QuickSight user name, the QuickSight account Region (specified when creating the QuickSight account), and a stack name (for example,
L4MQuickSightDataSource). - Choose Next.
- On the Configure stack options page, leave everything as is and choose Next.
- On the Review page, leave everything as is and choose Create stack.
The second CloudFormation script, L4MQuickSightDataSet1.yaml, creates a QuickSight dataset that joins the dimensions table with the anomaly table.
- Launch the stack from the following link:
- On the Create stack page, choose Next.
- On the Specify stack details, enter a stack name (for example,
L4MQuickSightDataSet1). - Choose Next.
- On the Configure stack options page, leave everything as is and choose Next.
- On the Review page, leave everything as is and choose Create stack.
The third CloudFormation script, L4MQuickSightDataSet2.yaml, creates the QuickSight dataset that joins the anomaly table with the live data table.
- Launch the stack from the following link:
- On the Create stack page¸ choose Next.
- On the Specify stack details page, enter a stack name (for example,
L4MQuickSightDataSet2). - Choose Next.
- On the Configure stack options page, leave everything as is and choose Next.
- On the Review page, leave everything as is and choose Create stack.
Create the QuickSight analysis for dashboard creation
This step can only be completed on the console. After you’ve created your QuickSight datasets, complete the following steps:
- On the QuickSight console, choose Analysis in the navigation pane.
- Choose New analysis.
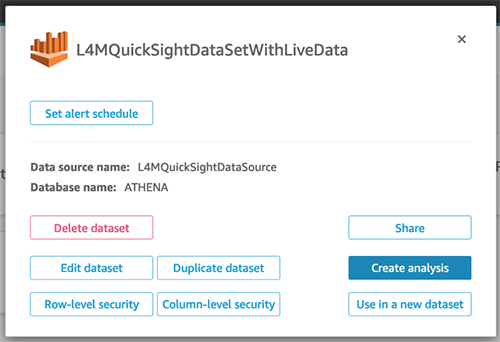
- Choose the first dataset,
L4MQuickSightDataSetWithLiveData.
- Choose Create analysis.
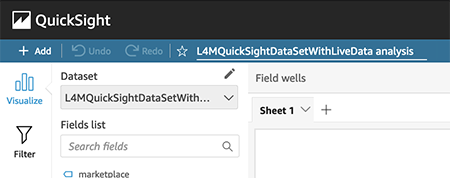
The QuickSight analysis is initially created with only the first dataset.
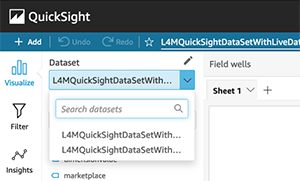
- To add the second dataset, choose the pencil icon next to Dataset and choose Add dataset.
- Choose the second dataset and choose Select.
You can then use either dataset for creating charts by choosing it on the Dataset drop-down menu.
Dataset metrics
You have successfully created a QuickSight analysis from Lookout for Metrics inference results and the live data. Two datasets are in QuickSight for you to use: L4M_Visualization_dataset_with_liveData and L4M_Visualization_dataset_with_dimensionContribution.
The L4M_Visualization_dataset_with_liveData dataset includes the following metrics:
- timestamp – The date and time of the live data passed to Lookout for Metrics
- views – The value of the views metric
- revenue – The value of the revenue metric
- platform, marketplace, revenueAnomalyMetricValue, viewsAnomalyMetricValue, revenueGroupScore and viewsGroupScore – These metrics are part of both datasets
The L4M_Visualization_dataset_with_dimensionContribution dataset includes the following metrics:
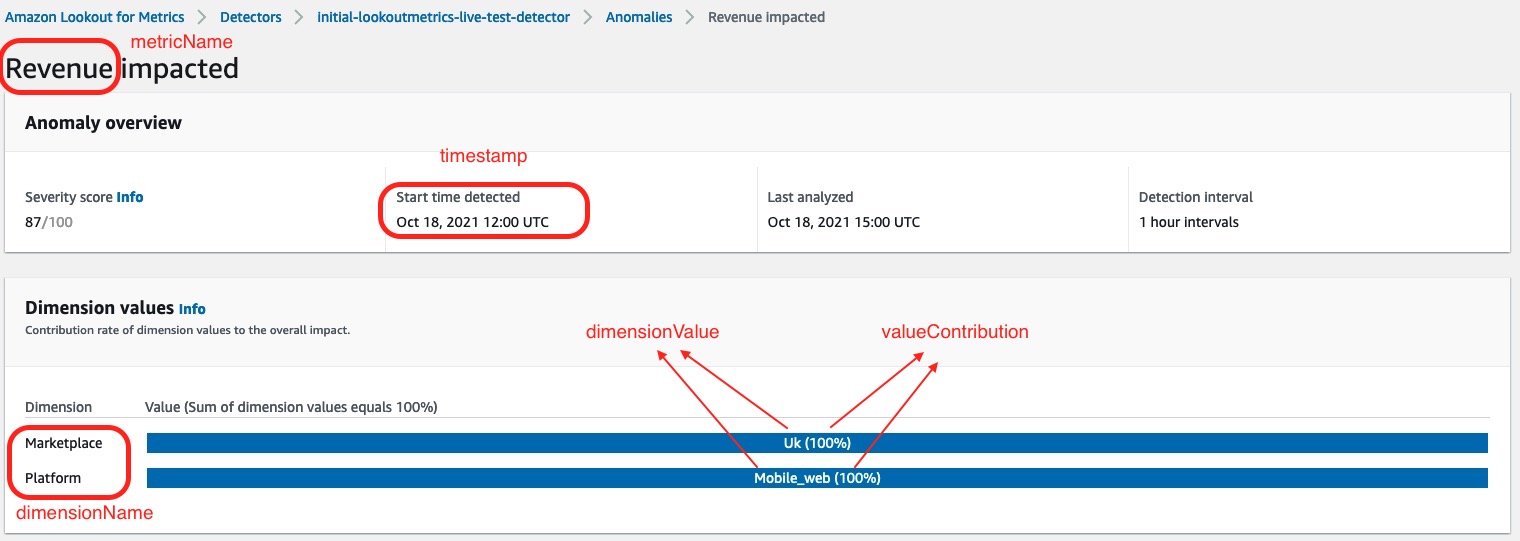
- timestamp – The date and time of when the anomaly was detected
- metricName – The metrics you’re monitoring
- dimensionName – The dimension within the metric
- dimensionValue – The value of the dimension
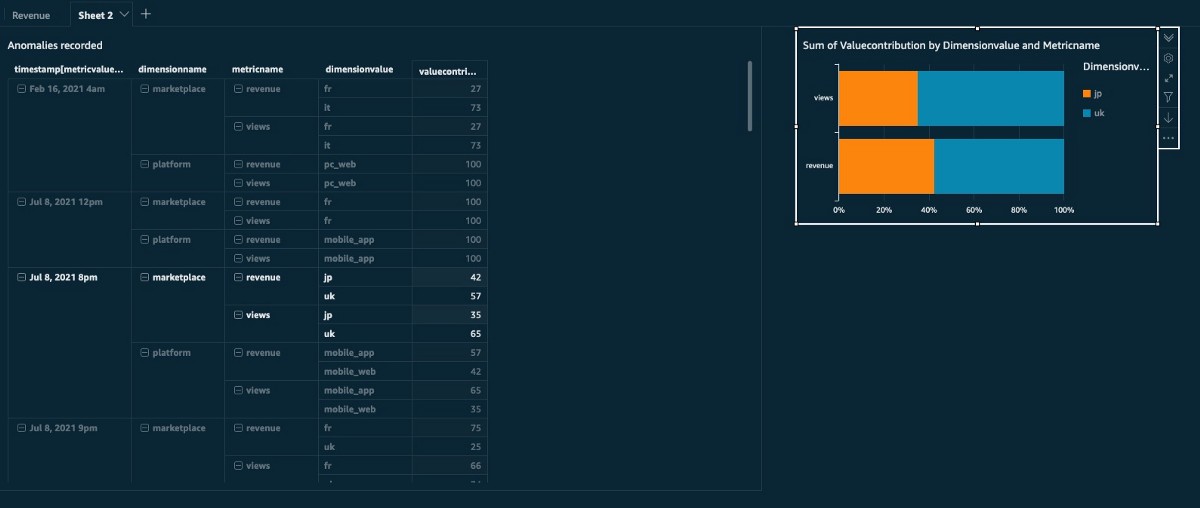
- valueContribution – The percentage on how much dimensionValue is affecting the anomaly when detected
The following screenshot shows these five metrics on the anomaly dashboard of the Lookout for Metrics detector.
The following metrics are part of both datasets:
- platform – The platform where the anomaly happened
- marketplace – The marketplace where the anomaly happened
- revenueAnomalyMetricValue and viewsAnomalyMetricValue – The corresponding values of the metric when the anomaly was detected (in this situation, the metrics are revenue or views)
- revenueGroupScore and viewsGroupScore – The severity scores for each metric for the detected anomaly
To better understand these last metrics, you can review the CSV files created by the Lambda function in your S3 bucket where you saved anomalyResults/metricValue_AnomalyScore.
Next steps
The next step is to build the dashboards for the data you want to see. This post doesn’t include an explanation on creating QuickSight charts. If you’re new to QuickSight, refer to Getting started with data analysis in Amazon QuickSight for an introduction. The following screenshots show examples of basic dashboards. For more information, check out the QuickSight workshops.
Conclusion
The anomalies are presented individually on the Lookout for Metrics console, each with their own graph, making it difficult to view the set as a whole. An automated, integrated solution is needed for deeper analysis. In this post, we used a Lookout for Metrics detector to generate anomalies, and connected the data to QuickSight to create visualizations. This solution enables us to conduct deeper analysis into anomalies and have them all in one single place/dashboard.
As a next step, this solution could as well be expanded by adding an extra dataset and combine anomalies from multiple detectors. You could also adapt the Lambda function. The Lambda function contains the code that generates the data sets and variable names that we use for the QuickSight dashboards. You can adapt this code to your particular use case by changing the data sets itself or the variable names that make more sense to you.
If you have any feedback or questions, please leave them in the comments.
About the Authors
 Benoît de Patoul is an AI/ML Specialist Solutions Architect at AWS. He helps customers by providing guidance and technical assistance to build solutions related to AI/ML when using AWS.
 Paul Troiano is a Senior Solutions Architect at AWS, based in Atlanta, GA. He helps customers by providing guidance on technology strategies and solutions on AWS. He is passionate about all things AI/ML and solution automation.


