AWS Cloud Operations Blog
Amazon Managed Grafana is now Generally Available
At re:Invent 2020, we introduced Amazon Managed Grafana and made it available in preview. Since then, we’ve been working on numerous enhancements that were made available during preview. Now we’re excited to launch Amazon Managed Grafana in General Availability (GA), and with this post we’ll lay out exactly what this means.

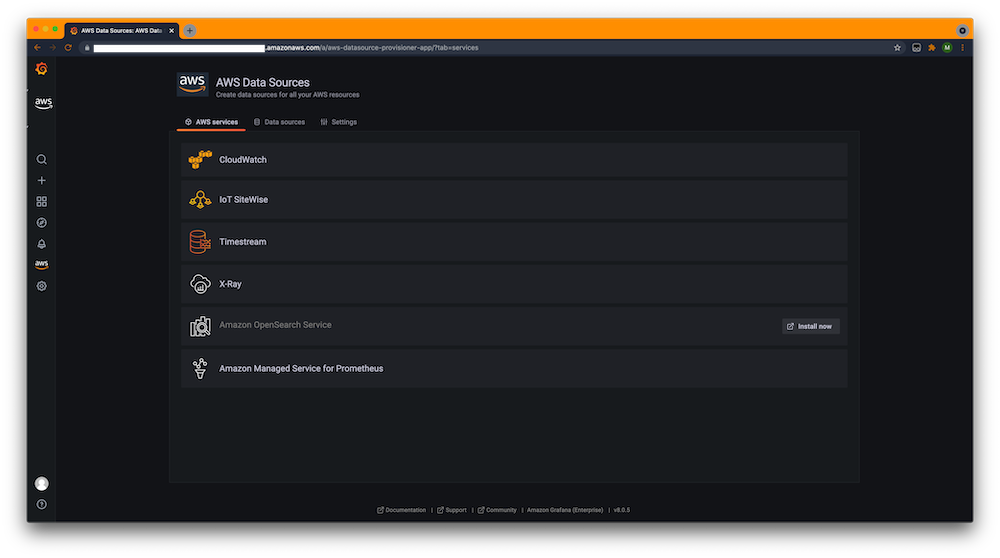
Figure 1: List of AWS datasources on Amazon Managed Grafana
Throughout the preview period, we’ve seen a lot of interest in Amazon Managed Grafana and noticed many use cases from our customers using it. These range from the natural habitat Grafana populates with Prometheus in the context of Kubernetes workloads, specifically in conjunction with our Amazon Managed Service for Prometheus (AMP) offering, to Internet of Things (IoT) use cases and kiosk usages. Moreover, we’ve seen Amazon Managed Grafana applied in transportation verticals, financial institutions, as well as retail.
Heavily influenced by the feedback from our customers in preview, we decided to prioritize authentication options, automation, and support more regions for GA. Furthermore, we’re taking advantage of the many new features in Grafana 8, as part of our collaboration with Grafana Labs. We’ve also heard that many of you would like support for more plugins, so we’ve added 9 new plugins that are automatically available in Amazon Managed Grafana, no installation required.
So, let’s dive into what’s new for Amazon Managed Grafana and, in case you want a more hands-on approach, we’ll refer to some deep-dive content, demonstrating the features in action.
More authentication options
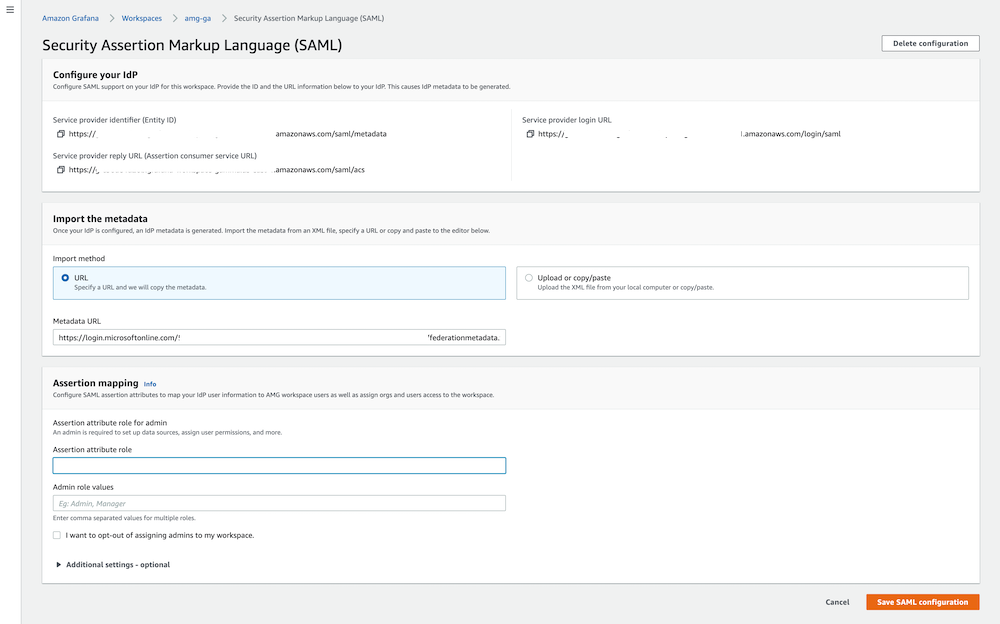
This launch enables customers to configure their Amazon Managed Grafana workspaces to authenticate users via two options. Along with utilizing AWS SSO for user authentication, customers can now configure Security Assertion Markup Language (SAML) v2 based Identity Providers (IdP) directly in Amazon Managed Grafana without needing AWS SSO. This allows customers utilizing IdPs, as explained in the next section on Partners, to directly configure Amazon Managed Grafana to authenticate users with the IdP of choice and provide a seamless end-user experience.
To discover how to configure these Identity Providers in Amazon Managed Grafana and explore the dedicated SAML applications built by our IdP partners to simplify the SAML setup, take a look at our blog post here as well as the Google IdP recipe.

Figure 2: SAML metadata configuration in Amazon Managed Grafana
Partners
Identity providers
We’ve teamed up with popular Identity Providers, such as OneLogin, Okta, Ping Identity, Azure AD,and CyberArk, to create a seamless experience for setting up SAML authentication with Amazon Managed Grafana. Moreover, customers can utilize their personal choice of SAML 2.0 based Identity Providers. This allows greater flexibility in selecting the IdP of their choice and the utilization of the existing IdP without interrupting user workflow.
Datasource providers
Amazon Managed Grafana supports multiple datasources for customers to connect to and visualize data from. Along with several other datasources, the following is a sample list of datasource plugins that are available through Grafana Enterprise license:
- Datadog
- NewRelic
- DynaTrace
- AppDynamics
- VMware Tanzu Observability by Wavefront
- MongoDB
System Integration partners
To help our customers deploy Amazon Managed Grafana in their environments, we’ve teamed up with the following partners at launch:
Automation
With GA, we added support for API keys in Amazon Managed Grafana, allowing you to automate the creation of dashboards and other Grafana resources. The API key is an RFC 6750 HTTP Bearer header with a 51 character long alpha-numeric value authenticating the caller with every request against the Grafana API. These API keys have a maximum lifetime of 30 days, and you should treat them like passwords. Utilize good practices around sensitive information, such as not storing them in plain text.
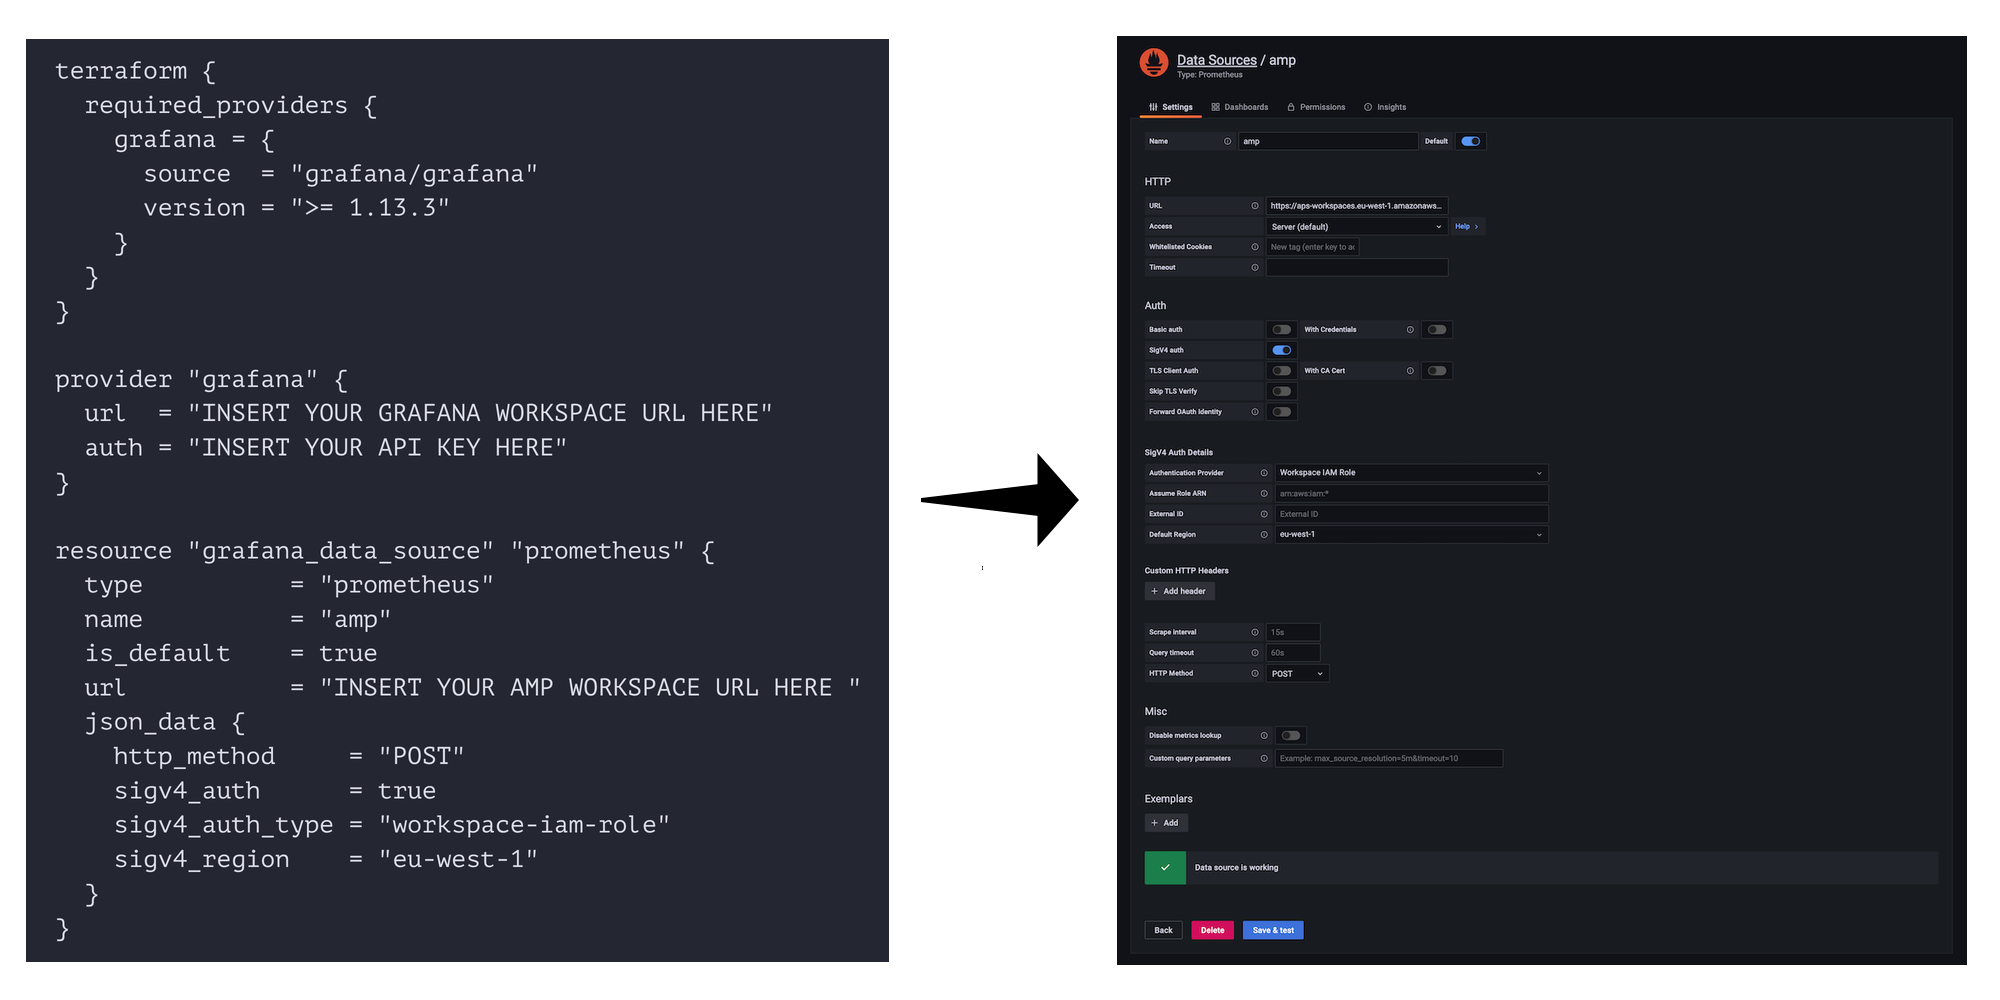
To discover how to use Terraform for Grafana automation, check out the relevant observability recipe. We’ll show you how to use the Terraform Grafana provider to add a Prometheus (AMP) data source to Amazon Managed Grafana:

Figure 3: Example of how terraform configuration translates into a data source setting in Amazon Managed Grafana
Another GA feature of Amazon Managed Grafana that’s relevant to automation, especially in heavily regulated environments, is the AWS CloudTrail integration. CloudTrail captures API calls for Amazon Managed Grafana as events, which you can then consume via an Amazon S3 bucket. CloudTrail then lets you determine who made the request, the type of request, as well as the associated IP address and other details. For now, we’re focusing on control plane related events, namely Amazon Managed Grafana workspace management, workspace permission updates, as well as Grafana Enterprise license associations.
Available in 10 regions
The preview started in the US East (N. Virginia) as well as Europe (Ireland), and this GA launch lets you utilize Amazon Managed Grafana worldwide, specifically in the ten following regions:
- US East (N.Virginia)
- US East (Ohio)
- US West (Oregon)
- Europe (Ireland)
- Europe (Frankfurt)
- Europe (London)
- Asia Pacific (Sydney)
- Asia Pacific (Tokyo)
- Asia Pacific (Singapore)
- Asia Pacific (Seoul)
Grafana 8
In the preview we offered Grafana 7, now GA lets us upgrade to Grafana 8 with the following features:
- Library panels let users build panels that can be utilized in multiple dashboards. Any updates made to that shared panel will then automatically be applied to every dashboard that has that panel.
- The Prometheus metrics browser lets you quickly find metrics and select relevant labels in order to build basic queries. If supported by your Prometheus instance, each metric will show its HELP and TYPE as a tooltip.
- New visualizations:
- New datasource updates:
- Azure Monitor
- OpenSearch
- Google Cloud Monitoring
- Graphite
- Jaeger
Breaking changes with version 8 include:
- The value groups/tags feature was removed from variables.
- The “never refresh” option for query variables was removed, existing variables will be migrated, and any stored options will be removed.
- For multi-search requests, Grafana 8 now uses the correct application/x-ndjson content type instead of the incorrect application/json
- The default HTTP method for Prometheus data source is now POST, while previously it was GET. If you are using a Prometheus version older than 2.1.0 that uses the default HTTP method, then you should update the HTTP method to GET.
In addition to the Grafana 8 features, we also added nine new data source plugins, based on customer feedback:
- Gitlab (Enterprise plugin)
- Google BigQuery
- Honeycomb (Enterprise plugin)
- Atlassian Jira (Enterprise plugin)
- JSON data source
- Redis
- Salesforce (Enterprise plugin)
- SAP HANA (Enterprise plugin)
Next steps
Try Amazon Managed Grafana today! We have recipes and further resources for utilizing Amazon Managed Grafana currently available via the observability recipes site.
Furthermore, please let us know the other regions you plan to use Amazon Managed Grafana in, as well as which features you want to see next, and then share your use cases with us. We love to hear what plugins you like using and what is missing.
Last but not least, if you want to learn more and see Amazon Managed Grafana in action, we invite you to join our webinar on September 9th from 9am to 10:15am PST. You can register for the webinar today, and we look forward to seeing you there.