AWS Cloud Operations Blog
How to monitor application health using SLOs with Amazon CloudWatch Application Signals
Today, customers operate tens, hundreds, or even thousands of applications arranged in complex distributed systems composed of many interdependent services. These applications need to be continuously available and performant to maintain end-user satisfaction and business growth. Amazon CloudWatch Application Signals (now in Preview) makes it easy to automatically instrument and operate applications on AWS to track application performance against your most important objectives.
CloudWatch Application Signals can monitor services written in Java running on Amazon EKS, Amazon ECS, and Amazon EC2 and provides you with a pre-built, standardized dashboard showing the most important metrics for application performance – volume, availability, latency, faults, and errors – for each of your applications on AWS. CloudWatch Application Signals also integrates with myApplications in the AWS Management Console and supports application operations, a new set of capabilities that help you get started with your applications on AWS, operate them with less effort, and move faster at scale.
Customers need to keep their applications continuously available and performant to maintain end-user satisfaction and business growth. To document these expectations, availability and performance are often backed by a Service Level Agreement (SLA). There are several challenges that SLAs present. SLAs are often static, they can be hard to change, and they can be difficult to track, particularly in large distributed systems where there are a lot of different subsystems and metrics.
One way to overcome the challenges of SLAs is by using Service Level Objectives (SLOs) instead. While SLAs are the external agreement between you and your end-users, SLOs are your internal measures to determine if your SLA is being met. SLOs are different from SLAs in a few different ways:
- SLOs are typically more flexible: Service operators have more control to define and manage which metrics qualify for an SLO.
- SLOs help service operators: SLOs allow service operators to improve the end-user experience over time by setting clear, simple objectives for service availability, latency, or even both.
- SLOs are trackable: It’s key to keep your SLOs clear and simple which means they are also easier to track and inspect reliably over time.
Introducing Amazon CloudWatch Application Signals
CloudWatch Application Signals makes it easy to automatically instrument and operate applications on AWS based on best practices for application performance monitoring. CloudWatch Application Signals will automatically discover and populate a list of services with no additional setup other than to install the CloudWatch Agent Operator and emit telemetry data to CloudWatch Application Signals. For more information on the data collected for CloudWatch Application Signals, see the Standard application metrics collected page.
CloudWatch Application Signals introduces two new concepts to help you monitor your applications: Service Level Indicator and Service Level Objective.
- Service Level Indicator (SLI) – the metric used to determine if you are meeting your end Service Level Objective (SLO) goal. SLIs represent the actual experience that users are having, such as latency or availability and use a threshold to determine if that is a tolerable experience or not.
- Service Level Objective (SLO) – a mechanism to monitor the reliability of your services against your customer’s expectations. With SLOs you define an SLI and an attainment goal for how often your service is in compliance with the SLI over a longer time period. For example, my GetResource API will achieve a latency of less than 1000ms 99.9% of 1-minute periods in a rolling 14-day interval. You can create an SLO on any CloudWatch metric, not just those metrics which have been collected through CloudWatch Application Signals.
Creating SLOs is very important for getting the most benefit from CloudWatch Application Signals. After you create SLOs, you can view their status in the CloudWatch Application Signals console to quickly see which of your services and operations are performing well and which are unhealthy. Having SLOs to track provides the following major benefits:
- It is easier for your service operators to see the current operational health of critical services as measured against the SLI. Then they can quickly triage and identify unhealthy services and operations.
- You can track your service performance against measurable business goals over longer periods of time. By choosing what to set SLOs on, you are prioritizing what is important to you. The CloudWatch Application Signals console automatically presents information about what you have prioritized.
In this post, we will demonstrate how to set up an SLO in CloudWatch Application Signals to monitor the reliability of a service against customer expectations. Then, we will demonstrate how you can view your SLIs to assess the health of your services and their operations at a glance.
Prerequisites
To use CloudWatch Application Signals, you need:
- An AWS account
- A Java application running on a supported system
- CloudWatch Agent Operator installed
- Role with trust policy and permissions needed
Setting up SLOs in Amazon CloudWatch Application Signals
In CloudWatch Application Signals, you can easily create SLOs using Service Operations. Creating an SLO on a Service Operation links that SLO definition with your service.
In this section, we will be creating a new SLO which monitors the latency of a service operation within a notional web application.
- Open the CloudWatch console.
- In the navigation pane, choose Service Level Objectives (SLO) under Application Signals.
- Click any one of the Create SLO buttons. You can also create an SLO directly from a Services page. When you choose to create an SLO from the Services page, the service and/or operation are pre-selected.
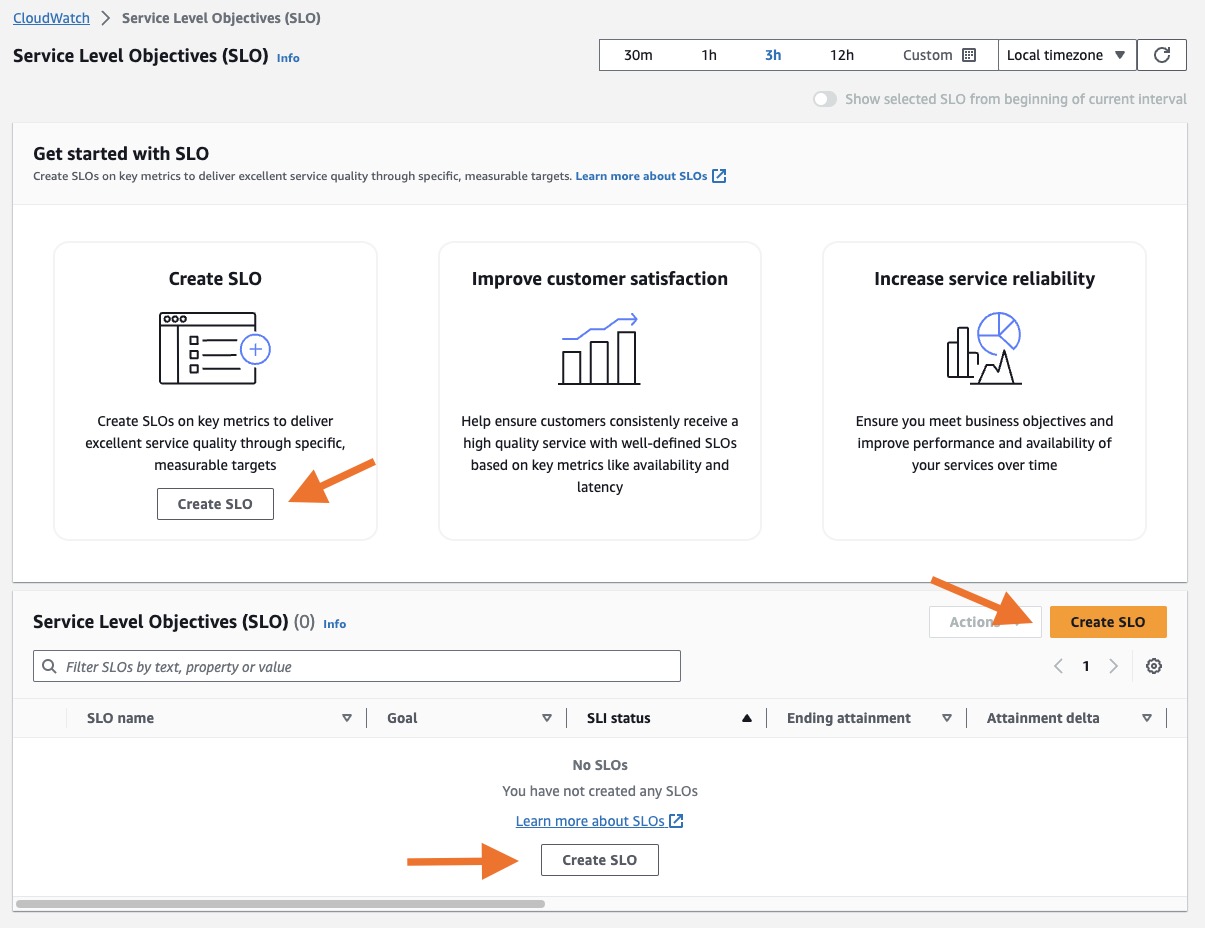
Figure 1: CloudWatch Application Signals Service Level Objectives
- You can select a name for your SLO and the type of Service Level Indicator to use: Service Operation or CloudWatch Metric. If you set your SLI using Service Operation, available services and operations are automatically discovered by Application Signals, making setup easier. If you set your SLI using CloudWatch Metric, you can create an SLO on any CloudWatch metric, not just those metrics which have been collected through CloudWatch Application Signals. Finally, you set the condition you want to track, latency or availability. We recommend that you set both latency and availability SLOs on your critical applications.
In this example, we are creating an SLO using a Service Operation to monitor one of the front end APIs for latency of over 1000ms. A text-based description of the criteria for your SLI is defined at the bottom of the Set Service Level Indicator section to describe when the selected service will be considered good and healthy based on the options set. You can also optionally change the period for which the indicator is evaluated as well as the statistic used for the evaluation under Additional settings.
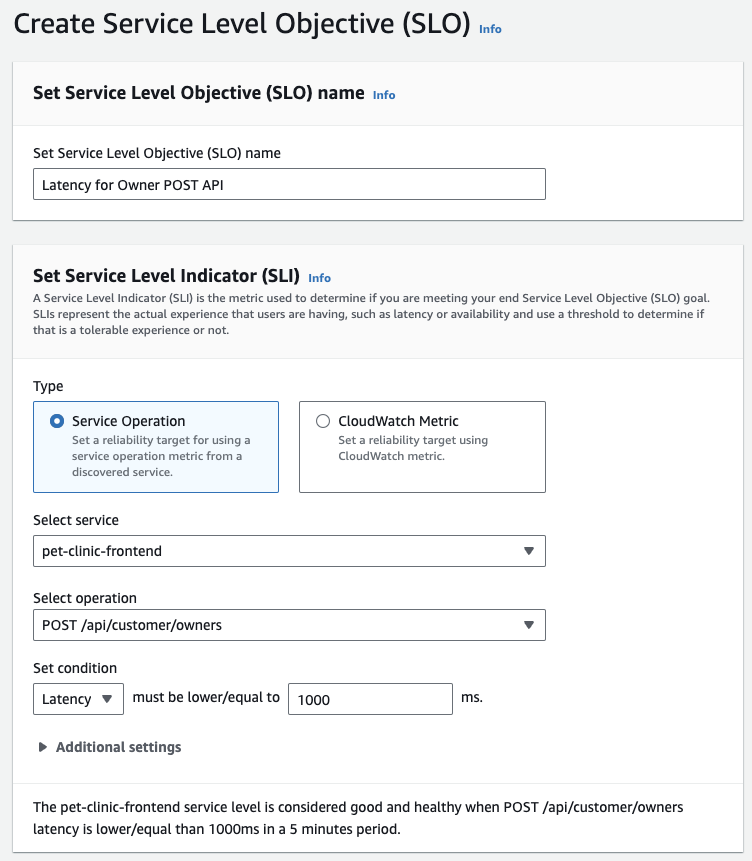
Figure 2: Create Service Level Objectives using a Service Operation
The Service Level Objective defines the reliability of your service against customer expectation as measure using your SLI. SLOs have a defined goal used to determine if you’re meeting the expectations of your customer expectations over a longer time interval. The interval is the time window used to calculate SLO attainments. This will be a numerical value combined with a time span (ex. 12 hours or 2 weeks) There are two types of intervals:
- Rolling interval: Calculates SLO on a rolling basis. This method is better for tracking recent user experience of an application.
- Calendar-aligned interval: Calculates SLO on a calendar-aligned basis. This method is better for SLOs that map to business goals that are measured on a calendar-aligned basis, such as every calendar month, every quarter, or every year.
Together, the interval and attainment goal give you an error budget, which is the amount of time you’re allowed to not meet your SLI condition before your SLO is breached. See the SLO concepts page for more information on error budgets and attainment.
- Define the SLO condition using the interval and attainment goal. In this example, we are tracking the SLO on a rolling 1-day interval and have an attainment goal of 99%. A text-based description of the criteria for your SLO is defined at the bottom of the Set Service Level Objection section to describe your SLO goals based on the options set.
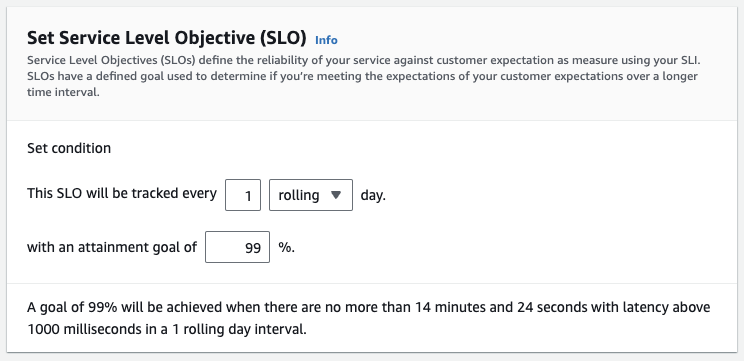
Figure 3: Set Service Level Objective interval and attainment goal
- You can optionally select to automatically create up 3 CloudWatch Alarms to get notified anytime your SLI is not meeting the condition defined, when your SLO breaches its attainment goal, or a warning for when you are close to running out of error budget. Additionally, SLOs produce their own metrics, which allows you to create more advanced and targeted custom alarms based on your requirements.
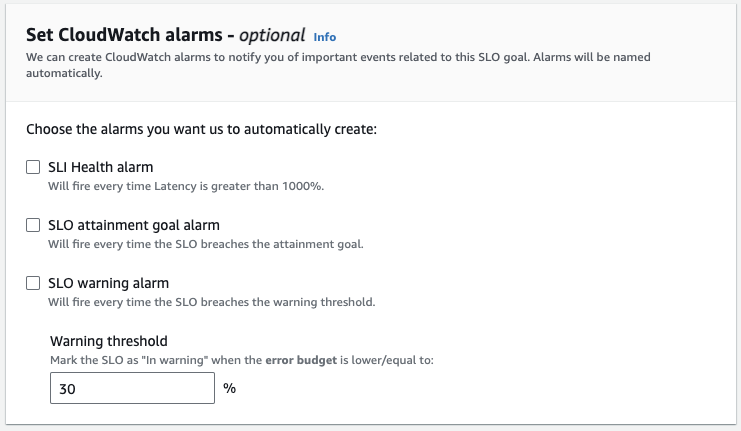
Figure 4: Configure CloudWatch alarms for SLO goal
- Select Create SLO.
- After creating an SLO using a Service Operation, you can view the new SLO in the SLO list page.
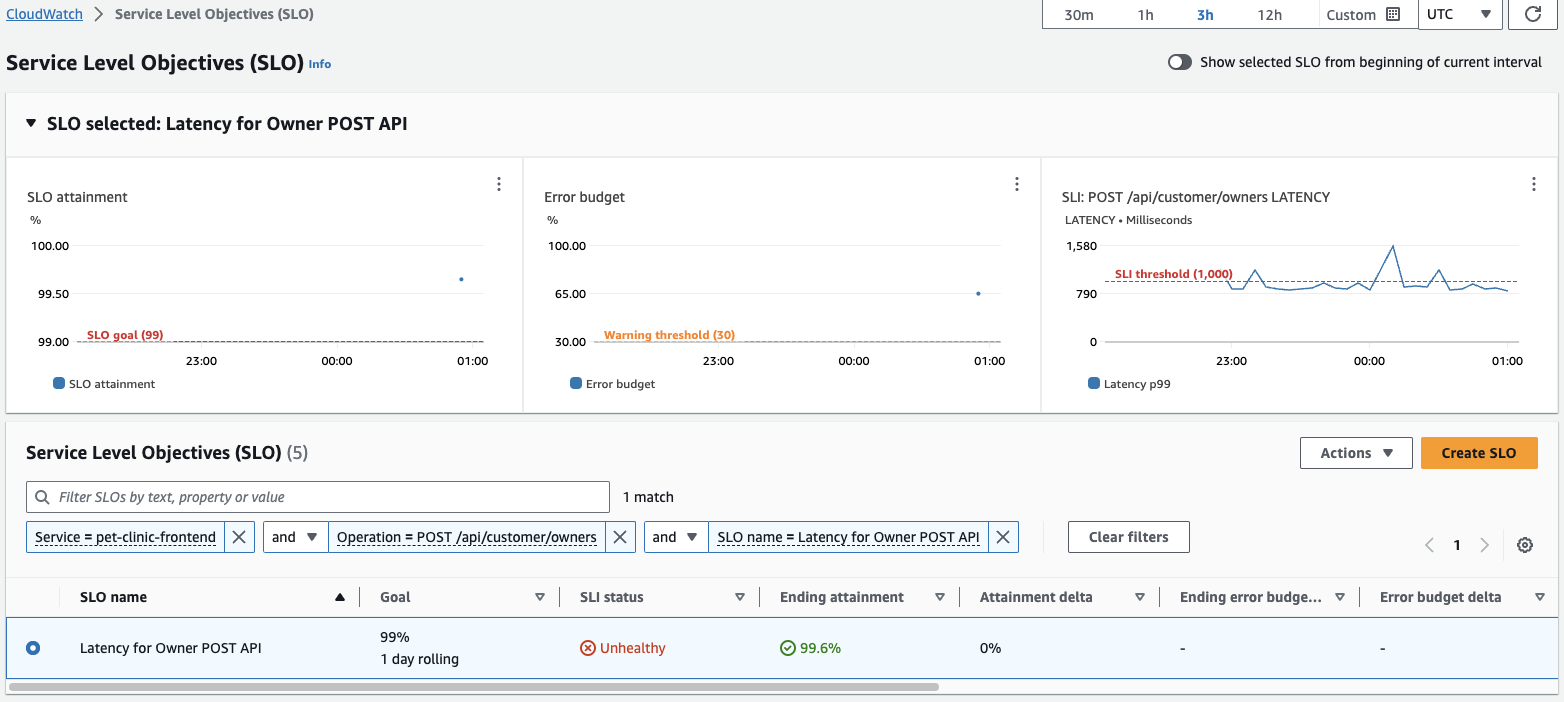
Figure 5: View Service Level Objectives summary
Leverage SLIs to assess service health
Once you have defined SLOs, you can use the SLIs to assess the health of your services and their operations at a glance.
The Service Level Objectives view gives you a macro view of your organization and how your services and operations are performing against expectations over longer periods of time based on the SLIs defined.
SLI status is determined by evaluating if your SLI met it’s expected threshold for all data points within the time range selected on the SLO dashboard. For example, if you have 3 hours selected as your time range, the SLI status for your SLO would be considered Unhealthy if more than one data point breached your defined threshold within the last 3 hours. If all data points in the previous 3 hours met defined threshold, the SLI status would be considered Healthy.
The SLI status is displayed in several CloudWatch Application Signals dashboards and can alert service operators that the service needs to be investigated. SLIs can be the entry point to the triage and investigation workflow using CloudWatch Application Signals.
- Open the CloudWatch console.
- In the navigation pane, choose Service Level Objectives (SLO) under Application Signals. The Service Level Objectives (SLO) list appears. You can quickly see the current status of your SLOs in the SLI status column. To sort the SLOs so that all the unhealthy ones are at the top of the list, choose the SLI status column until the unhealthy SLOs are all at the top. The SLO table has many default columns. For a full description of each of the default columns, see View and triage SLO status.
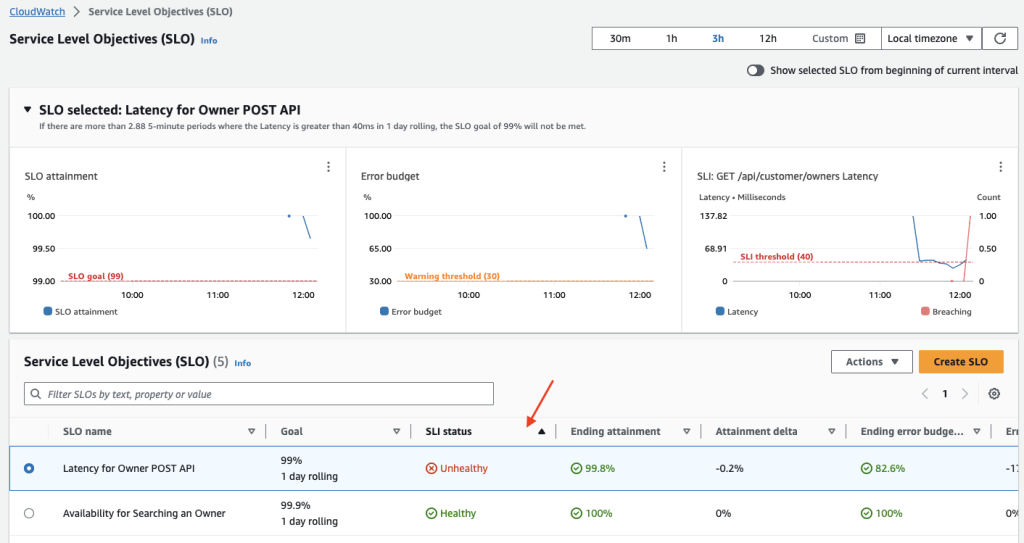
Figure 6: Sort on SLI status to view Unhealthy SLIs
- To see the attainment and error budget graphs for an SLO, choose the radio button next to the SLO name. The graphs at the top of the page display the SLO attainment and Error budget status. A graph about the SLI metric associated with this SLO is also displayed.
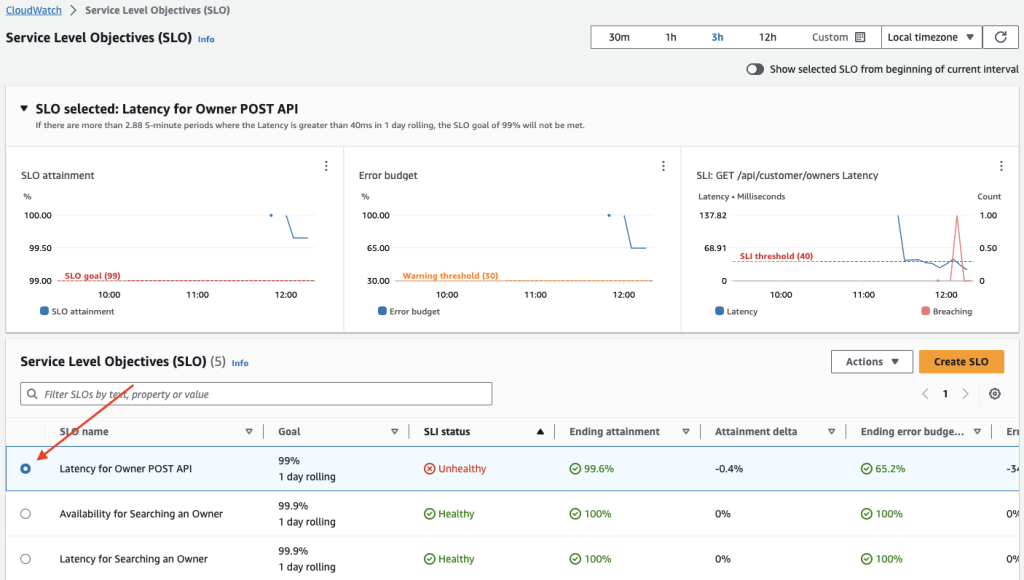
Figure 7: SLO radio button populates SLO graphs
- To further triage an SLO that is not meeting its goal, choose the service name or operation name associated with that SLO. You are taken to the details page where you can triage further. For more information, see View detailed service activity and operational health with the Service detail page.
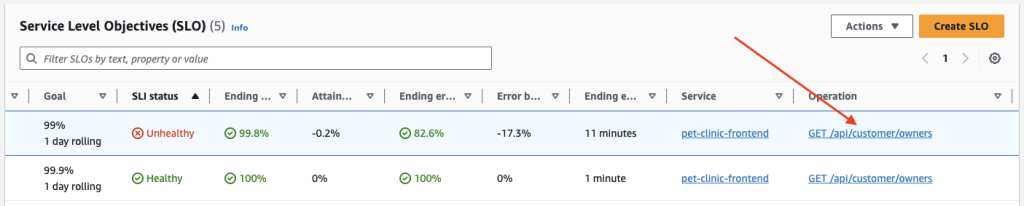
Figure 8: Drill-down into Unhealthy SLO
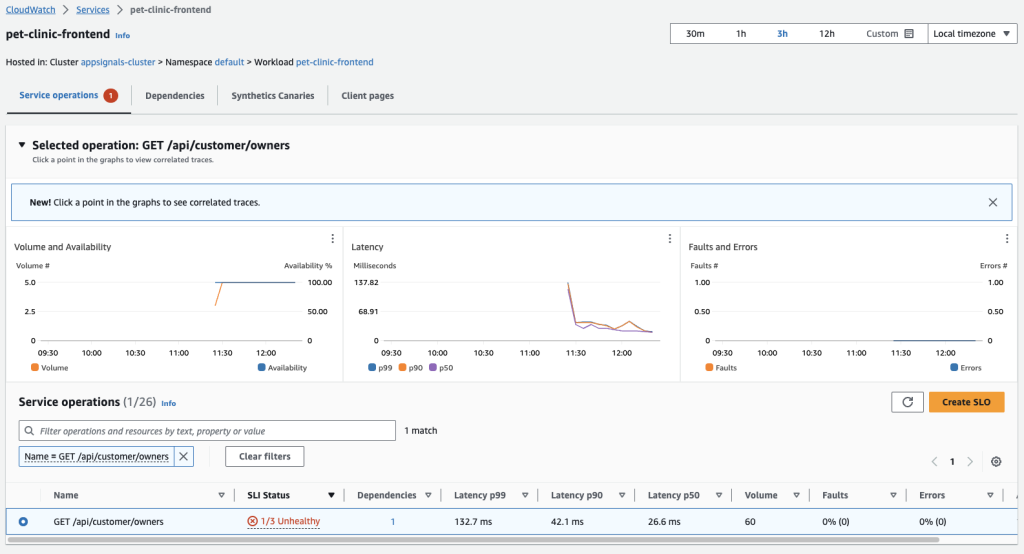
Figure 9: View Service Operation status page to triage
- To change the time range of the charts and tables on the page, choose a new time range near the top of the screen.
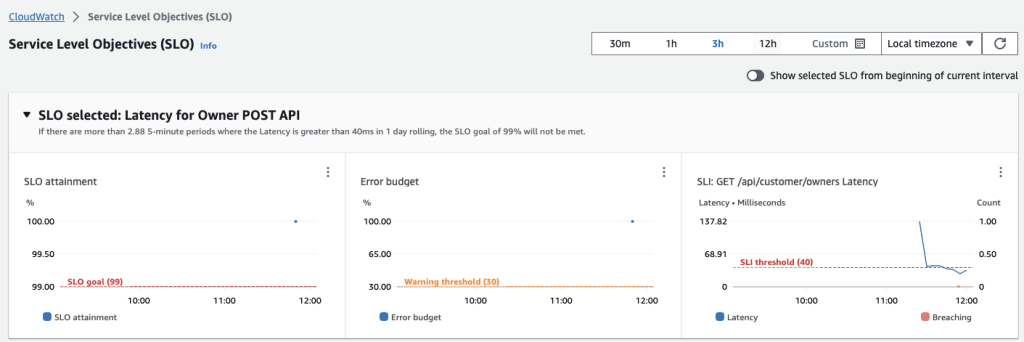
Figure 10: Control time range for graphs
Cleaning up
To avoid incurring future charges, you must delete any SLOs that you created. Note: When you delete an SLO, alarms associated with that SLO are not automatically deleted. You can delete them by following the instructions found on the Editing or deleting a CloudWatch alarm page.
To delete any SLOs created:
- Open the CloudWatch console.
- In the navigation pane, choose Service Level Objectives (SLO) under Application Signals.
- Choose the radio button next to the SLO that you want to delete.
- Choose the Actions dropdown and then select Delete SLO from the dropdown options.
- Choose Confirm.
- Repeat if more than one SLO was created.
Conclusion
Amazon CloudWatch Application Signals is available in Preview today in the US East (N. Virginia), US East (Ohio), Europe (Ireland), Asia Pacific (Tokyo), and Asia Pacific (Sydney) AWS Regions using the AWS Management Console and AWS Command Line Interface (AWS CLI). You can get started using SLOs with any CloudWatch metric but, to get the full experience of CloudWatch Application Signals, your application must be written in Java. Support for applications in other languages is planned for the future. Using CloudWatch Application Signals incurs charges. For information about CloudWatch pricing, see Amazon CloudWatch Pricing.
In this blog post, you learned how you can use CloudWatch Application Signals to easily see the performance of applications on AWS, spot anomalies, and identify the root cause of application performance issues without needing to manually instrument the applications. Then you learned how to get started using SLOs and SLIs using the AWS Management Console. Please refer to the CloudWatch Application Signals documentation to explore more information or check out the CloudWatch Applications Signals use case in the One Observability Workshop for hands-on experience.