AWS Cloud Operations Blog
Improve security by analyzing VPC flow logs with Amazon CloudWatch Contributor Insights
You can use rules in Amazon CloudWatch Contributor Insights to gain security visibility into your VPC flow logs. The rules analyze flow logs in targeted groups in Amazon CloudWatch Logs and display the Top-N contributors for a given log field or combination of log fields. For example, you can produce a list of the Top-N contributors based on data transferred or blocked requests. You can add filters to these rules to count only those log events that meet a certain criteria (for example, blocked requests by source IP when the destination port is 22).
In this post, I’ll show you how to set up CloudWatch Contributor Insight rules for VPC flow logs. I’ll demonstrate how to:
- Map the VPC flow log format to rules in Contributor Insights.
- Explain how a single rule can be used to monitor many VPC flow logs.
- Walk through some sample rules and show them in a CloudWatch dashboard.
Amazon VPC flow logs are used to monitor traffic entering and leaving VPCs, subnets, or network interfaces. They allow us to examine information about a given request, such as the source and destination IP addresses, port, protocol, bytes transferred, and if the request was allowed or blocked.
VPC flow log format
Before you create a rule, you need to understand the log format for VPC flow logs. This way, you can see which fields are available to track contributors and filter on. For more information, see Flow log records in the Amazon VPC User Guide.
Here is an example of the default logging format:
<version> <account-id> <interface-id> <srcaddr> <dstaddr> <srcport> <dstport> <protocol> <packets> <bytes> <start> <end> <action> <log-status>
VPC flow logs support the addition of metadata to log entries, such as VPC ID, instance ID, and TCP flags. You can customize the order of these fields. Rules in CloudWatch Contributor Insights are built by matching the field position in the log event with the name of the field or alias. In the default logging format, the position of the < interface-id > field is 3, but this might not be the case if you are using a customized logging format.
All of the example rules in this blog use the default logging format. For example, if you would like to track the Top-N contributors for the number of bytes transferred by unique source IP addresses, you need to change the positions of the <bytes> and <srcaddr> fields. In the default logging format, <srcaddr> maps to position 4 and <bytes> maps to position 10.

Figure 1: VPC flow log format
Use a Contributor Insights rule to evaluate many VPC flow log groups
A Contributor Insights rule is applied to one or many CloudWatch log groups. You can have a single rule apply to VPC flow logs for an entire AWS account in a selected AWS Region or across an AWS Organization in a selected Region. For information, see the VPC flow log automation using AWS Control Tower lifecycle blog post.
This is valuable because you can use a single rule to track the Top-N contributors across all of your flow logs in a Region. For example, you can track the Top-N contributors by aggregating the number of rejected requests by source IP and destination port. You can add more contributors to show the top rejected requests by source IP, destination port, interface ID, or subnet ID.
If all of your VPC flow logs share a prefix name in CloudWatch Logs, such as /vpc/flowlogs/*, you can create a rule that applies to every CloudWatch log group that shares this prefix name.
Create a custom rule for track top SSH connections by source address and action
Using security-focused rules, you can get a better understanding about which source IPs are generating the largest number of accepted or rejected requests on a given port. This allows security teams to quickly identify and react to a potential security incident.
In this example, I show you how to create a custom rule that counts the number of requests over port 22 by source IP address and action, but you can edit the rule to show denied actions for any port number. You can find the rule syntax in the cloudwatch-contributor-insights-rule-examples GitHub repository.
To create a custom rule:
- Open the CloudWatch console at https://console.aws.amazon.com/cloudwatch/.
- In the navigation pane, choose Contributor Insights.
- Choose Create rule.
- In the Create rule wizard, choose Custom rule.
- For Rule name, enter SSH-by-source-ip-and-action.
- For Log group(s), choose the log groups that you want the rule to monitor. You can choose as many as 20 log groups. To choose all log groups with names that start with a certain string, choose Select by prefix match, and enter the prefix. In this example, I use a log group prefix for VPC flow logs that shares a common prefix in their log group name,
/vpc/flowlogs/*.
Note: If you use Select by prefix match, be aware of how many log groups that match your prefix and will be analyzed by the rule. You incur charges for each log event that matches a rule. If you accidentally search more log groups than you intend, you might incur unexpected charges. For more information, see Amazon CloudWatch Pricing.
- For Log format, choose CLF.
- For Fields, add the following values:
- For position, enter 4.
For alias, entersrcaddr. - For position, enter 7.
For alias, enterdstport. - For position, enter 13.
For alias, enteraction.
- For position, enter 4.
- For Contribution, enter
srcaddrand action. - Under Filter, in Match, enter
dstport. Set Condition to EqualTo, and then enter 22. - For Aggregate on, choose COUNT, and then choose Create.
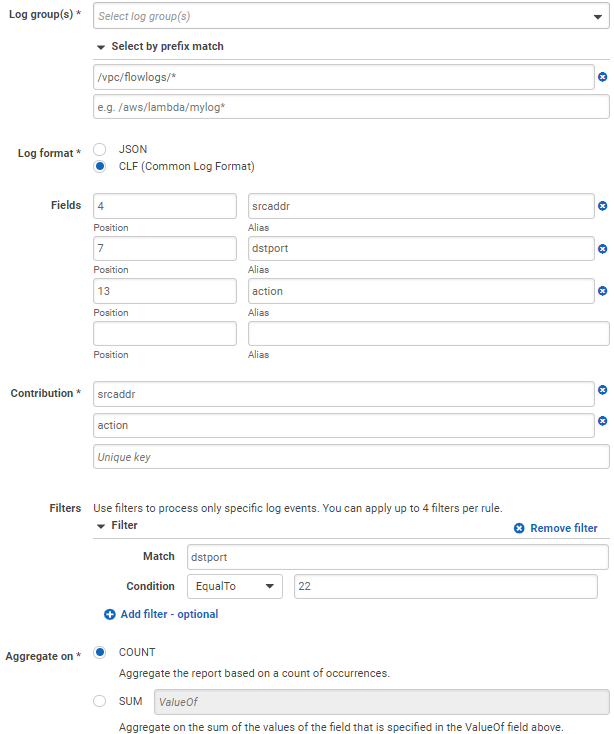
Figure 2: Configured Contributor Insights rule
Rule syntax
{
    "Schema": {
        "Name": "CloudWatchLogRule",
        "Version": 1
    },
    "AggregateOn": "Count",
    "Contribution": {
        "Filters": [
            {
                "Match": "dstport",
                "EqualTo": 22
            }
        ],
        "Keys": [
            "srcaddr",
            "action"
        ]
    },
    "LogFormat": "CLF",
    "LogGroupNames": [
        "/vpc/flowlogs/*"
    ],
    "Fields": {
        "4": "srcaddr",
        "7": "dstport",
        "13": "action"
    }
}
View the rule report
Now you’re ready to view the reports from the SSH-by-source-ip-and-action rule and add them to a CloudWatch dashboard. Depending on the aggregation interval of your VPC flow logs (1 minute or 10 minutes), it might take some time before the results appear on the graph.
To view your rule report and add it to a dashboard:
- Open the CloudWatch console at https://console.aws.amazon.com/cloudwatch/.
- In the navigation pane, choose Contributor Insights.
- In the list of rules, choose SSH-by-source-ip-and-action.
- To change the time range shown in the report, choose 15m, 30m, 1h, 2h, 3h, or custom at the top of the graph.
- To add this graph to a CloudWatch dashboard, choose Add to dashboard.
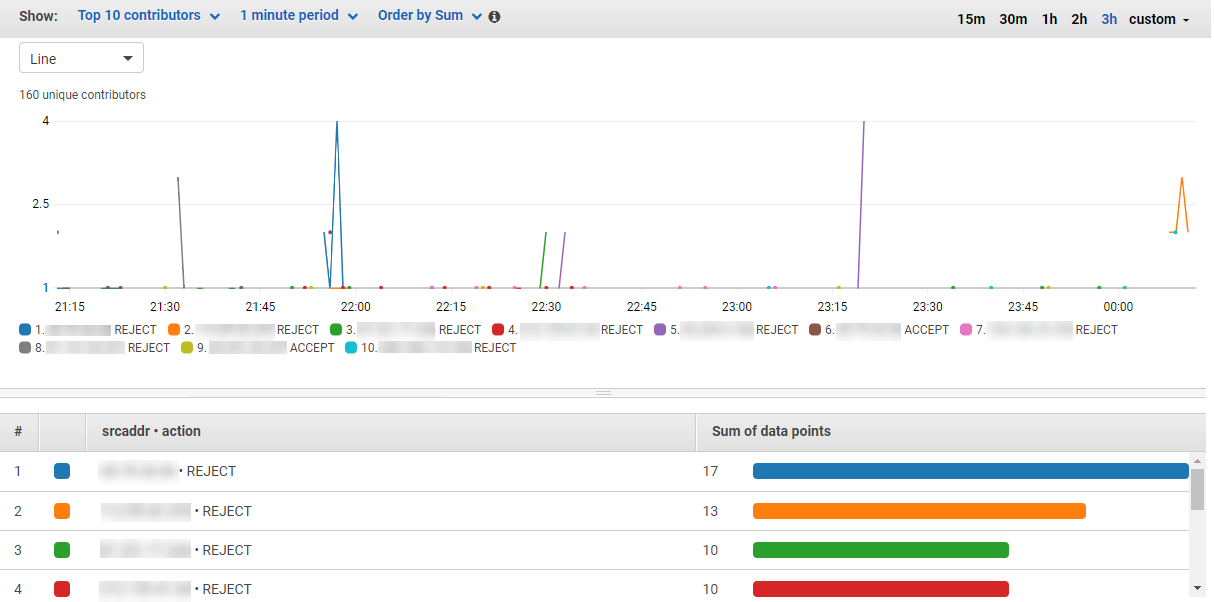
Figure 3: Contributor Insights rule report
Built-in and custom sample rules
The following built-in CloudWatch Contributor Insights rules can be used with VPC flow logs:
- Traffic by Source Address and Rejected Action
- Traffic by Source Address and Action
- Top Sources by Rejected TCP Connections
- Top HTTP Packets by Destination Address
- Bytes Transferred by Source and Destination IP Address
Custom sample rules
In this section, I have provided examples of custom Contributor Insights rules that you can use to analyze your VPC flow logs.
I have added the JSON-formatted rule syntax for each of these samples to the aws-samples in the cloudwatch-contributor-insights-rule-examples GitHub repository.
Rejected requests on port 22 by source and destination
The custom rule that you created to track connection requests over port 22 can be edited to show you only rejected actions or to track the Top-N contributors by source and destination IP addresses. Edit the filters to filter for port 22 and use an action of Reject, and then edit the contributors to source and destination IP addresses.
Accepts vs rejects by VPC or subnet ID
This rule shows you the total number of accepted and rejected connections by VPC or subnet ID. In this example, I added more metadata to my VPC flow logs so that the vpc-id field maps to position 25 in my log format and the subnet-id field maps to position 22.
Rejects by port and source IP
When you analyze VPC flow logs from a security lens, it is helpful to identify which connections, by port and source IP address, are being rejected. This rule provides the Top-N contributors by source IP address and port where the action was rejected.
Top contributors for establishing requests
You can use the TCP flags field to determine which source IP addresses initiated the most TCP connections.
For this rule, you want to track the source IP address and the values of the tcp-flag. In VPC flow logs, the TCP flags can be aggregated in the same line for short connections, so there are a few values you need to track to show connections established by source IP address.
2 – for a SYN
3 – SYN and FIN on the same line
19 – SYN, SYN-ACK, and FIN on the same line
You can edit this rule in a few ways to show a different dimension of the data. For example, you can add destination address or destination port as a contributor. This way, you can tell who is making the most requests to source IP addresses and ports.
Bytes transferred by VPC
The following rule syntax provides the Top-N VPCs that generate the most traffic in terms of bytes transferred for all VPC flow logs whose log group name starts with /vpc/flowlogs/*. In this example, I have added more metadata to my VPC flow logs so that the vpc-id field maps to position 25 in my log format and the subnet-id field maps to position 22.
Requests by TCP flag
TCP flags are one of the metadata fields you can add to VPC flow logs. In the following example, I have the tcp-flag field mapped to position 23 in my log format. This shows you the number of requests by TCP flag.
Estimate costs
To estimate the cost of running a CloudWatch Insights rule, you need to know the number of log events that take place in a given log group over a period of time. You can use the IncomingLogEvents CloudWatch metric to calculate the cost to evaluate all events for a given log group or log groups. If you use filters in a rule, it’s possible not all of the log events will be matched.
To create a metric match expression that helps you identify how much a rule would cost if all log events in the group are matched:
- Open the CloudWatch console at https://console.aws.amazon.com/cloudwatch/.
- In the navigation pane, choose Metrics.
- On the Graphed Metrics tab, from the Math Expression dropdown menu, choose Start with Empty Math Expression.
- In Details, enter the following search expression. This search expression provides the IncomingLogEvents metric for any log group that contains
/vpc/flowlogs/in the log group name.
SEARCH(' {AWS/Logs, LogGroupName} LogGroupName =/vpc/flowlogs/ MetricName=IncomingLogEvents', 'Sum', 86400)
- Create a second math expression, and enter the following to sum up all VPC flow log group events into a single metric:
SUM(e1)
- Create a third math expression, and enter the following expression to calculate the daily cost for matched events in a log group:
(SUM(e1)/1000000)*0.02
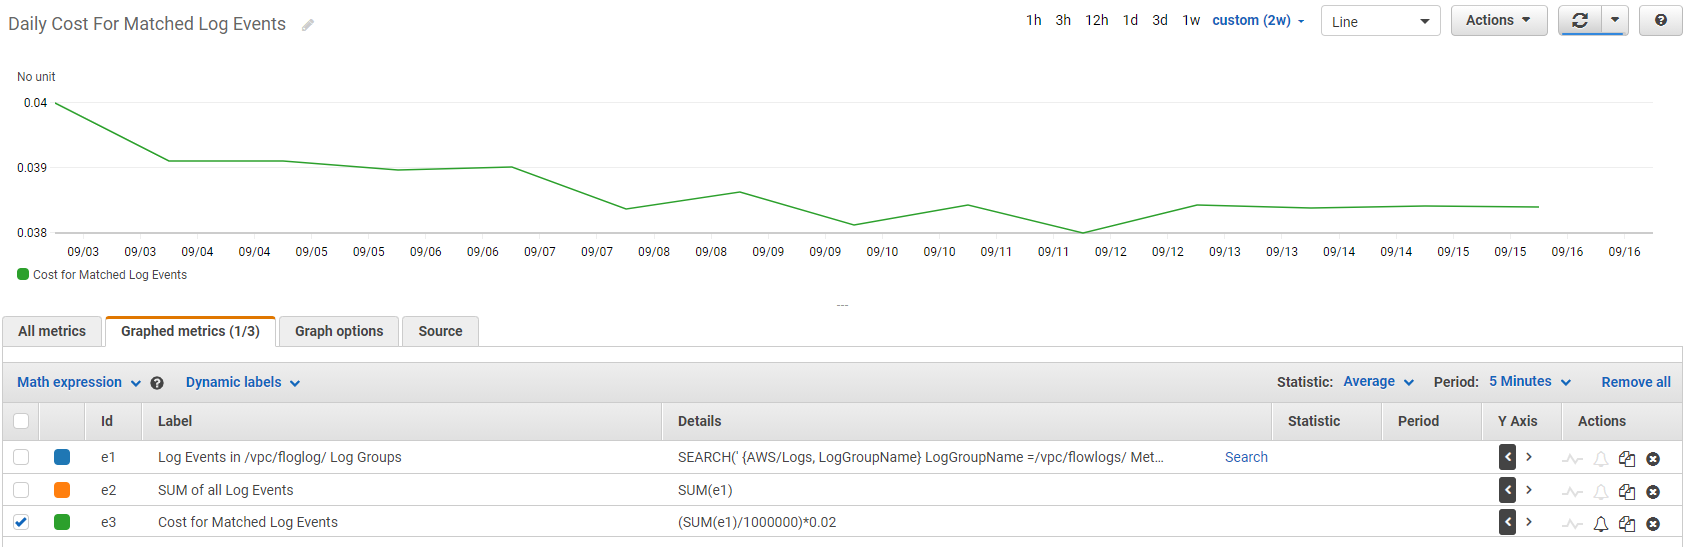
Figure 4: Metric math expression displays the approximate cost for a Contributor Insights rule
Use rule metrics to track accepted vs. rejected traffic
You can use the INSIGHT_RULE_METRIC metric match expression to display metrics from the Contributor Insights rule. You can use this expression to track accepted and rejected traffic across VPCs by applying the following built-in rules:
- Traffic by Source Address and Rejected Action
- Traffic by Source Address and Action
To use this rule expression:
- Open the CloudWatch console at https://console.aws.amazon.com/cloudwatch/.
- In the navigation pane, choose Metrics.
- On the Source tab, paste the following JSON. Replace the rule names of Traffic-by-Source Address-and-Rejected-Action and Traffic-by-Source-Address-and-Action with the names you defined when you created the rule.
The result should look like Figure 5:
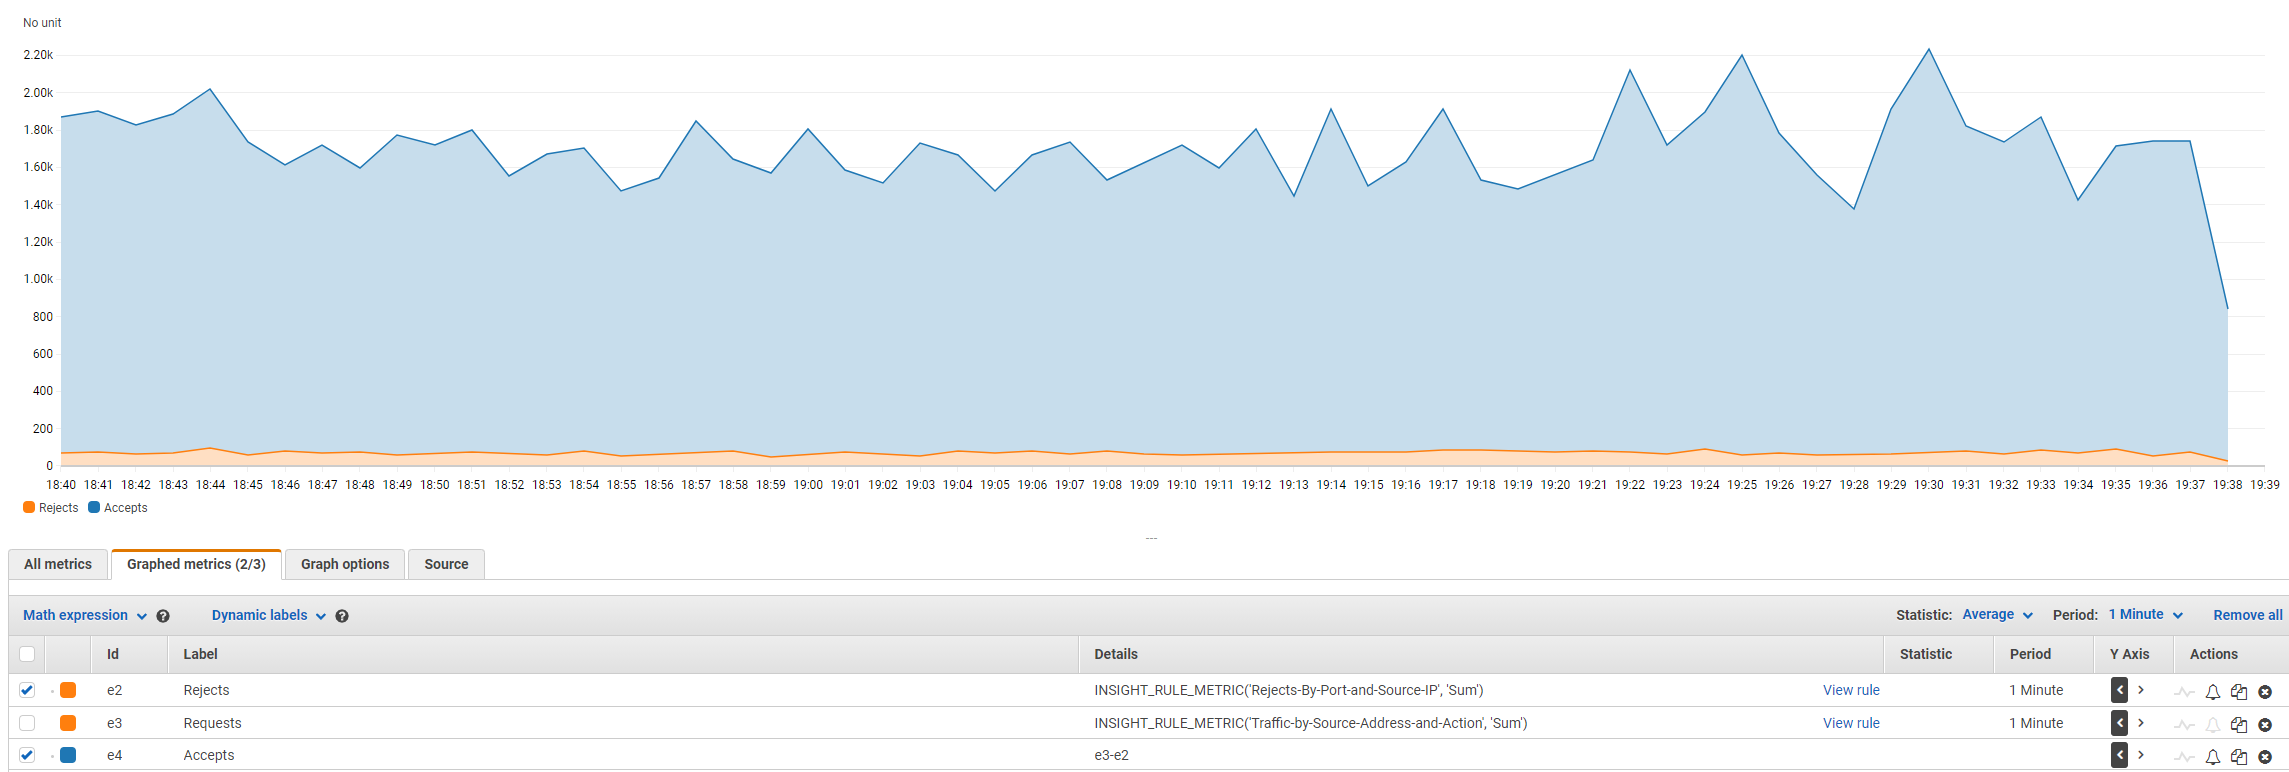
Figure 5: Metric math expression shows accepted and rejected VPC connections
Sample dashboard
Here is a sample of a CloudWatch dashboard that displays the report view of a selection of the security-focused CloudWatch Contributor Insights rules covered in this post. Report views can be a valuable addition to a new or existing operational or security dashboard. The CloudWatch dashboard views are powerful because you can scope these rules to a workload or track contributors for all VPC flow logs across an organization.
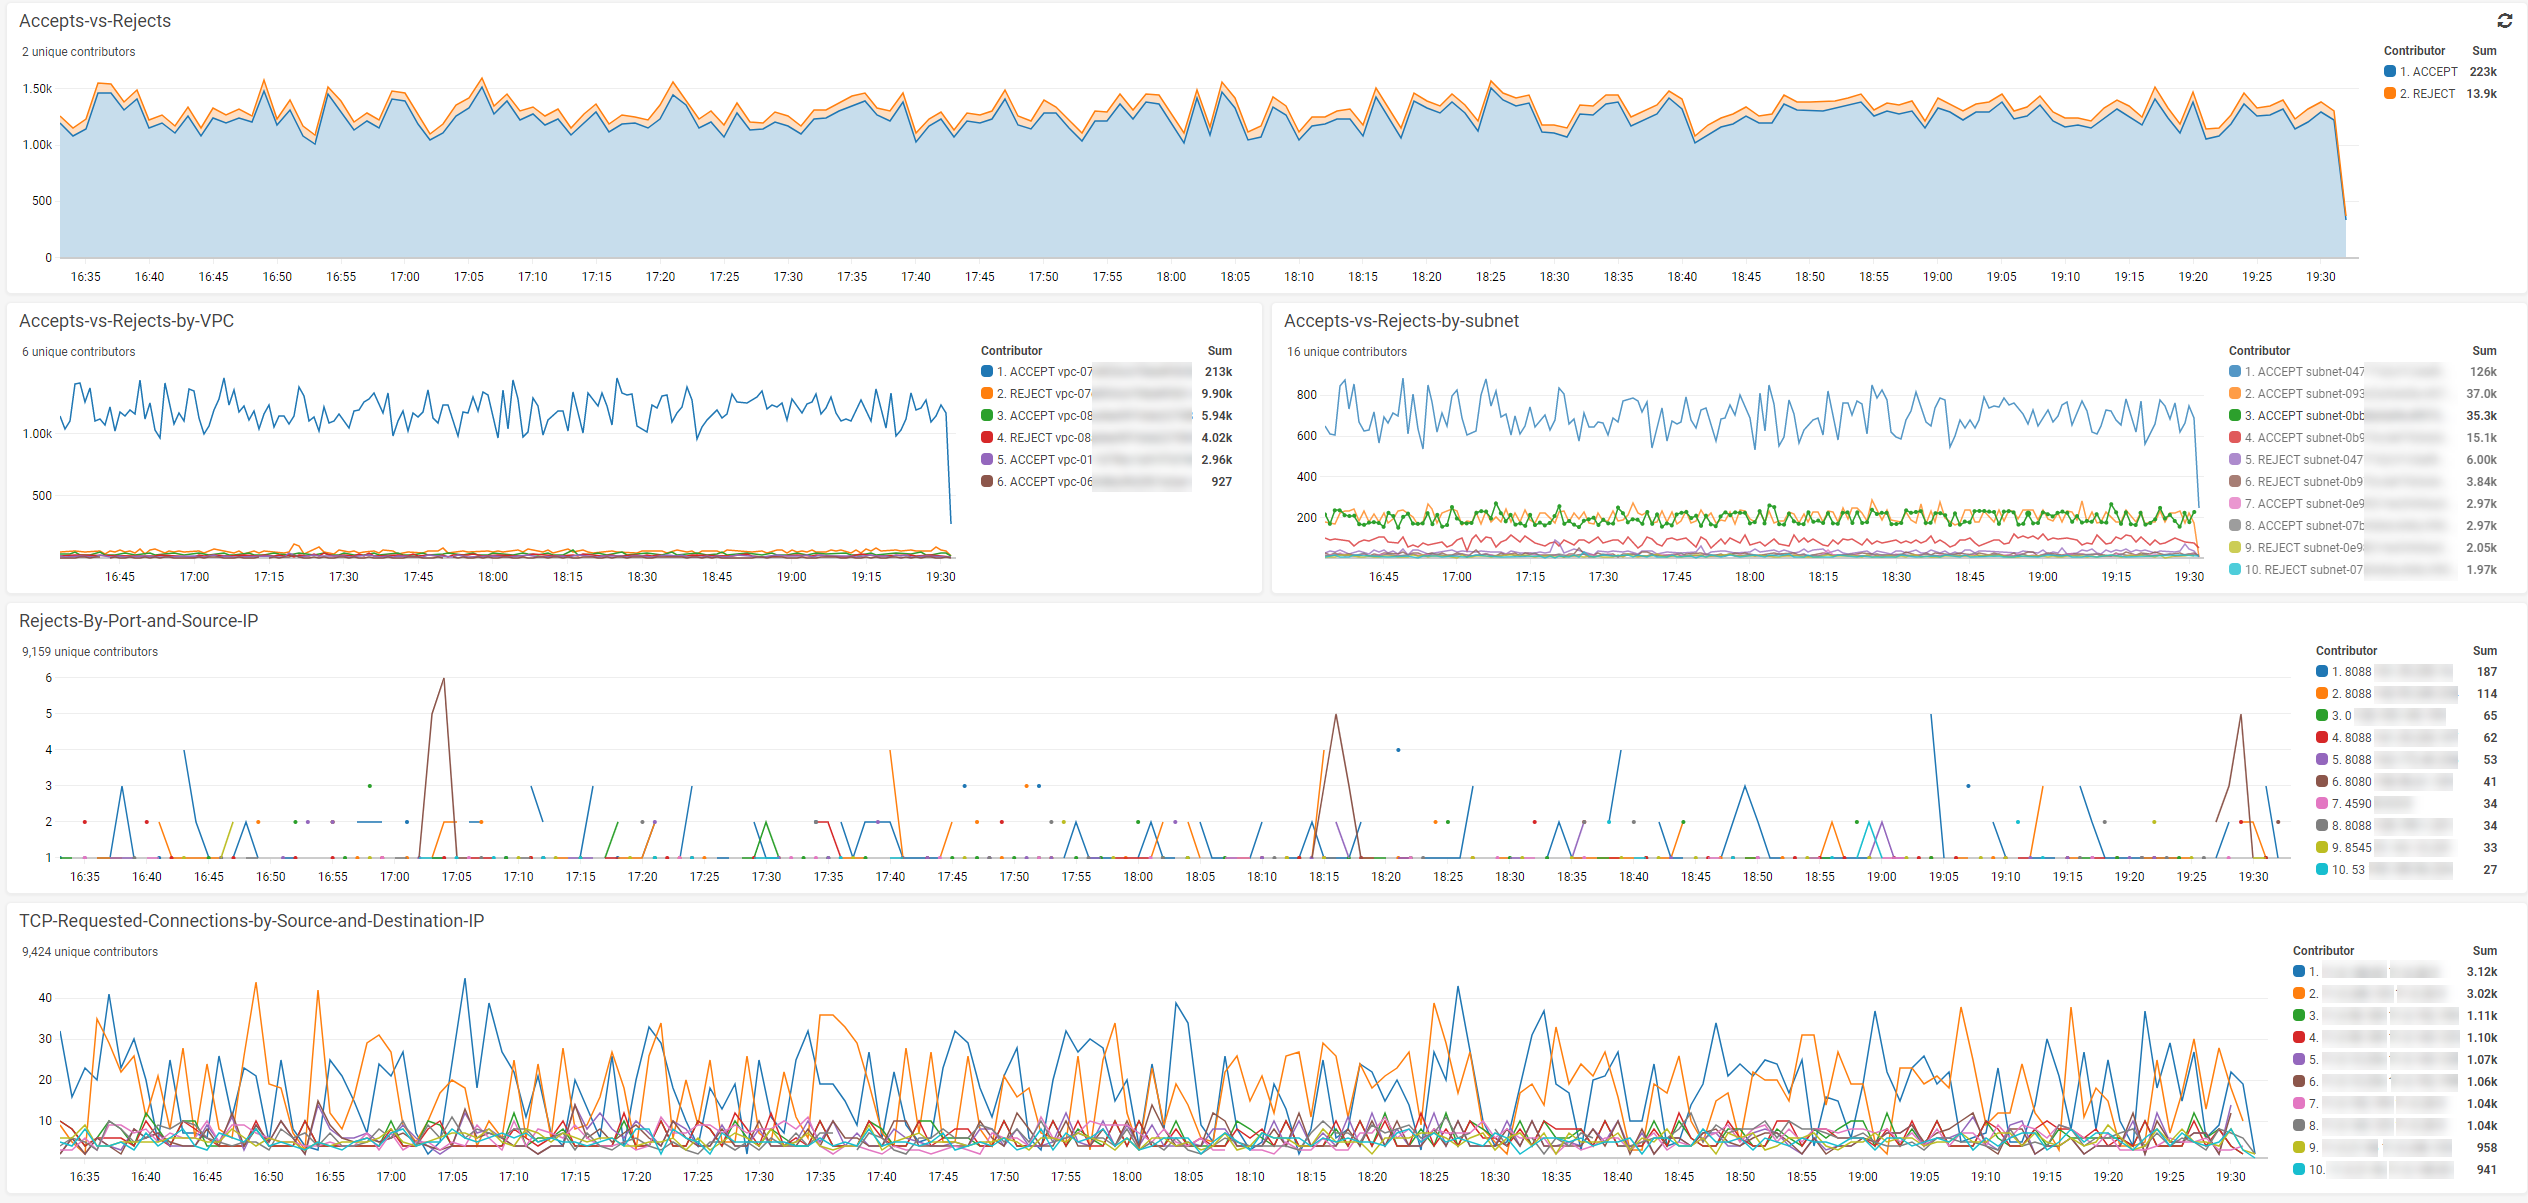
Figure 6: CloudWatch dashboard displays Contributor Insights rule reports
Cleaning up
Charges for Amazon CloudWatch Contributor Insights are based on the number of rules and the number of events that match a given rule. A higher volume of VPC flow log data will result in higher charges. Disabling a rule will prevent service charges due to matched events, while deleting a rule will prevent both service charges from matched events, and for the existence of a rule. For more information, see the CloudWatch Pricing page.
Conclusion
In this post, I showed how you can improve our security posture by using CloudWatch Contributor Insights with VPC flow logs. I showed you how to create rules in CloudWatch Contributor Insights. I showed how these rules can apply to many log groups or a select number of log groups, which makes it possible to scope rules to a single Elastic Network Interface or to all VPCs in a Region. To start analyzing your VPC flow logs and building custom rules and dashboards, go to CloudWatch Contributor Insights.
About the Author
![]()
Bobby Hallahan is a Sr. Specialist Solutions Architect on the AWS Observability team. He is passionate about helping customers find innovative solutions to difficult problems. He works with AWS customers to help them meet their observability goals. During his tenure at AWS, Bobby has supported enterprise customers with their mission-critical workloads.