AWS Cloud Operations Blog
Introducing Amazon CloudWatch Alarm Recommendations
Amazon CloudWatch is a foundational AWS service that provides you with actionable insights into your cloud resources and applications. With Amazon CloudWatch Metrics, you can gain better visibility into your infrastructure and large-scale application performance. You can set up alarms using Amazon CloudWatch Alarms for metrics emitted by AWS services or your applications. Identifying which metrics are crucial for your application and setting up alerts to monitor them can be challenging. This could lead to missing or mis-configured foundational monitoring, which introduces operational risk and increases mean time to incident discovery and resolution. In this blog we will show how Amazon CloudWatch Alarm recommendations can help you create and manage a cohesive set of curated, best practice alarms for your AWS resources with all the benefits of infrastructure-as-code and console experience.
Key concepts
What are Amazon CloudWatch Metrics?
Amazon CloudWatch Metrics are fundamental to monitoring AWS resources. These metrics are time-ordered data points that represent various aspects of your AWS resources’ operational health. Metrics can be generated from AWS services, your custom applications, or even on-premises resources integrated with CloudWatch. Find more details on Amazon CloudWatch Metrics documentation.
What are Amazon CloudWatch Alarms?
Amazon CloudWatch Alarms are a mechanism for monitoring and responding to changes in your environment based on the associated metric data. Alarms can be configured to invoke actions, such as sending notifications or auto-scaling resources, when specified thresholds or conditions are met. Find more details on Amazon CloudWatch Alarms documentation.
The Challenge: Effectively monitoring AWS resources
AWS provides a number of out-of-the-box, vended metrics that show the health of your AWS resources. It can be challenging understanding the different metrics and knowing which metrics are important to monitor. Monitoring too many metrics can lead to noise and make it harder to identify real issues in your systems.
Another challenge when creating an alarm is determining the appropriate configuration values such as statistics, time period and threshold. For instance, to measure the latency of your APIs, you should look at the Percentile statistics instead of Average for API Gateway’s Latency metrics, as it allows you to understand the latency distribution. For example, for a Lambda function’s ConcurrentExecutions metrics, look at the Count statistics to check if it is getting close to the account and regional limits to avoid any throttling issues.
Amazon CloudWatch Alarm recommendations
Amazon CloudWatch maintains a comprehensive set of best practice alarms to monitor CloudWatch metrics for supported AWS services. CloudWatch Alarm recommendations are a curated set of recommendations, which are created based on monitoring best practices learned from years of operational experience at Amazon. They allow you to quickly identify key infrastructure metrics to monitor and get alarm configuration recommendations. You can view and take action on the recommendations in CloudWatch Dashboards, Metrics and Alarm pages as well as other AWS service consoles. You can find here a complete list of the alarms that CloudWatch recommends for supported AWS services.
Alarm recommendations include the Metric Name, summary of the alarm such as Intent and Threshold Justification as well as configuration attributes. The recommendations help you to easily set up the wide variety of alarm attributes with suggested values for Statistic, Period, Comparison Operator, Treat Missing Data, Evaluation periods, and Datapoints to alarm. You can either accept the defaults or adjust accordingly.
In some cases we provide a recommended value for the alarm Threshold. In other cases the value is intentionally left empty as the threshold is highly specific to your particular use case and instead you will get metric specific hints to help you decide. So, while we provide recommendations, you must review and configure the alarm values as appropriate for your specific needs. Additionally, you can provide alarm actions by specifying a notification channel and expected actions in the alarm metadata. Today, we don’t recommend any actions by default.
You can view and apply the recommendations from the AWS console using the CloudWatch Alarm wizard, or via infrastructure-as-code (IaC) deployment.
Along with Alarm recommendations, every vended metric from each supported AWS Service now has an information icon (represented by ‘i’) next to the metric name in AWS console to easily understand details on what insights that metric captures without the need to browse through AWS documentation.
Getting started with CloudWatch Alarm recommendations
Amazon CloudWatch has introduced two new columns in the metrics page. You can view all your existing alarms related to the metrics in the Alarms column and see the recommended alarms for these metrics under the Alarm recommendations column. With these two new columns side-by-side, you can quickly identify if you have any missing recommended alarms. Furthermore, where you already have existing alarms, you can easily compare your alarm configuration with those of the recommendations.
To get started with CloudWatch Alarm Recommendations, follow these steps:
Access Alarm recommendations
- Log in to your AWS Management Console and navigate to CloudWatch metrics page.
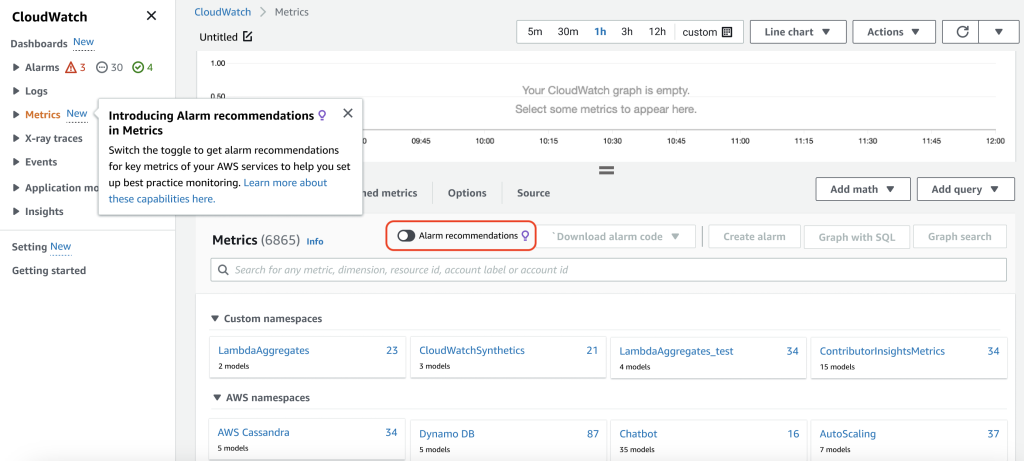
Figure 1: CloudWatch metric console with Alarm recommendations
- To see only metrics with recommended alarms, toggle the Alarm recommendations button as shown below. CloudWatch will then show only namespaces that have metrics with recommended alarms, identified with a purple lightbulb icon.
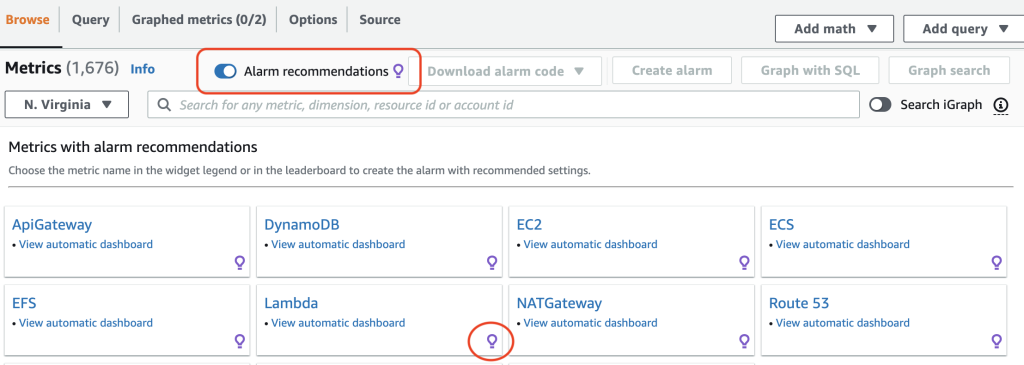
Figure 2: Alarm recommendations toggle button with namespaces
- Choose the relevant AWS namespace and select the metric dimension you are interested in. Note that when the Alarm recommendations toggle is ON you will only see metrics for which you have recommendations (in the Alarm recommendations column). For example, if you want to monitor a Lambda function, when you select the Lambda service namespace and choose to view the metrics by function name, you will see alarm recommendations for ConcurrentExecutions, Errors, Throttles and Duration metrics.
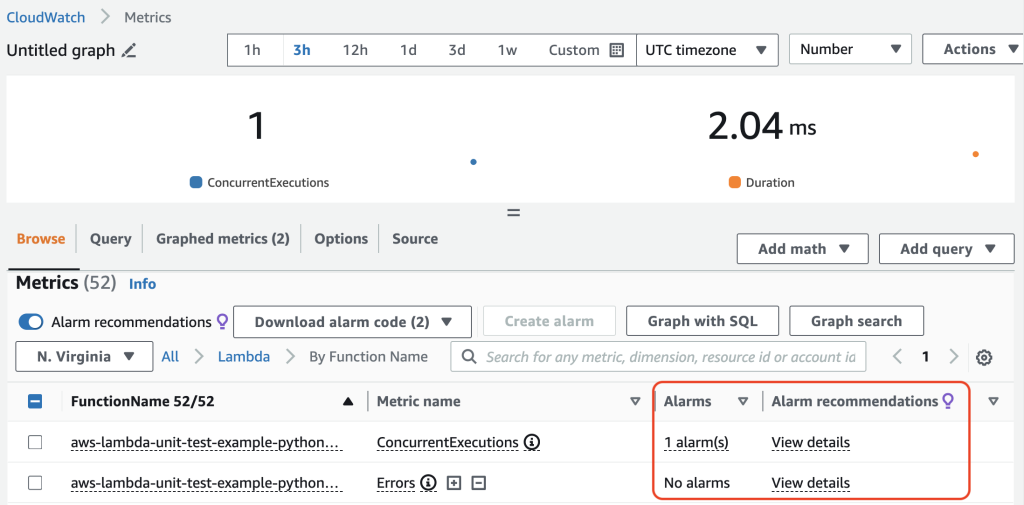
Figure 3: Two new columns, Alarms and Alarm recommendations
- Select View Details under Alarm recommendations to see details of the alarm recommendations such as the intent of the alarm, recommended statistic and the threshold justification.
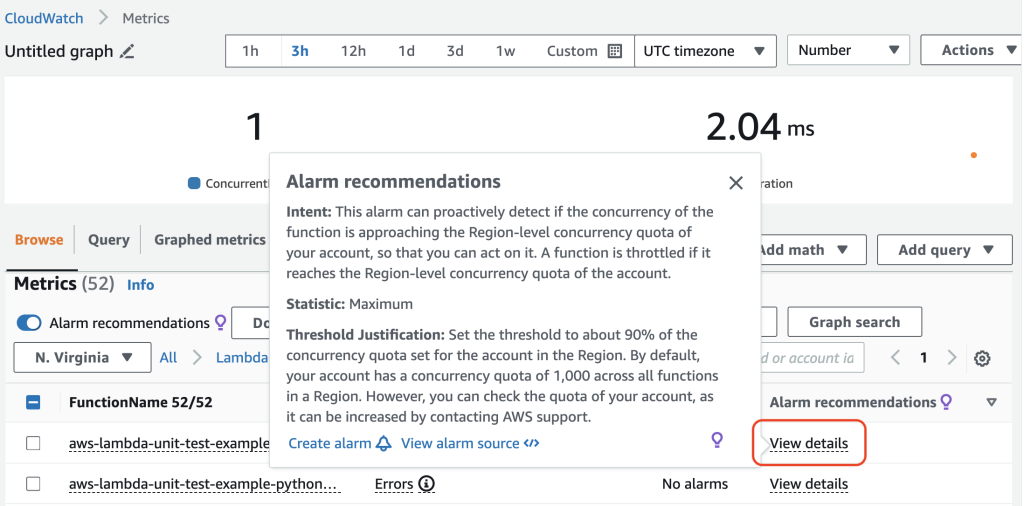
Figure 4: View Details to see Alarm recommendations
Review and Create Alarms
From the View Details pop-up window, you can create an alarm either using the CloudWatch Alarm wizard or by downloading the alarm configuration as a AWS CloudFormation / Terraform infrastructure-as-code (IaC) template.
- To create an alarm using CloudWatch Alarm wizard, choose Create alarm on the details page to open the CloudWatch Alarm wizard. Note that the alarm wizard will pre-fill the fields with the recommended configuration which you can adjust if needed. For example, you can increase/decrease sensitivity via the datapointsToAlarm attribute. Finally, add additional information such as notification channel and threshold and create the alarm.
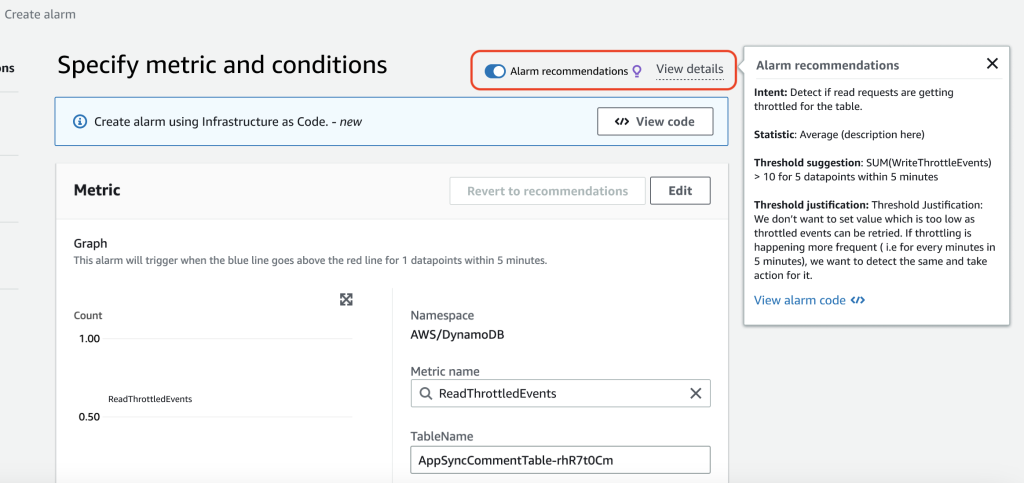
Figure 5: CloudWatch Alarm configuration wizard
- To create an alarm using infrastructure-as-code template, choose View alarm code to copy or download the alarm’s code template of your choice. At time of writing, CloudFormation templates (both JSON and YAML format), AWS CLI, and Terraform template are supported. Review and update the relevant values as per your needs and integrate it with your deployment tools and pipeline.
- If you want to create alarms for multiple metrics at the same time, you can bulk-download these IaC templates, as shown below. To do that, select one or more metrics, choose the Download alarm code button, select the template of your choice and download it. You can then integrate the alarm provisioning with your deployment pipelines.
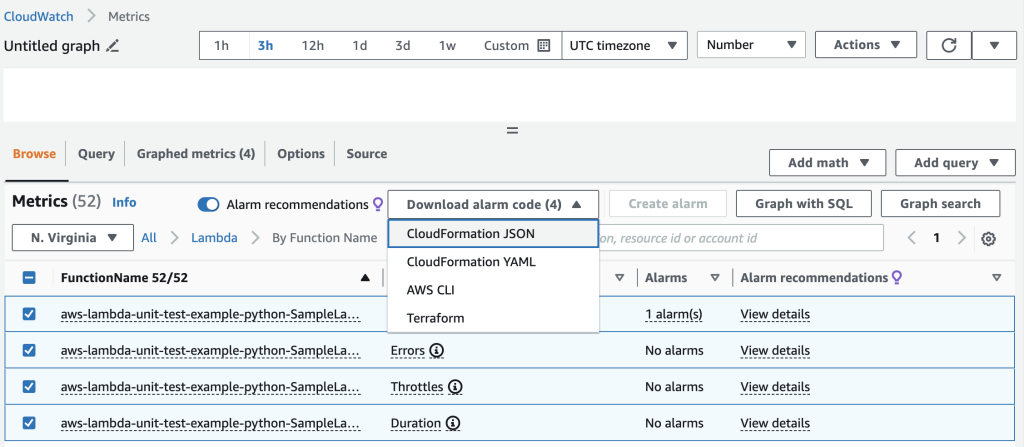
Figure 6: Dropdown option to download IaC template with Alarm recommendations
The alarm IaC provisioning template will include most of the code you need. However, in cases where we don’t provide a specific threshold value, you will see a threshold = REPLACE_ME. Replace the string with the threshold value based on your specific needs. Additionally, you can set the notification channel for each alarm by updating the value for AlarmActions and OKActions.
Note that while CloudWatch Alarm recommendations are valuable, every application is unique. You can customize your alarms to align with your specific requirements.
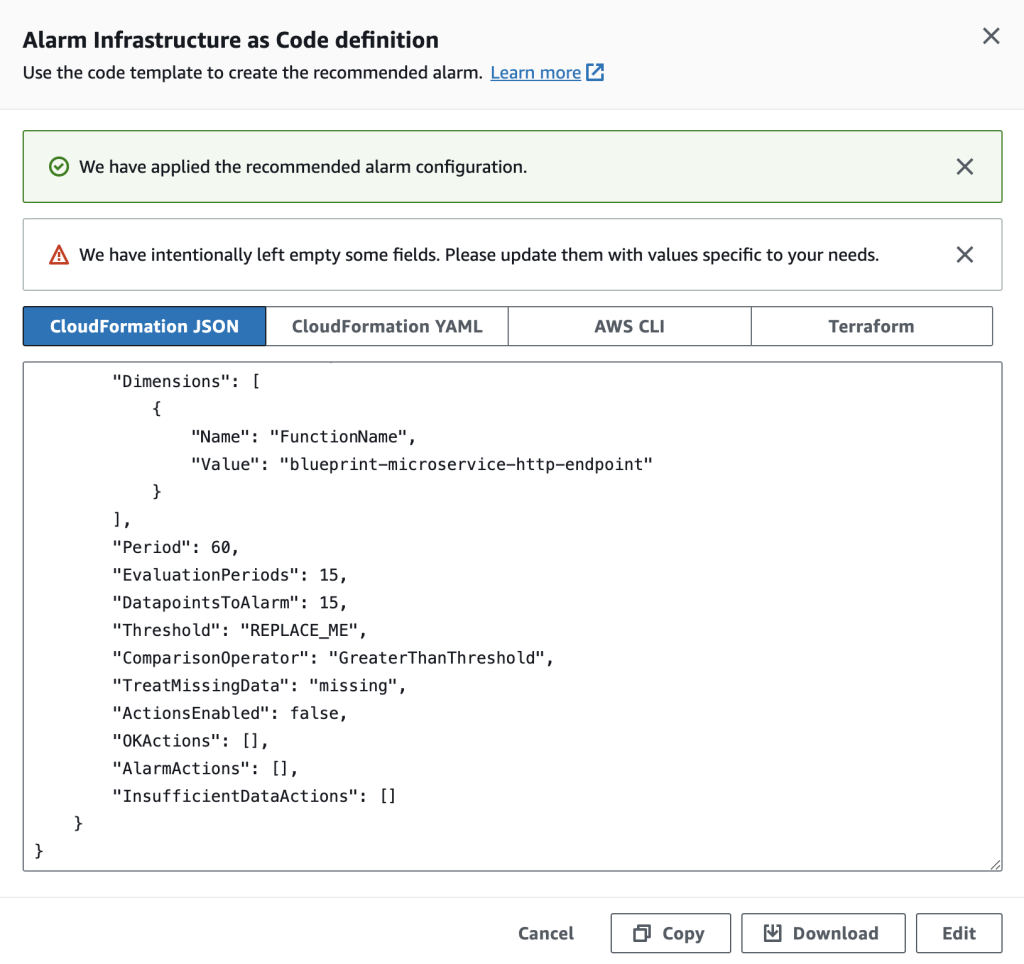
Figure 7: View, copy and download option for IaC template
Exploring metrics with ease
When you create an alarm for a metric, it is important to understand what data the metric captures. Having a metric description always available at hand makes it easier to understand the meaning of the metric when you’re troubleshooting or assessing system health. You can now easily view the description for metrics of supported AWS services in the CloudWatch console rather than having to check documentation. You will see an ‘i’ icon next to each supported metric name. You can now get the metric information such as Description, Meaningful Statistics, and Units info across the AWS Console.
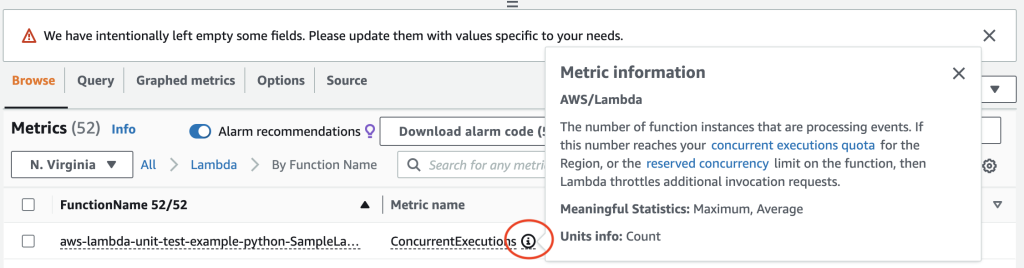
Figure 8: Metric information icon next to metric name
The ‘i’ icon and the metric information is available across the AWS console including embedded monitoring dashboards within the respective service page. For example, you can see the metric information under monitoring tab within AWS Lambda service page as below:
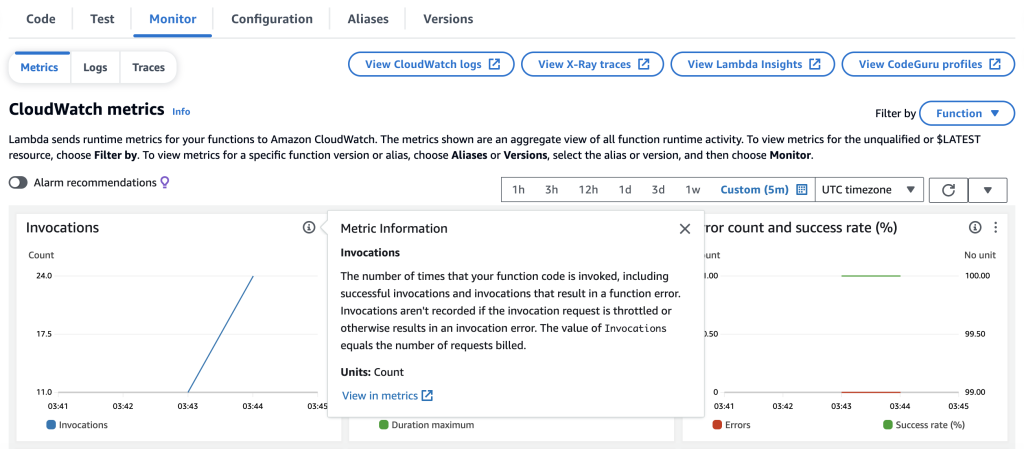
Figure 9: Embedded monitoring dashboard on Lambda service page
Conclusion
Amazon CloudWatch Alarm recommendations enable you to monitor your AWS resources following industry best practices. This simplifies the task of identifying the appropriate metrics and setting up CloudWatch alarms, so that you can focus on building your apps. You can view and apply these alarm recommendations through the AWS console, AWS CLI, or using IaC templates, thus making it easier to maintain effective monitoring. It not only saves time and development effort, but also helps you enhance the reliability and efficiency of your AWS infrastructure. By focusing on the most relevant metrics, you can optimize resource allocation and ensure that you’re only paying for what you need. Find more details on CloudWatch Alarms Best Practice documentation.