AWS Cloud Operations Blog
Lowering MTTR with Amazon CloudWatch and AWS X-Ray
Customers running microservice-based workloads in a serverless environment frequently have issues with troubleshooting incidents as the data they need can be distributed across hundreds or thousands of components. In this blog post, I will demonstrate how you can reduce the mean time to resolution (MTTR, or the average time it takes to repair or mitigate the impact of a failure) for your serverless workloads using Amazon CloudWatch ServiceLens and AWS X-Ray. A successful monitoring strategy relies on all three pillars of observability (metrics, logs, and traces) and can surface insights from all of them in a single view.
Understanding your dependencies
CloudWatch ServiceLens helps you visualize your distributed environment and understand the dependencies between services. It brings metrics, logs, and traces together into a service map so that you can focus on the integrations between components and pinpoint issues as they occur. Your resources and instrumented applications appear as nodes on a directed graph, with the edges between nodes representing the transactions that occur between them. Nodes experiencing issues will have a colored outline according to the type of error and can help highlight points in your architecture that are experiencing faults or are currently in an alarm state.
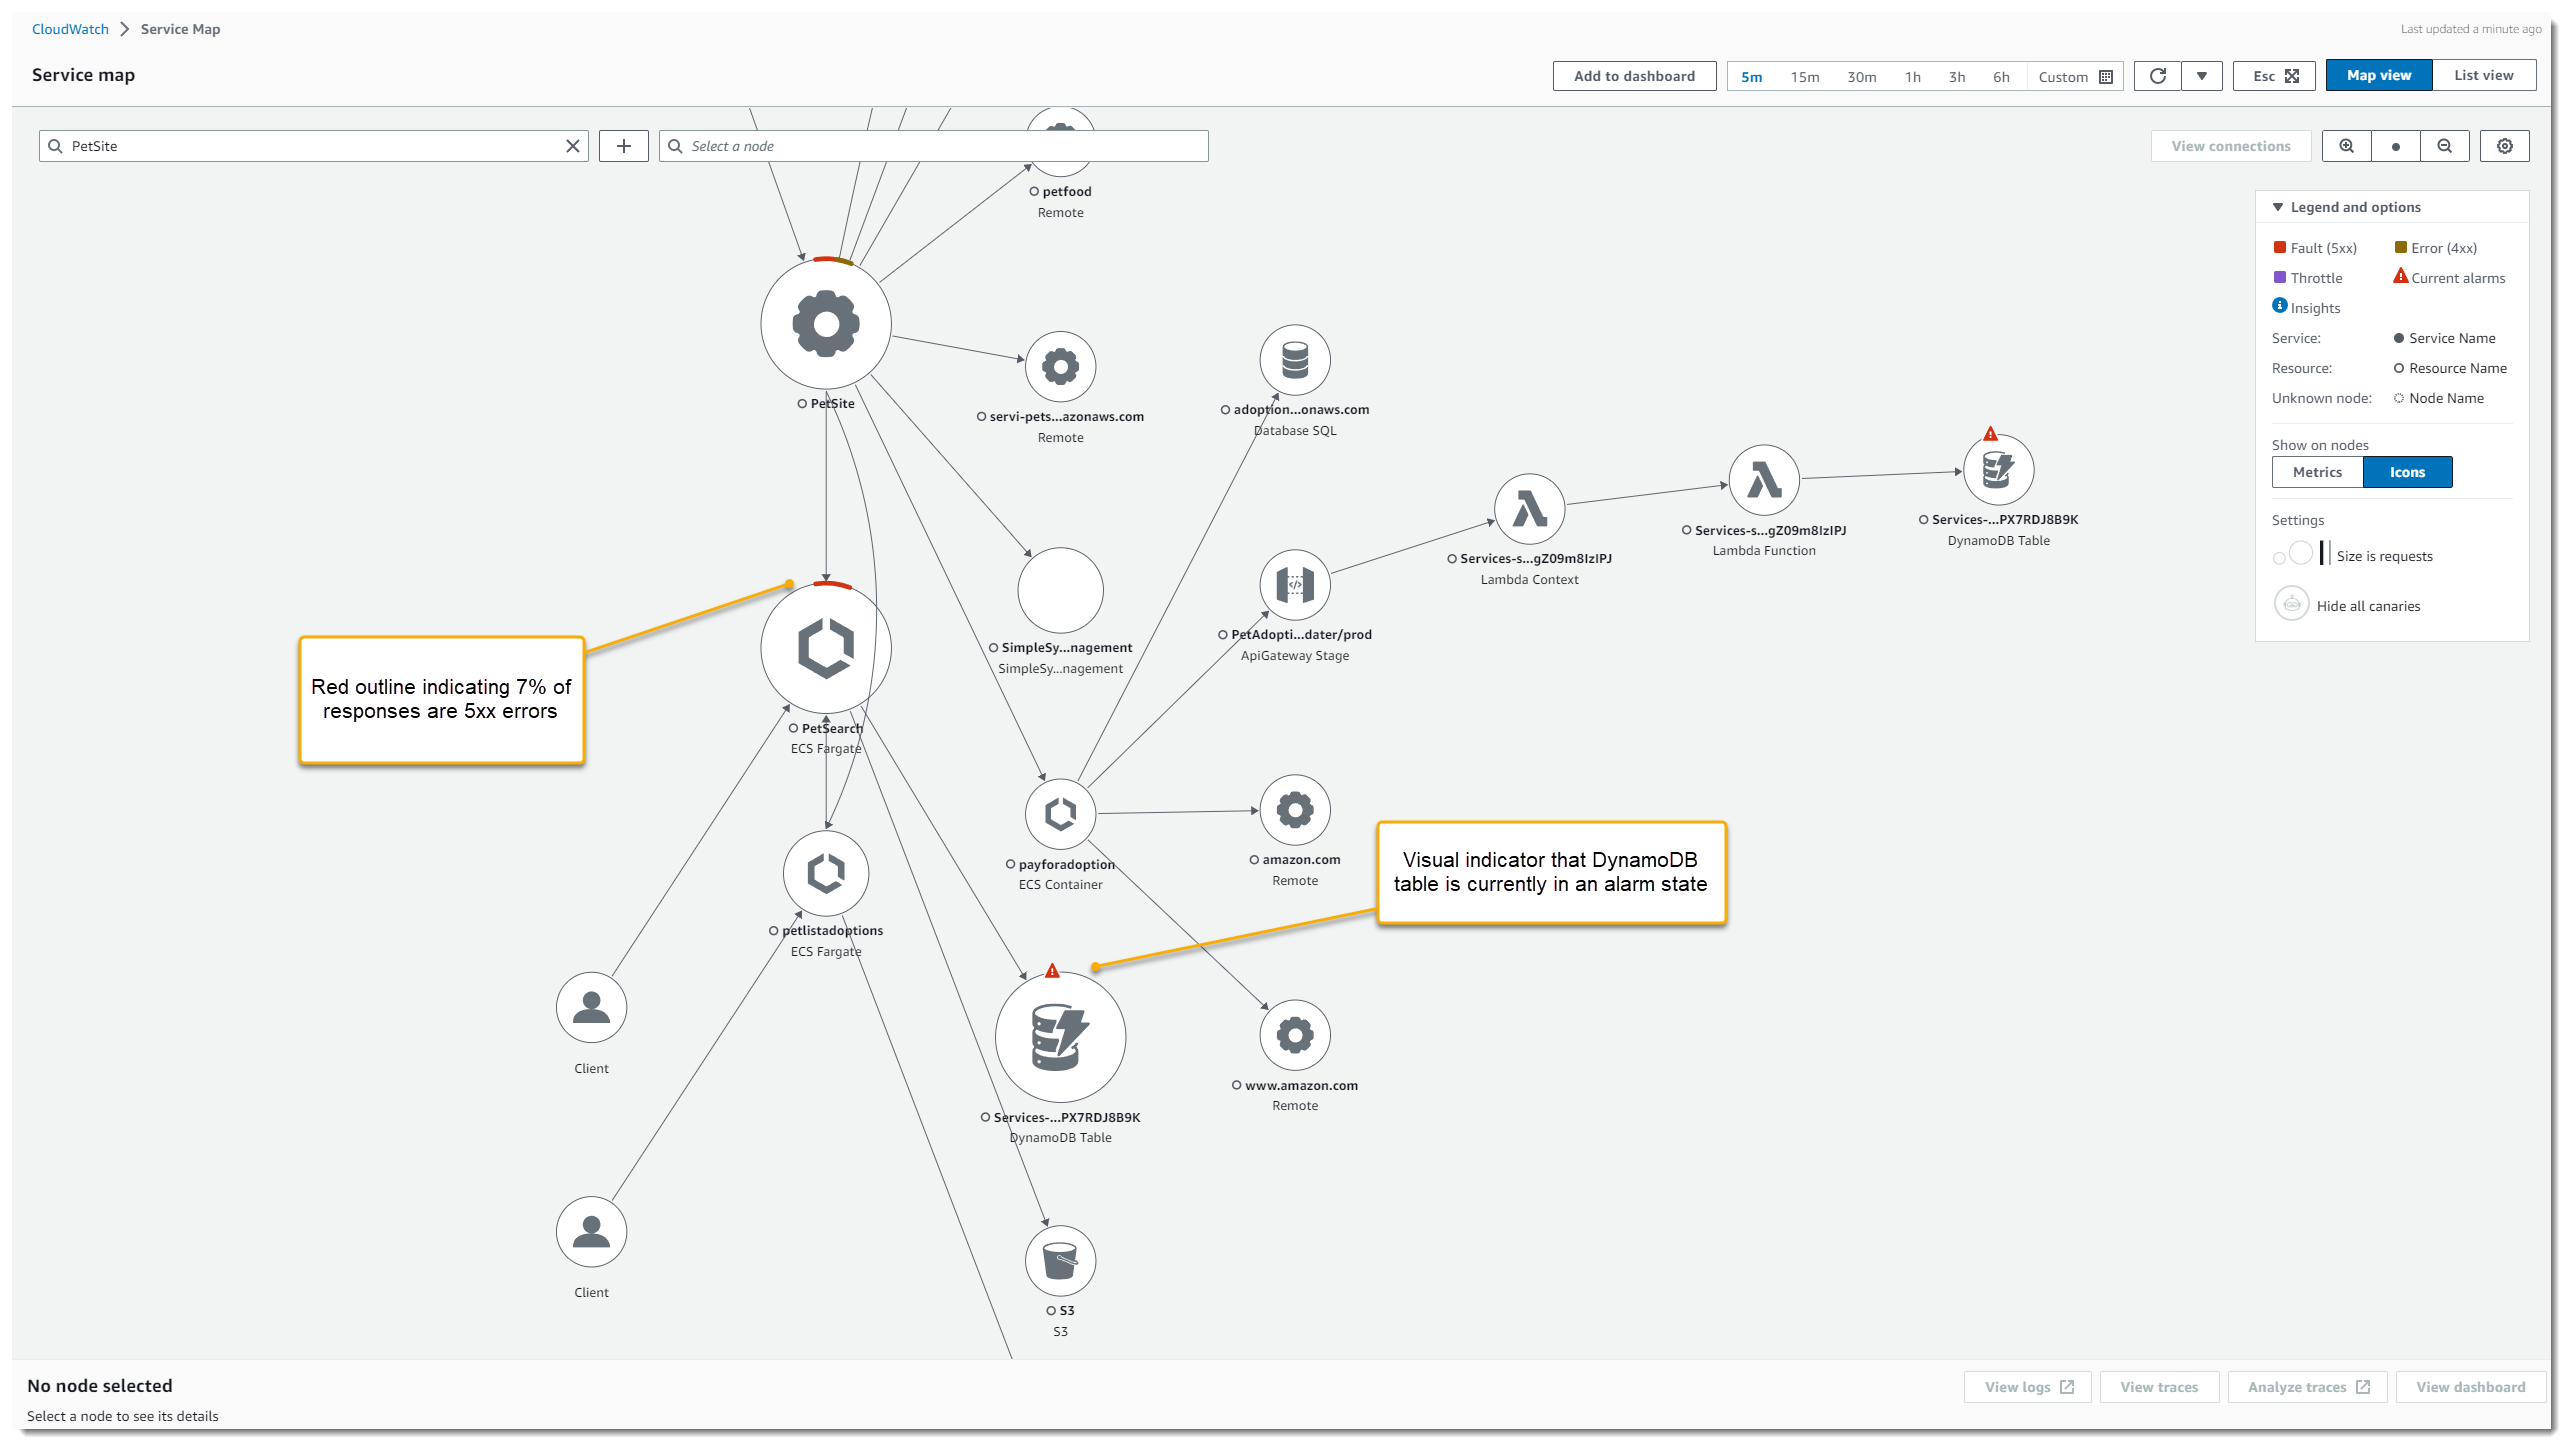
Figure 1: CloudWatch ServiceLens Map
By default, the size of each node and the edges between them represent the number of requests they are receiving. This can be changed by selecting the gear icon to load the Preferences dialog box and choosing an alternate metric to base sizing on such as Latency. Selecting a node will open a panel with additional metrics showing you latency, requests, and faults over time as well as providing links to your logs, traces, and a more detailed dashboard.
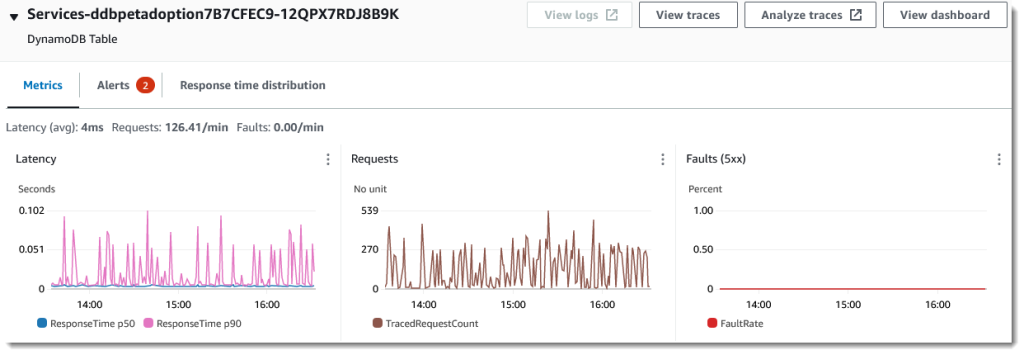
Figure 2: DynamoDB table metrics
This panel will also surface any alerts associated with the resource. In the preceding image, you can see that two alerts for a DynamoDB table are currently in alarm.
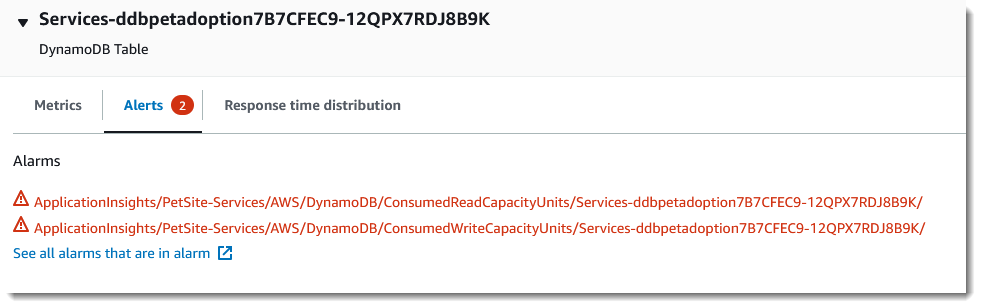
Figure 3: DynamoDB table alerts
Returning to the service map, let’s look at one of the nodes experiencing faults and select View connections to focus on all of the incoming and outgoing requests for that specific resource. Alternatively, you can use X-Ray groups to focus on a subset of nodes in your service graph. For a further deep dive, checkout a previous blog post on groups and their use cases.
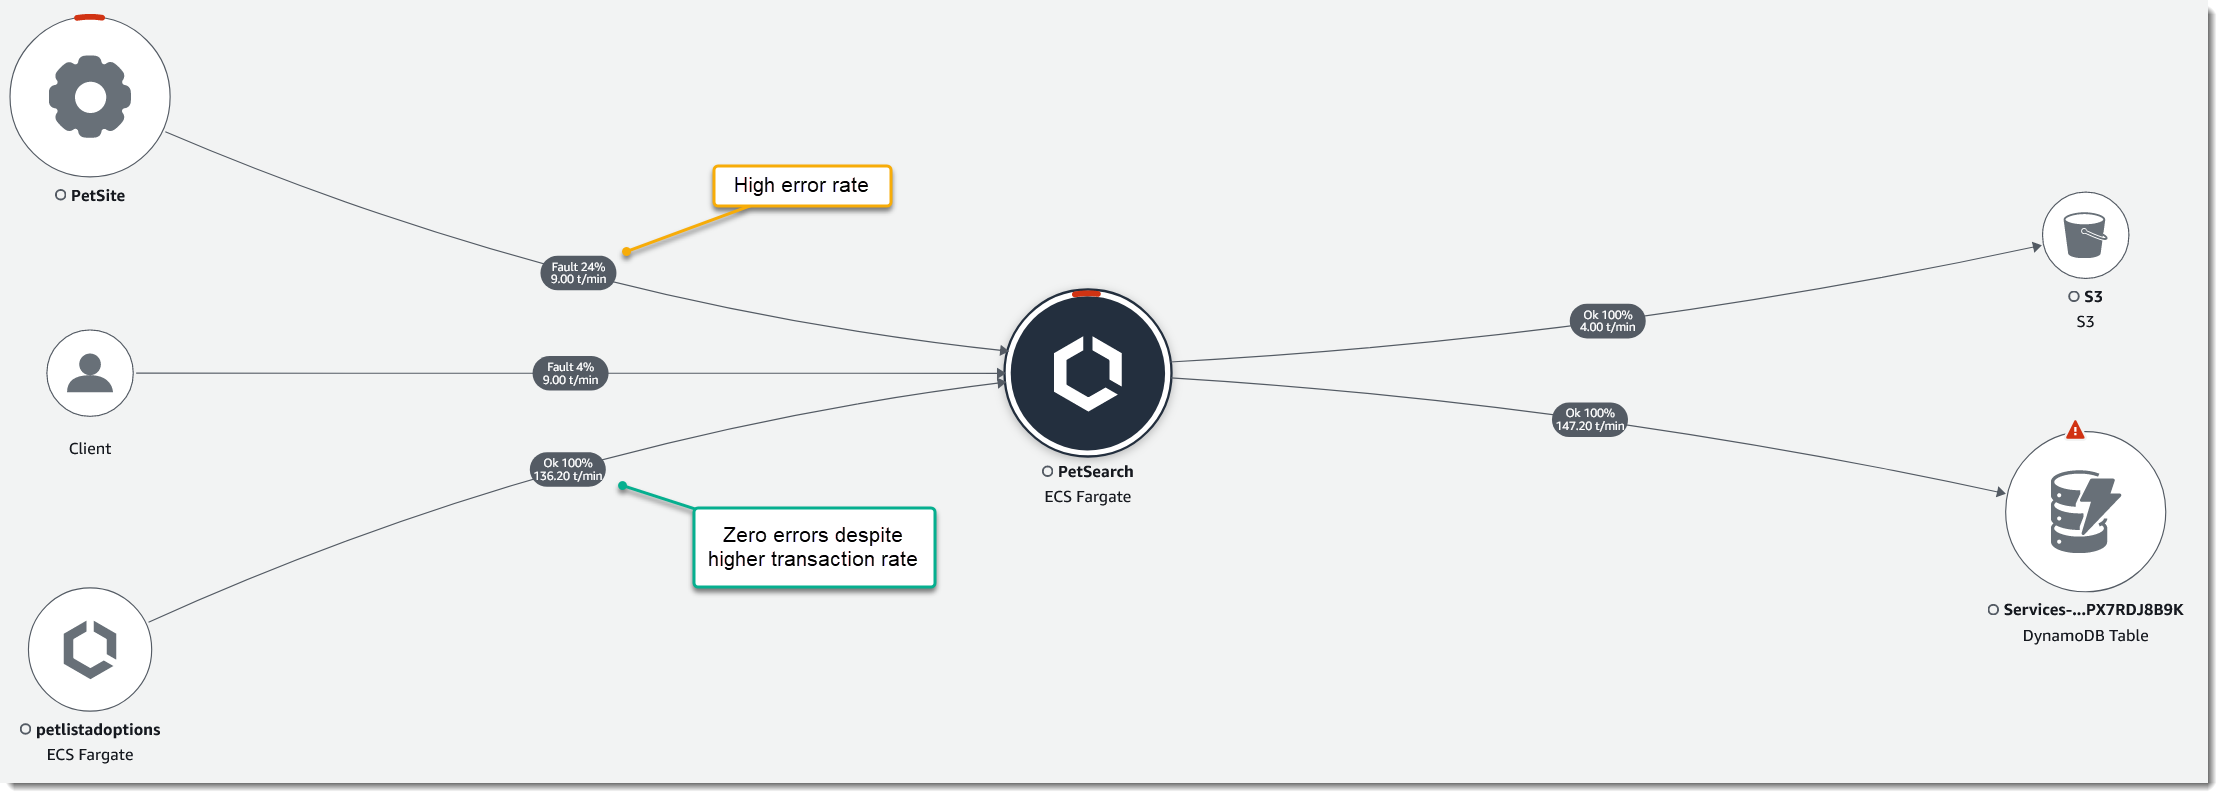
Figure 4: Incoming and outgoing requests for the PetSearch microservice
From the preceding image, you can see that there are three nodes making requests to the back-end PetSearch microservice and only two of them are experiencing issues. Selecting one of these edges brings up a panel with a Response time distribution graph summarizing the traffic along that path. If you were troubleshooting latency, you could highlight a portion of the graph showing slow response times and open the View filtered traces button to get a list of traces in the selected time window. In this case, I am more concerned with the 24% error rate from the front-end PetSite service so I select the checkbox next to 24% Faults (5xx) and open View filtered traces.
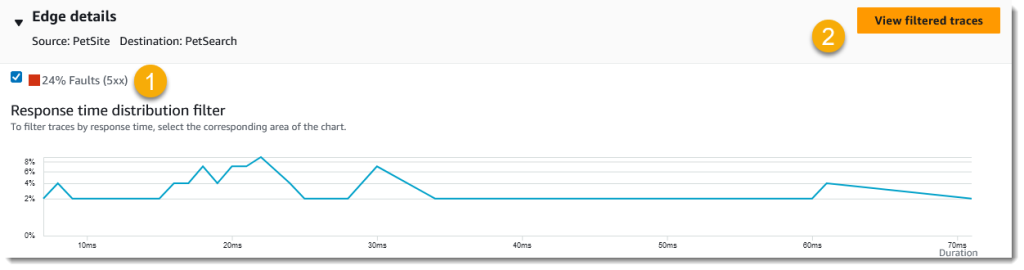
Figure 5: Response time distribution
This loads a new page where you can further refine the query if needed. Selecting the first trace from the table, you are brought to the Trace details page.
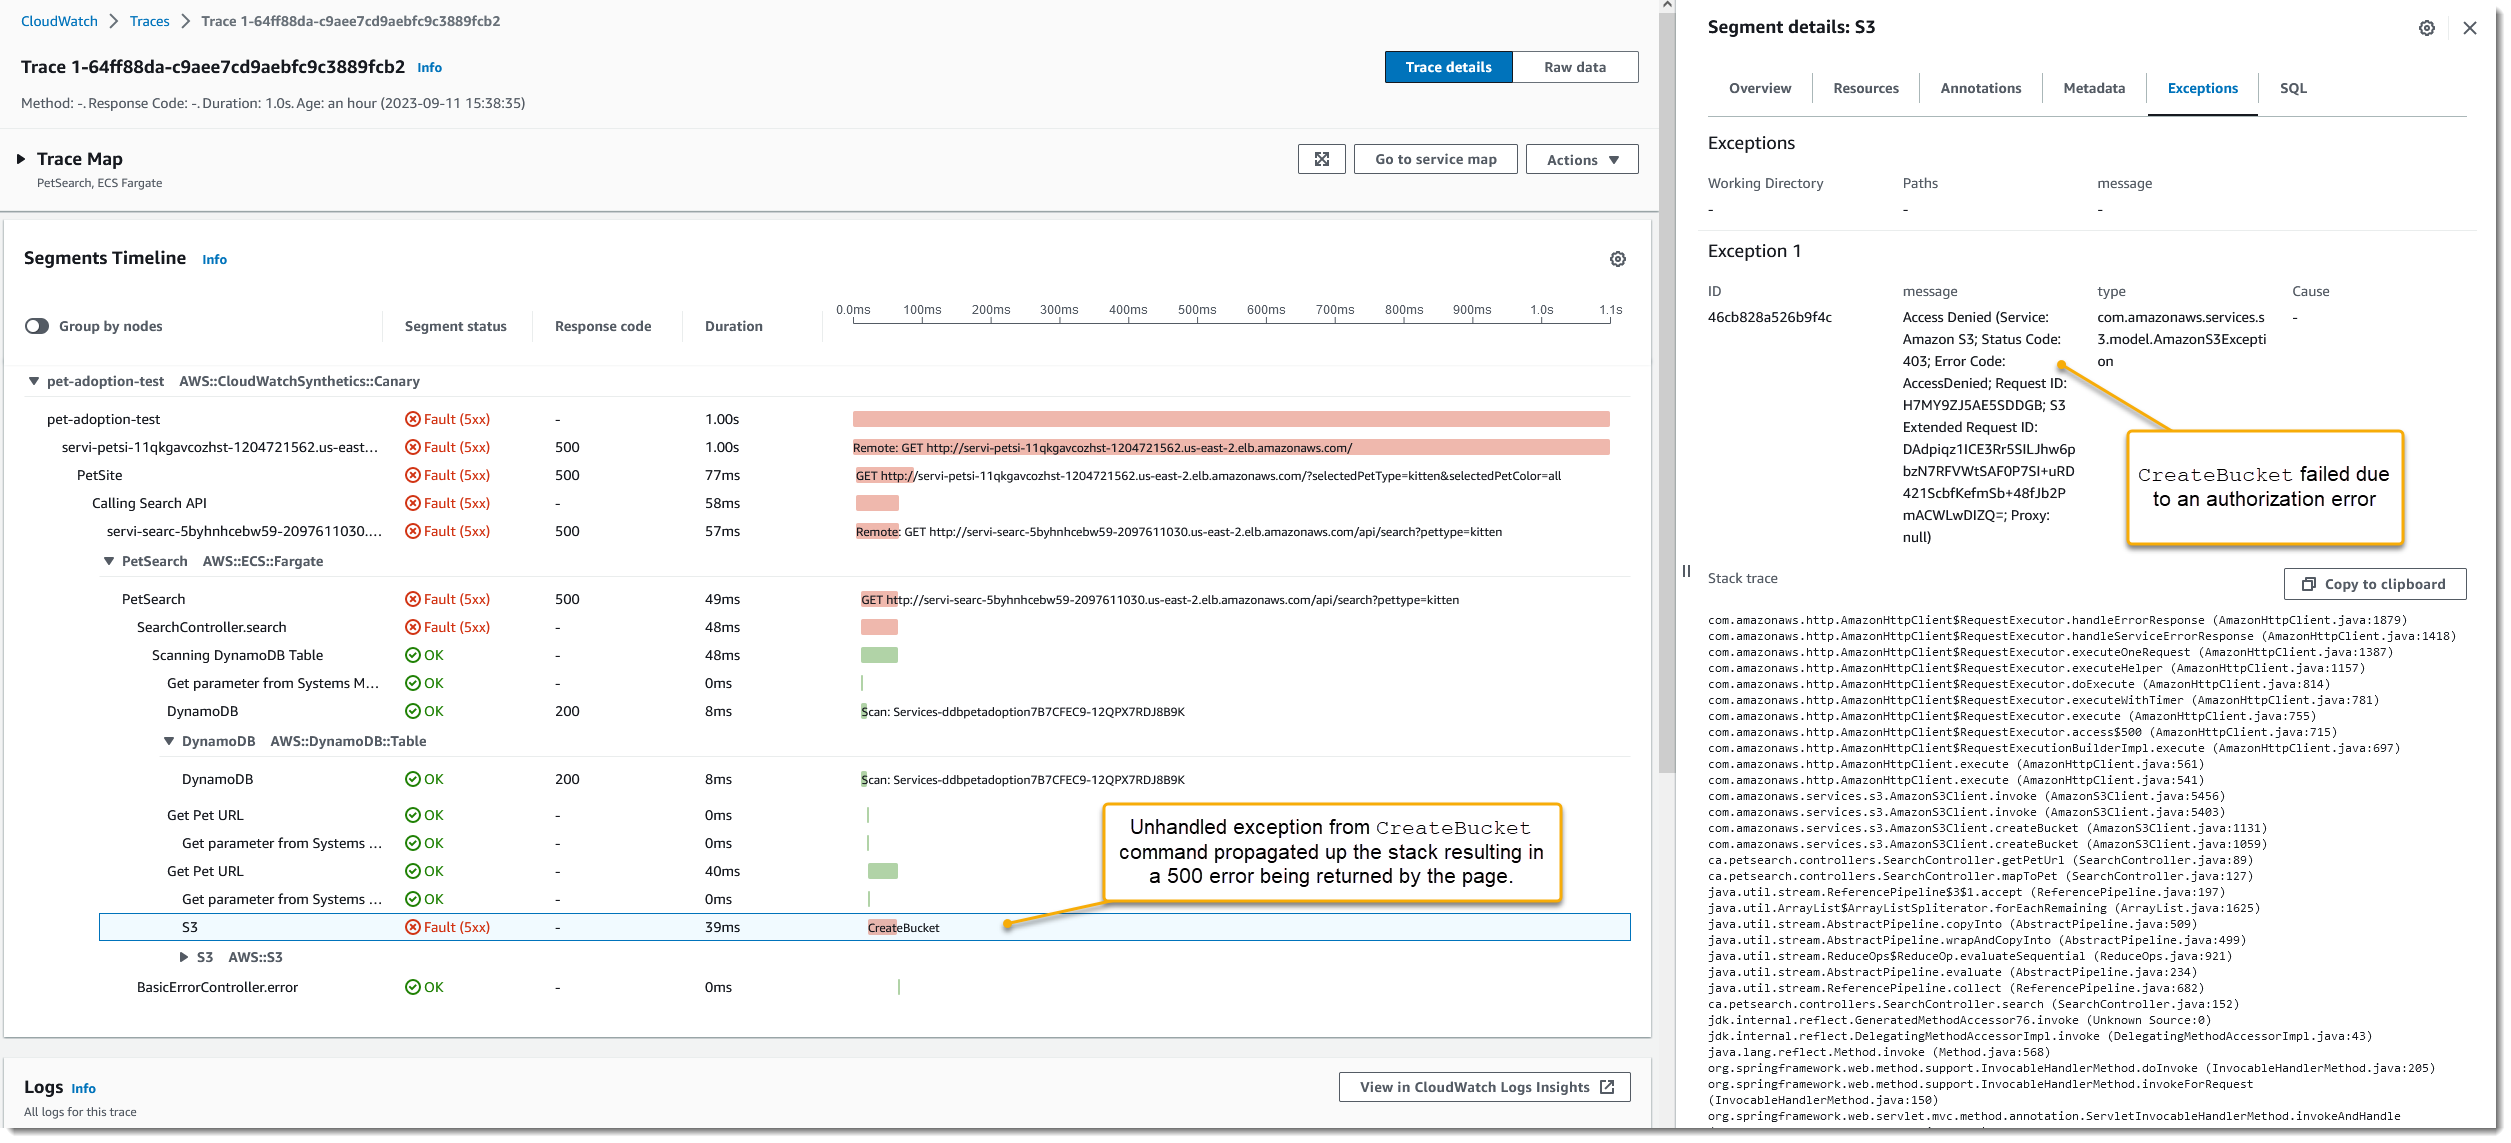
Figure 6: Trace details
With the Segment Timeline, you get a clear picture of what happened across the distributed system and can clearly see the status of each response as well as how long the request took to answer. Selecting a segment from the timeline loads a panel with additional details, allowing you to see on the Exceptions tab that the root cause of the failure is a permission issue leading to an authorization error. This page also displays a correlated list of log messages for all of the services associated with the trace, allowing you to see logs from different log groups in a single place.
Integrating with AWS X-Ray
ServiceLens builds its ServiceMap using traces from X-Ray to understand dependencies between services. While some interactions you want to capture will require instrumenting your workloads, many AWS services support X-Ray integration out of the box and only require you to opt-in. For a full list, please see integrating AWS X-Ray with other AWS services.
To enable X-Ray for your AWS Lambda functions
- Open the AWS Lambda console
- Select your function function from the list
- Choose the Configuration tab and then choose Monitoring and operations tools
- Choose Edit and then toggle Active tracing under AWS X-Ray
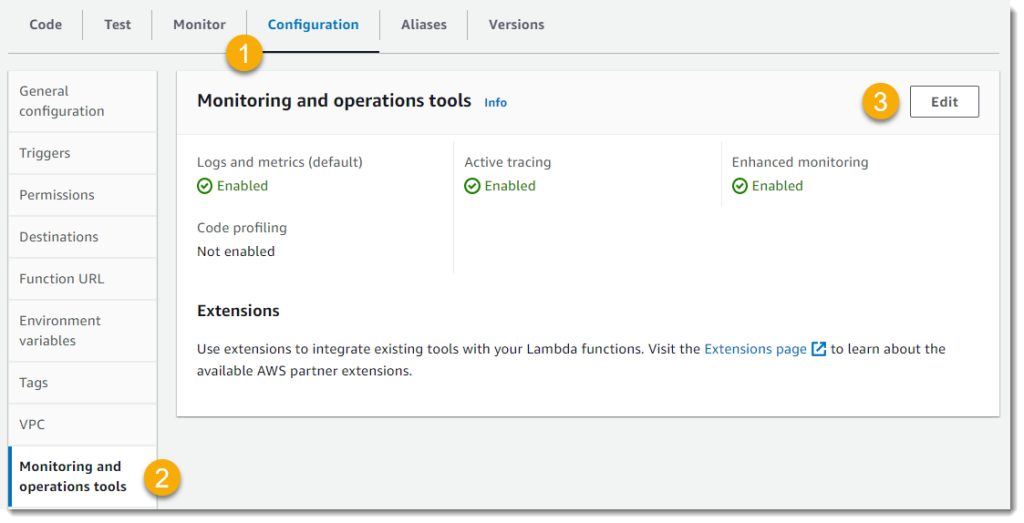
Figure 7: AWS Lambda configuration tools
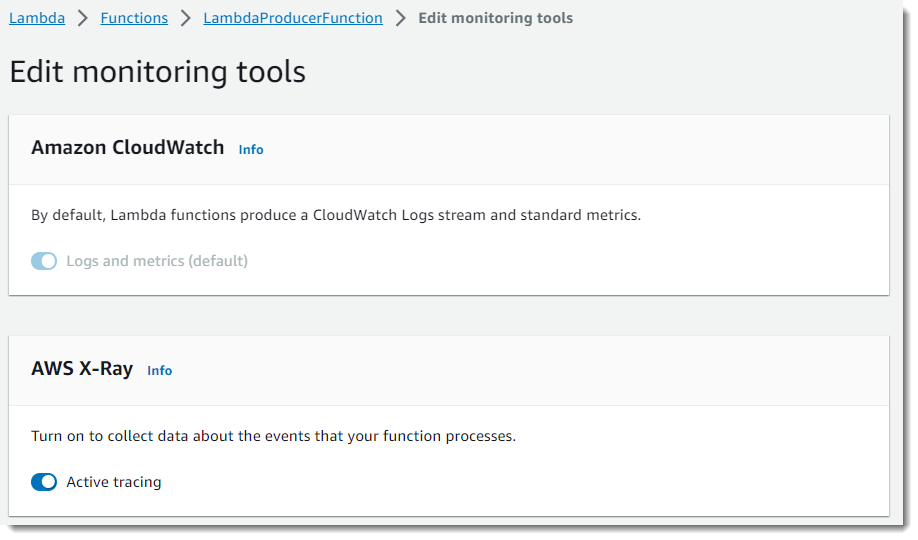
Figure 8: Enabling AWS X-Ray
While on the page to enable active tracing for your Lambda functions, you’ll also see an option to enable CloudWatch Lambda Insights under the Enhanced monitoring heading. This feature is used to collect, aggregate, and summarize system-level metrics; for further information, see the previous blog article detailing how to monitor AWS Lambda errors.
Conclusion
In this article, I reviewed some of the ways you can use CloudWatch ServiceLens and AWS X-Ray to monitor and observe your distributed workloads, focusing on the integrations between services. Once you’ve been alerted to an issue, ServiceLens can help you drill down into the relevant traces so that you can diagnose the failure and start working on a plan to return to normal business operations.
Interested in learning more about monitoring and observability? Review the AWS observability best practices and guide for monitoring your Lambda workloads using AWS native tooling. For a guided hands-on experience using AWS native or managed open-source tools, check out the One Observability Workshop.