AWS Cloud Operations Blog
Monitoring AWS Lambda errors using Amazon CloudWatch
When we troubleshoot failed invocations from our Lambda functions, we often must identify the invocations that failed (from among all of the invocations), identify the root cause, and reduce mean time to resolution (MTTR). In this post, we will demonstrate how to utilize Amazon CloudWatch to identify failed AWS Lambda invocations. Likewise, we will show how to enable CloudWatch Lambda Insights and AWS X-Ray in order to improve the monitoring experience, and get help identifying Lambda health and performance issues.
AWS Lambda monitors functions for you, and sends metrics to CloudWatch. The AWS Lambda Console creates monitoring graphs for these metrics, and then shows them on the “Monitor” tab for each Lambda function. CloudWatch lets you set alarms to respond to changes in utilization, performance, or error rates. The following image shows three widgets for “Invocation”, “Duration”, and “Error count and success rate (%)” metrics.
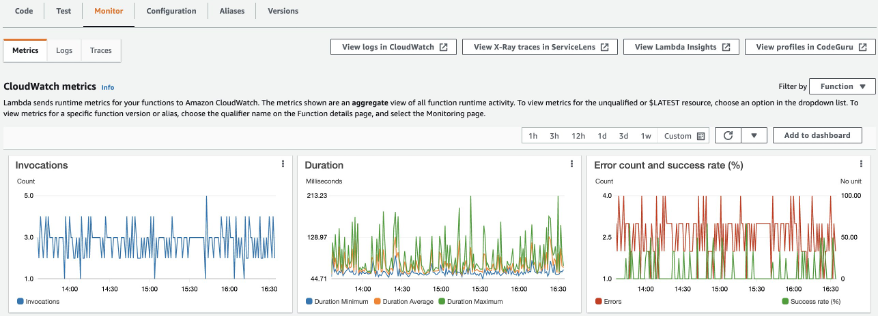
The Errors metric shows the number of invocations resulting in a function error aggregated at one-minute intervals. Function errors include unhandled exceptions thrown by your code, and errors thrown by the Lambda runtime. The runtime returns errors for issues such as timeouts and configuration errors. To calculate the error rate, divide the Errors value by the Invocations value. Note that an errors metric timestamp reflects when the function was invoked, not when the error occurred.
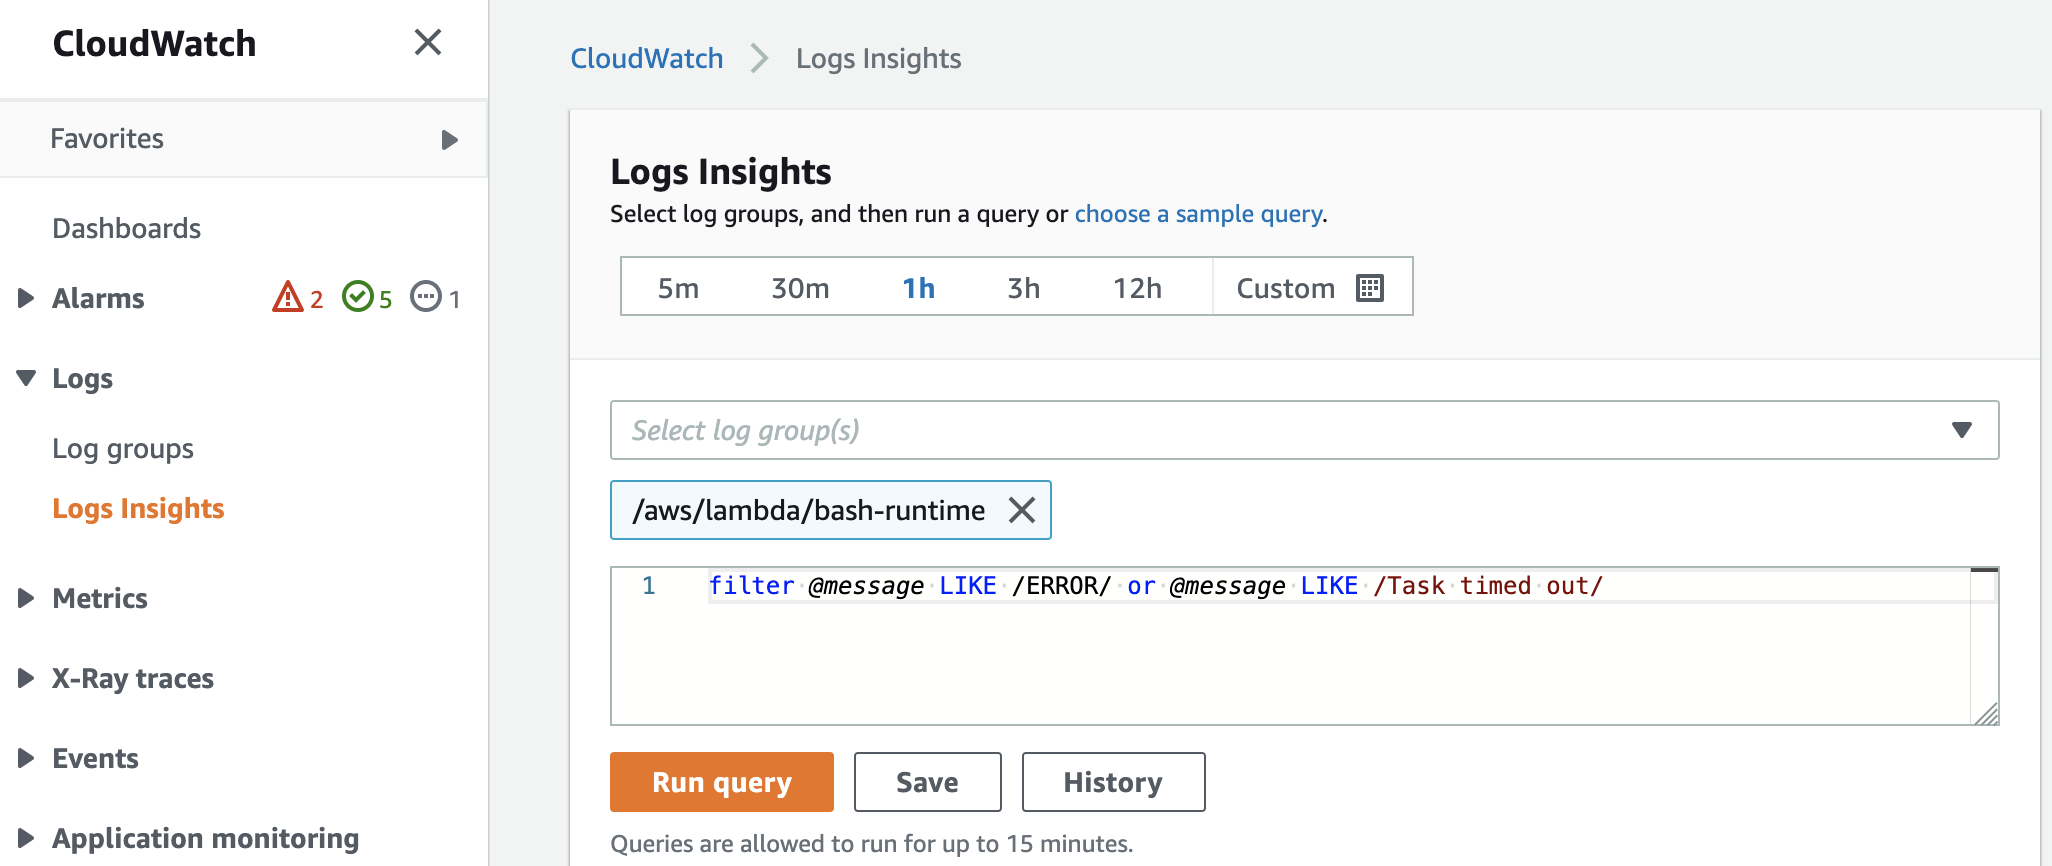
In the CloudWatch console, utilize Logs Insights to query platform logs that Lambda sends for each function execution. Each function stores logs in a function-specific log group. Furthermore, a single request can query up to 20 log groups. You can also save queries that you have created.
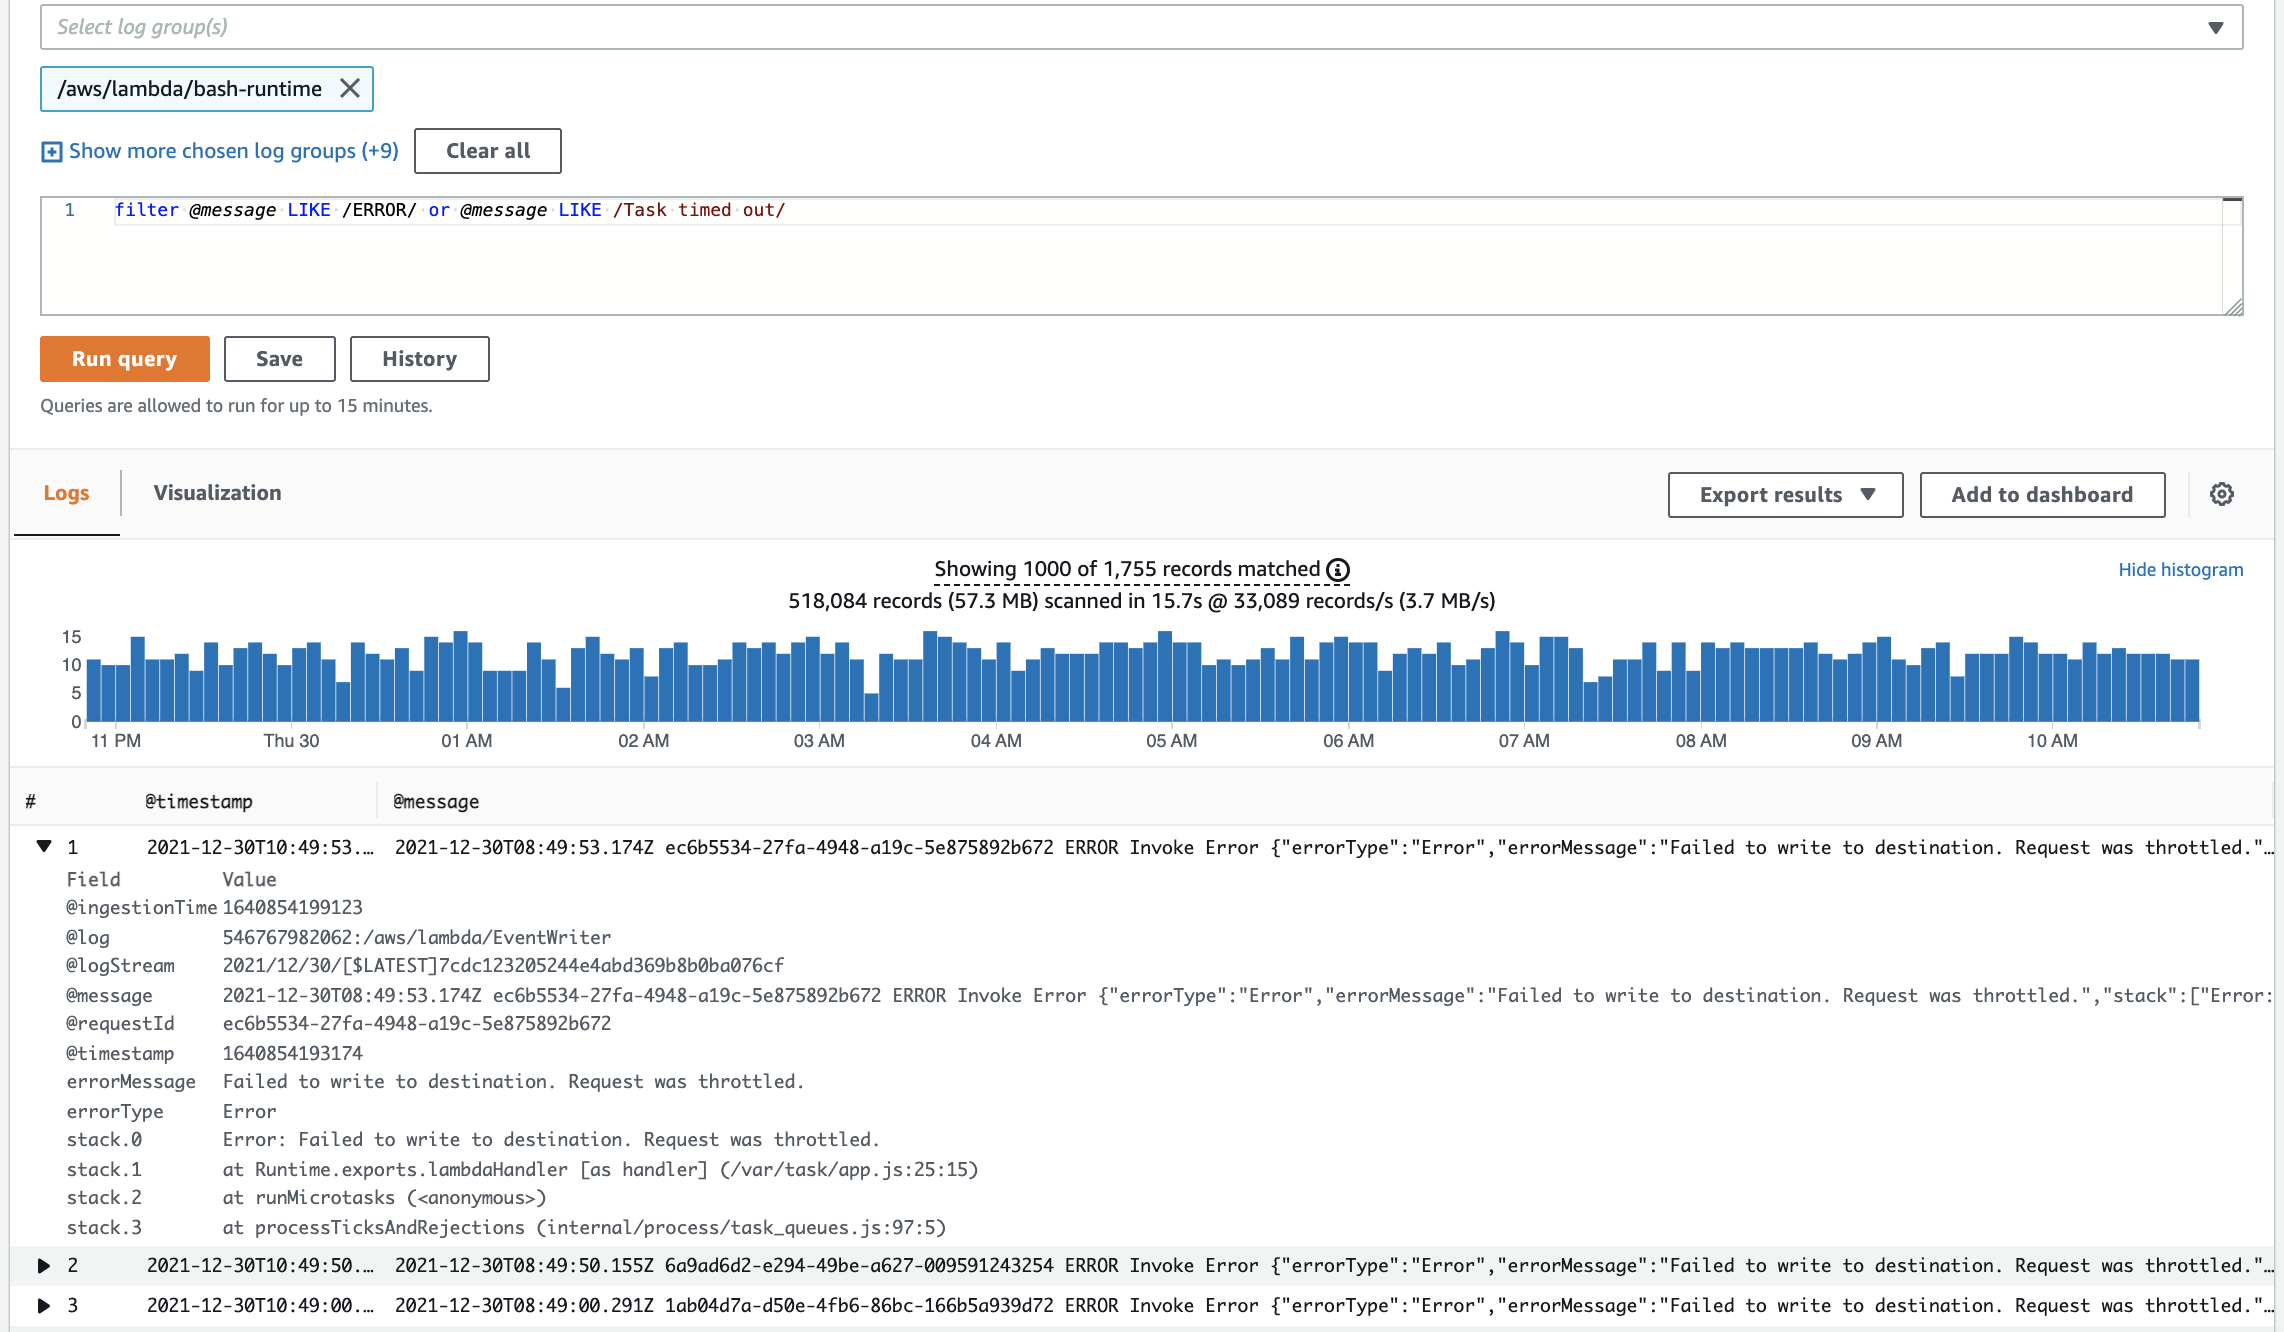
We will run the following query across 10 different log groups in order to identify invocations with errors:
After running the search query, we get a list of log events containing ”ERROR“ or ”Task timed out“ in the payload. Expanding one log event reveals the invocation request ID in the @requestId field. Copy the request ID and add it to the query. We also see that this invocation had the following error “Error: Failed to write to destination. Request was throttled.”
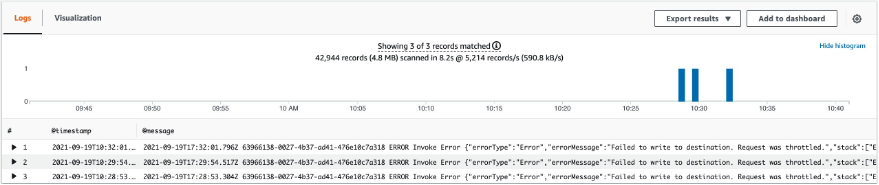
Next, run the following query, which reveals that this invocation has been throttled three times (we can see timestamps for each throttle).
This is how you can utilize Amazon CloudWatch to identify failed AWS Lambda invocations. Now we will show you how to get more detailed insights into your Lambda function invocations by using CloudWatch Lambda Insights.
CloudWatch Lambda Insights
Amazon CloudWatch Lambda Insights is provided by the Amazon CloudWatch team, and it enables you to efficiently monitor, troubleshoot, and optimize Lambda functions. Lambda Insights simplifies the collection, visualization, and investigation of detailed compute performance metrics, errors, and logs. Easily isolate and correlate performance problems in order to optimize your Lambda environments. Lambda Insights is available today in every region where AWS Lambda is available.
How to Enable Lambda Insights
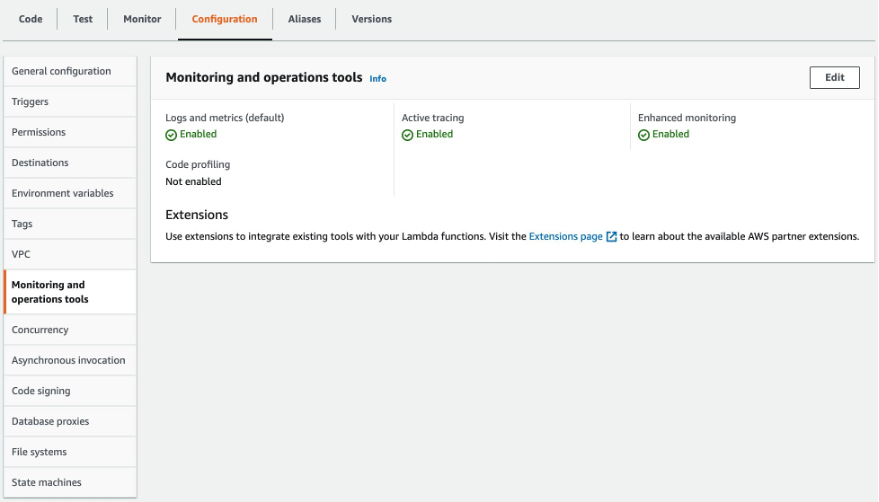
Utilize the Lambda Console to enable Lambda Insights and X-Ray (Enhanced monitoring) for your Lambda function (see the image below). Alternatively, utilize the AWS CLI, AWS CloudFormation, the AWS Serverless Application Model CLI (AWS SAM), or the AWS Cloud Development Kit (AWS CDK). For more details, see the documentation.
Using Lambda Insights (Multi-Function)
Let’s start looking at Lambda Insights in CloudWatch. To do this, go to CloudWatch and click “Multi-function” under Insights/Lambda Insights. Here, we can observe metrics for multiple Lambda functions enabled, in this account, that have Lambda Insights enabled.
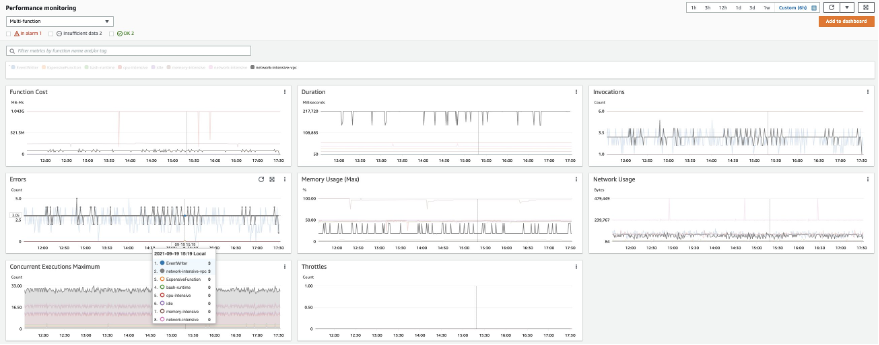
In the Errors metric, we can identify the function “network-intensive-vpc” as having the highest error rate. We will dig deeper into this function.
Using Lambda Insights (Single Function)
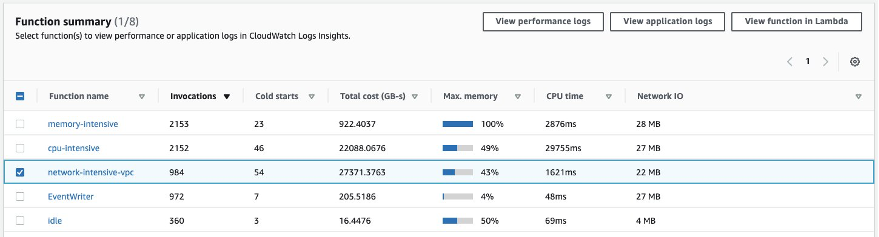
At the bottom of the Lambda Insights Multi-Function page, select any of the given Lambda functions to see metrics on a per-function basis. Select the Lambda function named network-intensive-vpc:
On the next screen, we can see the Error rate, CPU, memory, and network utilization for the selected Lambda function. If you have enabled AWS X-Ray for your Lambda function, then the Lambda execution trace will be available in the Trace column. Moreover, we can see that the most recent invocations have error. Let’s dig deeper into that.
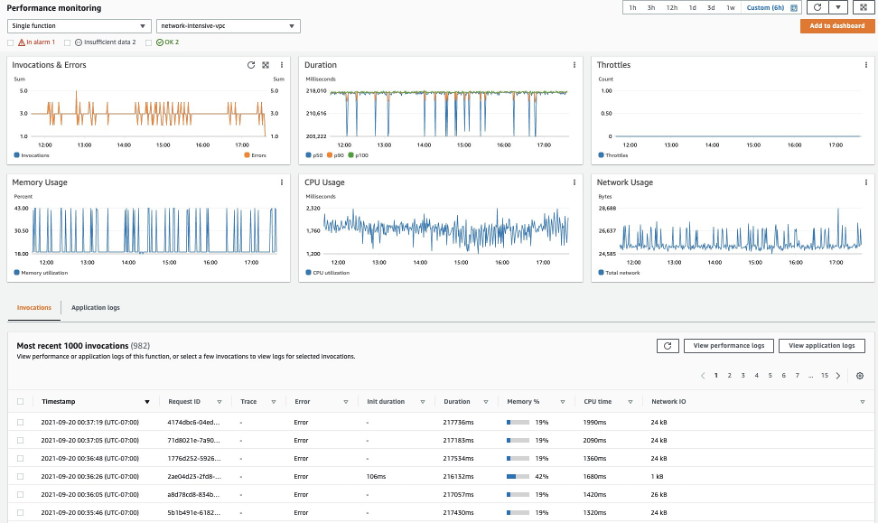
We can also look at the Lambda logs for a particular event by selecting an invocation and going to “View Application Logs”. This takes us to CloudWatch Log Insights. Selecting “View Performance Logs” will again take us to CloudWatch Log Insights for Log Group “/aws/lambda-insights”. Here, we can see the Lambda function performance logs in Embedded Metric Format (EMF).
To get the performance logs, run the following query:
If we expand the resulting log event, then we see that the shutdown_reason field shows “failure”. These are runtime errors, and to verify this we’ll run the following query in the application logs:

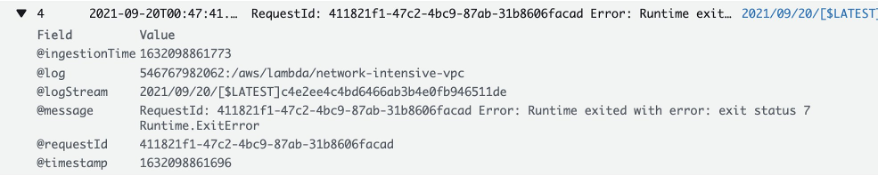
In the log event we see that our function suffered from a runtime error.
This is how you can utilize CloudWatch Lambda Insights to zoom in on an individual invocation of your Lambda function in order to better understand what caused it to fail. CloudWatch Lambda Insights is built using AWS Lambda Extensions, which let you easily integrate Lambda functions with your favorite tools for monitoring, observability, security, and governance.
What are Lambda Extensions?
In May 2021, we announced the general availability of AWS Lambda Extensions. Extensions are a new way for tools to more easily integrate deeply into the Lambda execution environment in order to control and participate in Lambda’s lifecycle without complex installation and configuration. Utilize Lambda extensions for use cases such as capturing diagnostic information before, during, and after function invocation. Choose from a wide range of extensions provided by popular AWS services, AWS Lambda partners, and the open source community (see our What’s New post for a list of popular extensions to choose from). Likewise, you can utilize the Lambda Extensions API to build your own extensions.
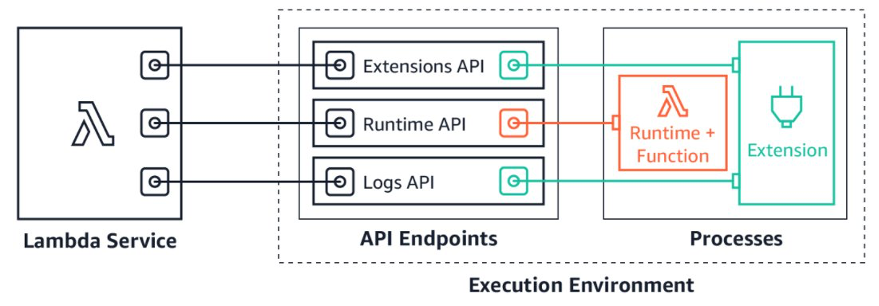
Lambda extensions are companion processes that augment Lambda function capabilities. Extensions utilize the Extensions API to register for Lambda lifecycle events: initialization, invocation, and shutdown. Then, extensions can run logic or start new processes in response to these lifecycle events. Lambda extensions can also utilize the Runtime Logs API to subscribe to a stream of the same logs that the Lambda service sends to Amazon CloudWatch directly from within the Lambda execution environment. If the extension is subscribed to the Logs API, then the Lambda platform will stream the logs to the extension, so that the extension can process, filter, and send these logs to any preferred destination.
Add extensions to your Lambda functions by using Lambda layers or include them in the image for functions deployed as container images. Install and manage extensions by using the AWS Lambda Console, the AWS Command Line Interface (CLI), or infrastructure as code (IaC) services and tools, such as AWS CloudFormation, AWS Serverless Application Model (AWS SAM), and Terraform.
CloudWatch Lambda Insights Pricing
When you enable Lambda Insights for your Lambda function, Lambda Insights reports eight metrics per function, and every function invocation sends approximately 1 KB of log data to CloudWatch. You only pay for the metrics and logs reported for your function by Lambda Insights. There are no minimum fees or mandatory service usage polices. Furthermore, you do not pay for Lambda Insights if the function is not invoked. For a pricing example, see Amazon CloudWatch pricing.
As well, utilize the AWS Price Calculator to estimate Lambda Insights costs. For example, a function running 500,000 times per month will cost you less than $2.7 per month to be monitored using Lambda Insights.
Conclusion
This post demonstrated how to utilize CloudWatch to troubleshoot AWS Lambda invocation errors, and how to enable Lambda Insights in order to get a deep observability view with additional data that helps reduce the MTTR. To learn more about Lambda extensions, see the documentation. To learn more about AWS observability functionalities on Amazon CloudWatch and AWS X-Ray, see the One Observability Demo workshop.