AWS Cloud Operations Blog
Monitor hybrid and multicloud environments using AWS Systems Manager and Amazon CloudWatch
As customers accelerate their migrations to the cloud and transform their businesses, some find themselves in situations where they have to manage IT operations in a hybrid or multicloud environment.
These customers are faced with additional complexity when it comes to operating their applications and infrastructure. They often must use solutions from multiple providers to provision, manage, and govern IT resources, to monitor the health of their applications, and to collect and analyze data stored in multiple locations.
In this post, we show how organizations can use AWS services to monitor their workloads deployed in other public cloud providers, such as Microsoft Azure (Azure) and Google Cloud Platform (GCP).
Solution scenario
The post implements the following monitoring solution in AWS for a workload deployed in Azure and GCP:
- Setup needed to support monitoring a workload in a multicloud environment.
- Monitor an application deployed in Linux-based VMs provisioned by Azure and GCP.
- Capture logs and metrics from other cloud providers in AWS.
- Build an observability dashboard in AWS to monitor workloads and provide insights.
The post does not cover an exhaustive list of use cases, or showcase all the capabilities which AWS provides for monitoring a multicloud environment. The intent of the post is to show that AWS Observability tools and services can meet an organization’s multicloud monitoring requirements, and are not constrained by the application type or the platform.
Environment Setup
This section describes the steps to set up and configure AWS services to enable monitoring of a workload deployed in a multicloud environment.
Configure roles, permissions, and resources for AWS Systems Manager (SSM)
- Follow the steps on how to set up Systems Manager for hybrid and multicloud environments. These steps are:
- Create an IAM service role for a hybrid and multicloud environment. Add CloudWatchAgentServerPolicy to this IAM role.
- Create a hybrid activation for a hybrid and multicloud environment.
- Install SSM Agent for a hybrid and multicloud environment (Linux) or Install SSM Agent for a hybrid and multicloud environment (Windows).
If you plan to use both Amazon EC2 instances and non-EC2 machines in a hybrid and multicloud environment, follow steps for setting up Systems Manager for EC2 instances.
-
Upon completion of the above steps, you will see all your managed nodes in the Fleet Manager console under AWS Systems Manager. Virtual machines (VMs) configured as a managed node using hybrid activation, for on-premises and multicloud scenarios, will be prefixed with “mi-“, as shown in Figure 1 below:

Figure 1 – AWS SSM Fleet Manager
-
Choose a managed node in the Fleet Manager console to add a tag, as shown in Figure 2 below.

Figure 2 – Managed instances tag
- [Optional] If you want to use Session Manager to connect to non-EC2 nodes, activate the advanced tier. Refer Turning on the advanced-instances tier to configure your multicloud environment to use the advanced-instances tier.
Install and configure Amazon CloudWatch Agent to capture logs and metrics
- Install the CloudWatch agent on the managed instance(s) by using AWS Systems Manager’s Run command, and then selecting AWS-ConfigureAWSPackage document.
- Configure the managed instances that use SSM Agent and the unified CloudWatch agent to use temporary AWS credentials. See the following knowledge center article on how to do so.
-
We recommend that you create a standard Amazon CloudWatch agent configuration that includes the system logs and metrics which you want to capture across all your managed instances. For prescriptive guidance on managing CloudWatch configurations, refer to the Managing CloudWatch agent configuration files.
We stored the configuration for EC2, Azure VMs, and GCP VMs in Systems Manager Parameter Store parameters, as shown below in Figure 3. If you created the configuration file using the CloudWatch agent configuration file wizard, or manually created the file, start the CloudWatch agent with that configuration file in the next step.

Figure 3 – AWS SSM Parameter Store
-
Configure and start the CloudWatch agent by using System Manager Run command and selecting AmazonCloudWatch-ManageAgent document, as shown below in Figures 4, 5, and 6.

Figure 4 – AWS SSM Run command

Figure 5 – AWS SSM Run command parameters

Figure 6 – Managed instance target selection
Note that instead of manually selecting the managed instances to target, we specified the instance tags we defined in a previous step.
End-to-end monitoring in AWS
AWS monitoring and observability services enable monitoring of on-premises, other cloud platforms, and AWS environments, providing a single pane of glass for monitoring. This section demonstrates how organizations can monitor their multicloud environments holistically. In this scenario, we configured the VMs deployed in Azure and GCP, using the steps described in the previous section.
CloudWatch Metrics
Figures 7, 8, and 9 below shows metrics captured from managed instances on Azure and GCP. Custom namespaces such as Azure/VM and GCP/VM, were specified in the metrics section of CloudWatch agent configuration files in step 3 above. Metrics from EC2 instances will be populated in the AWS/Instances namespace, as highlighted in figure 7.
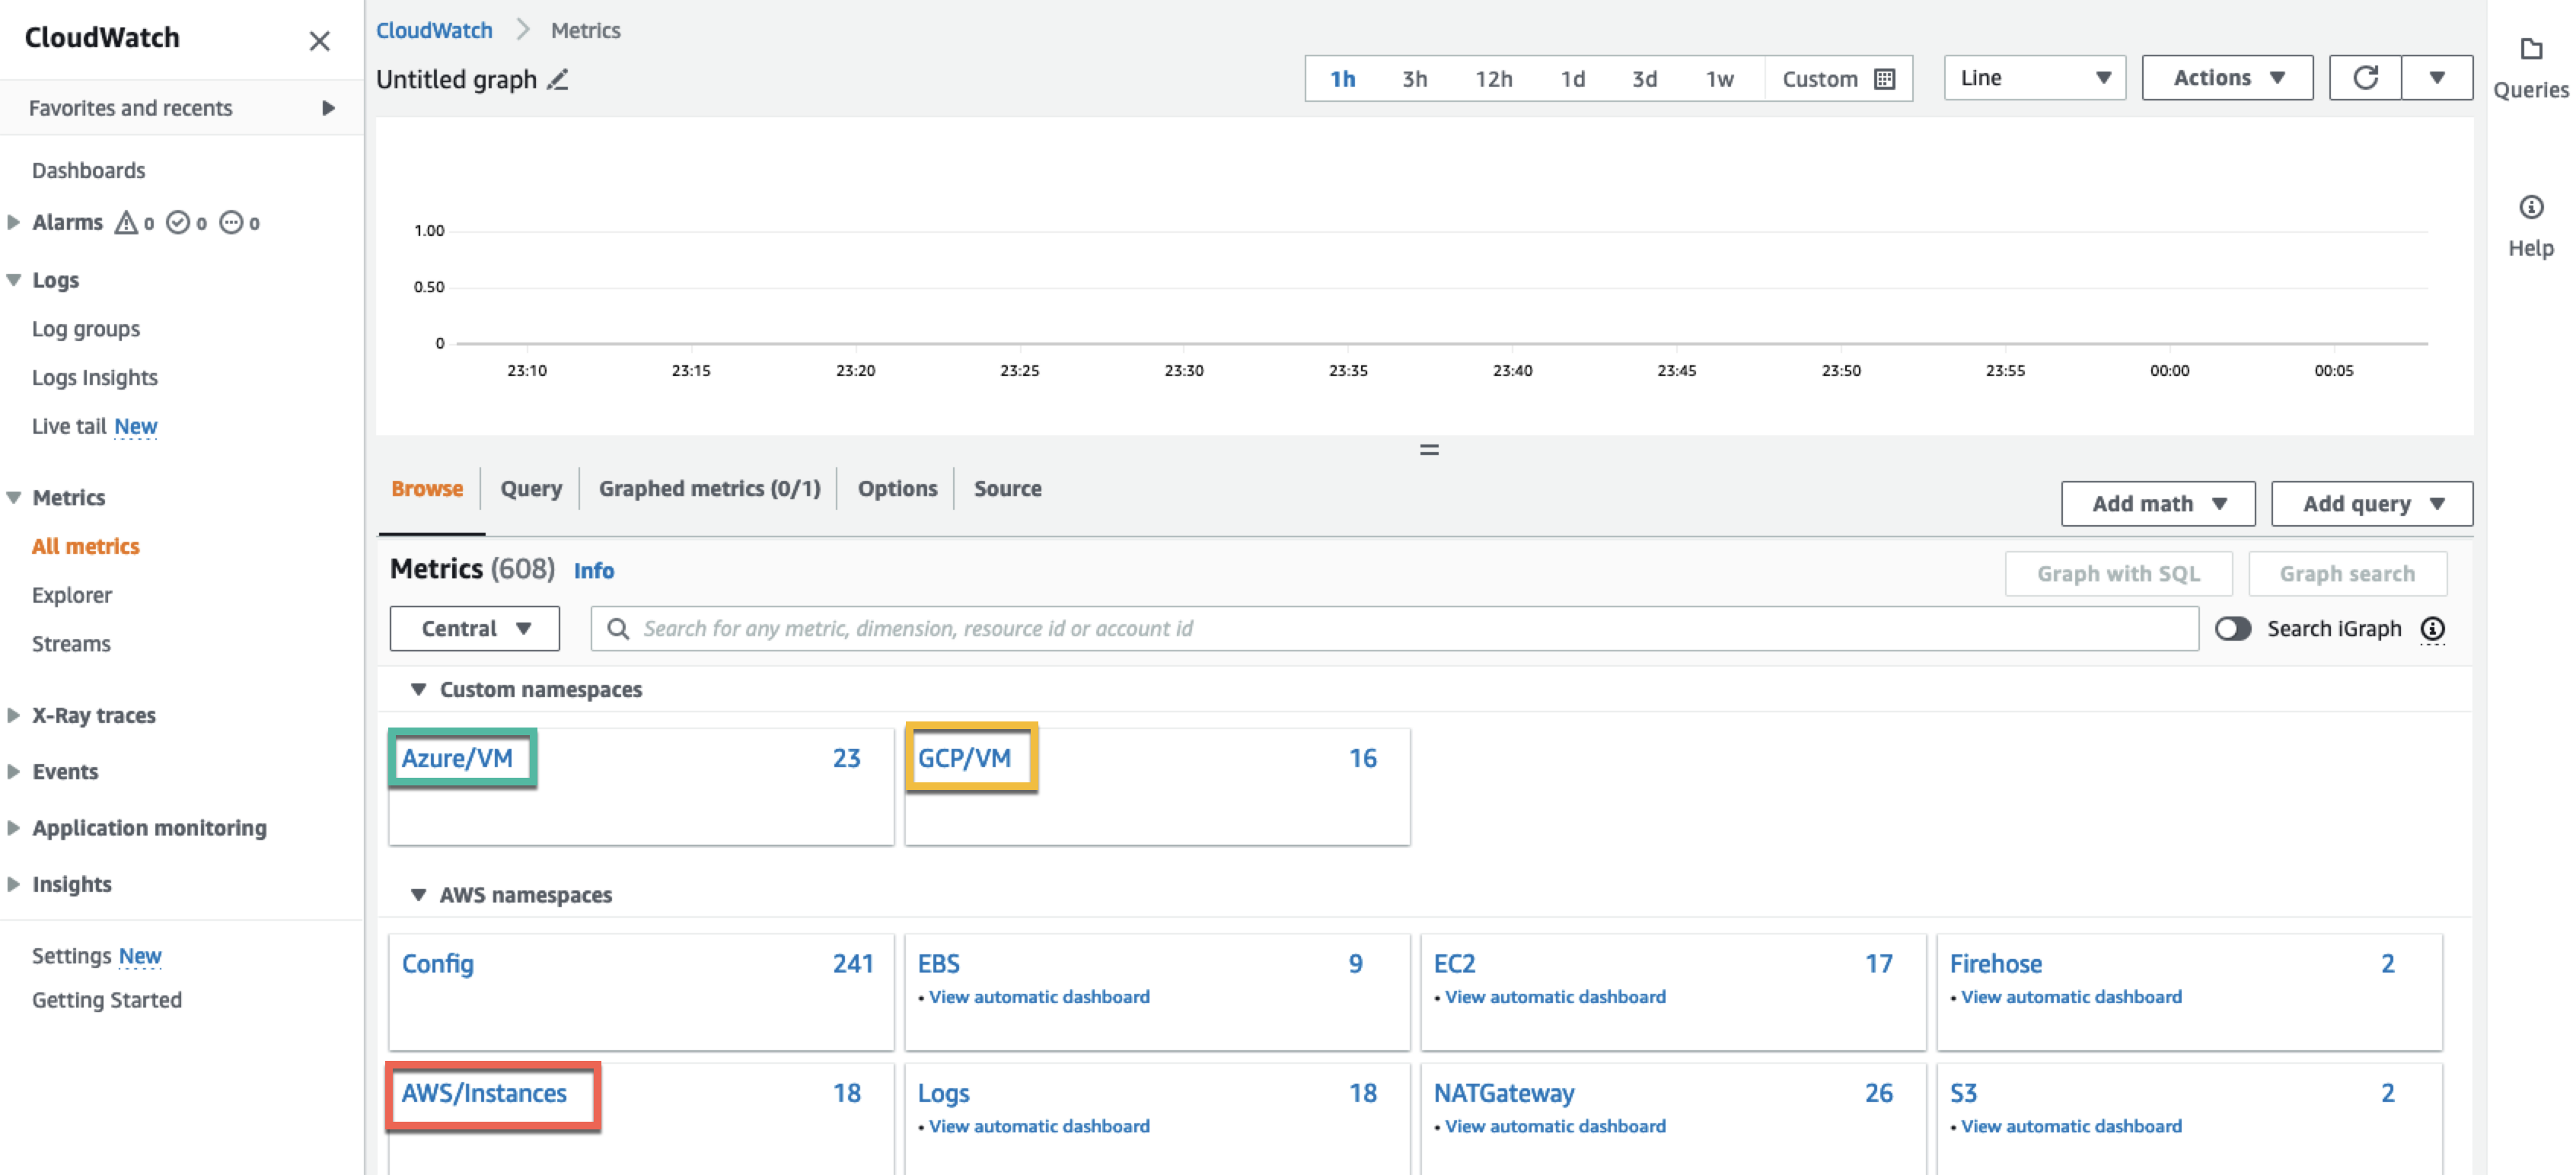
Figure 7 – CloudWatch Metrics namespaces

Figure 8 – Metrics from Azure VM in CloudWatch Metrics
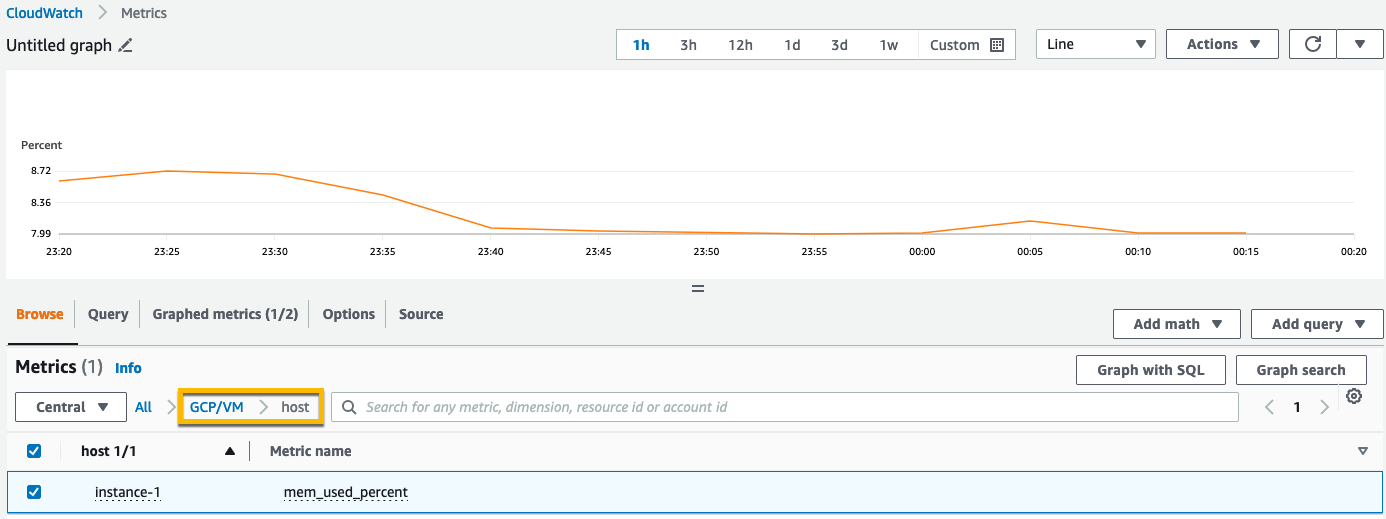
Figure 9 – Metrics from GCP VM in CloudWatch Metrics
CloudWatch Logs
Figure 10 below is a view of CloudWatch log groups created to ingest logs from managed instances.
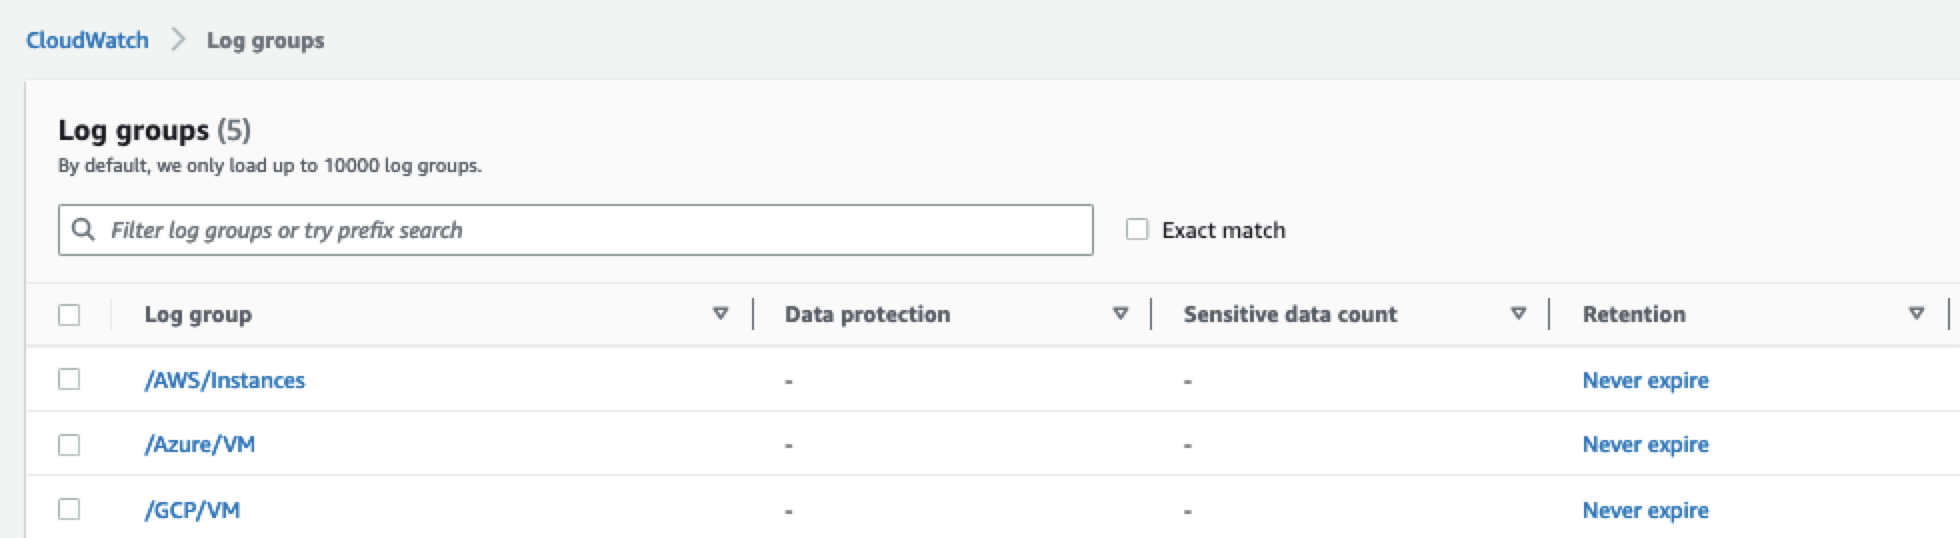
Figure 10 – CloudWatch log groups
Figure 11 shows the CloudWatch log stream created in the log group (/GCP/VM) to capture Syslog logs from the Debian-Linux VM running in GCP.
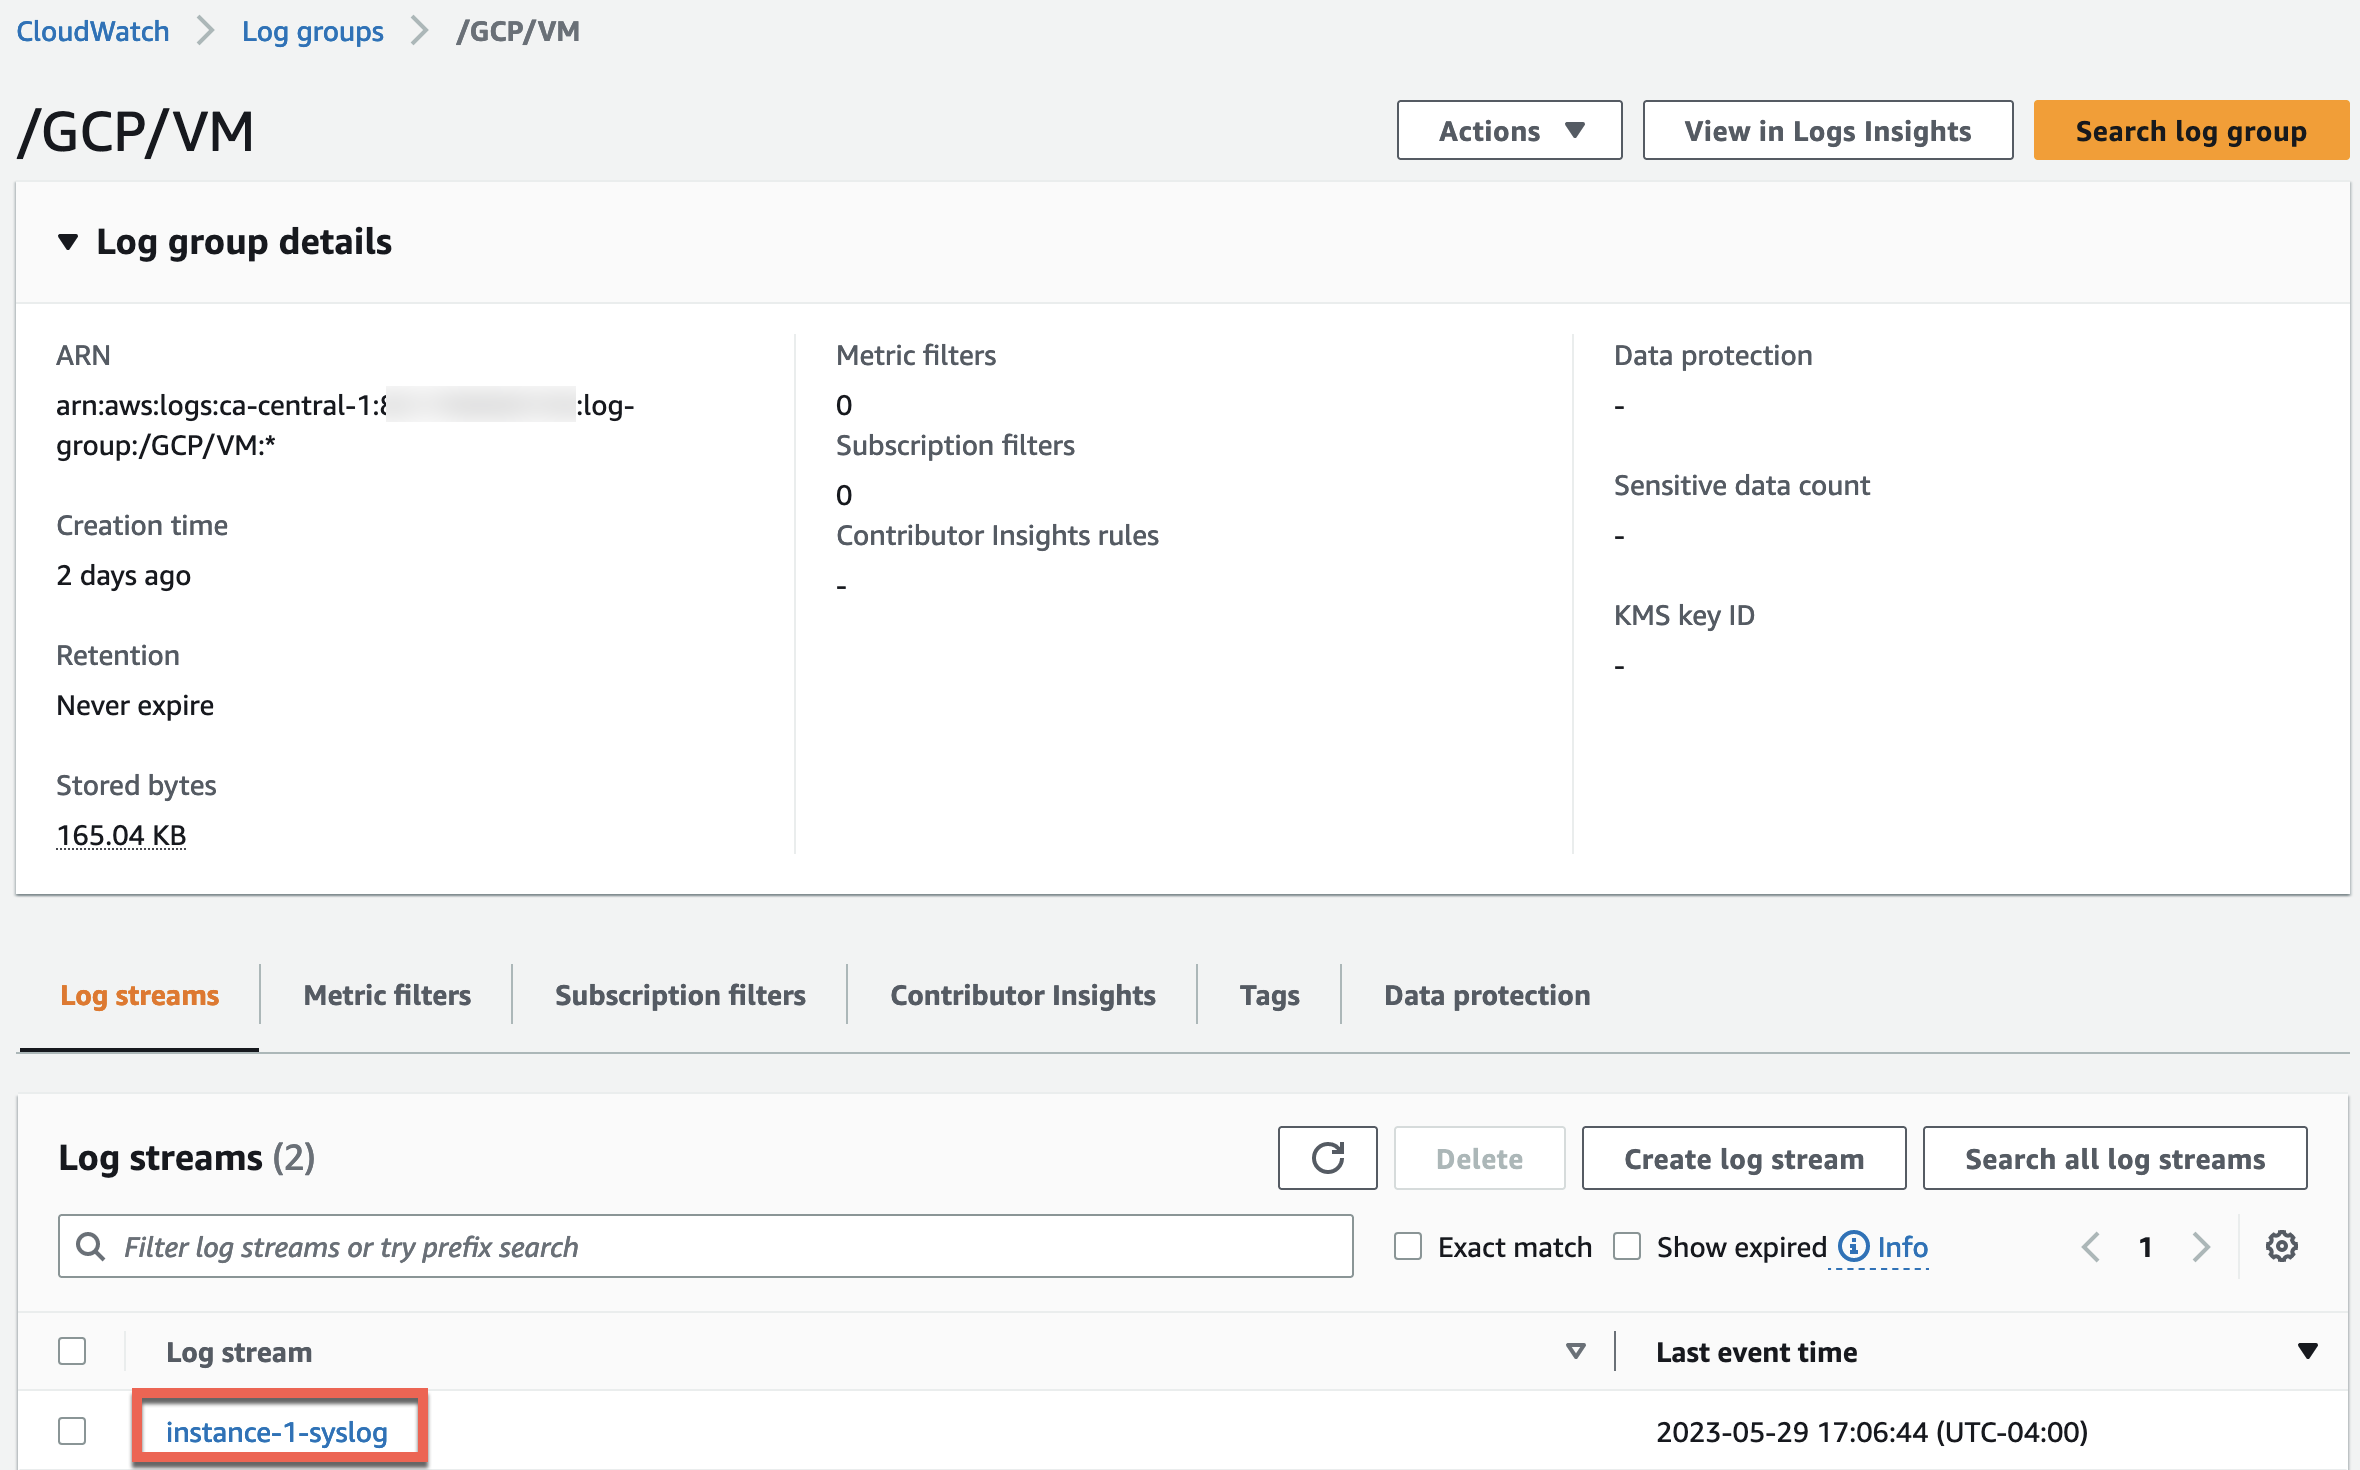
Figure 11 – CloudWatch log groups log stream
Figure 12 below shows logs pushed from on-premises servers.
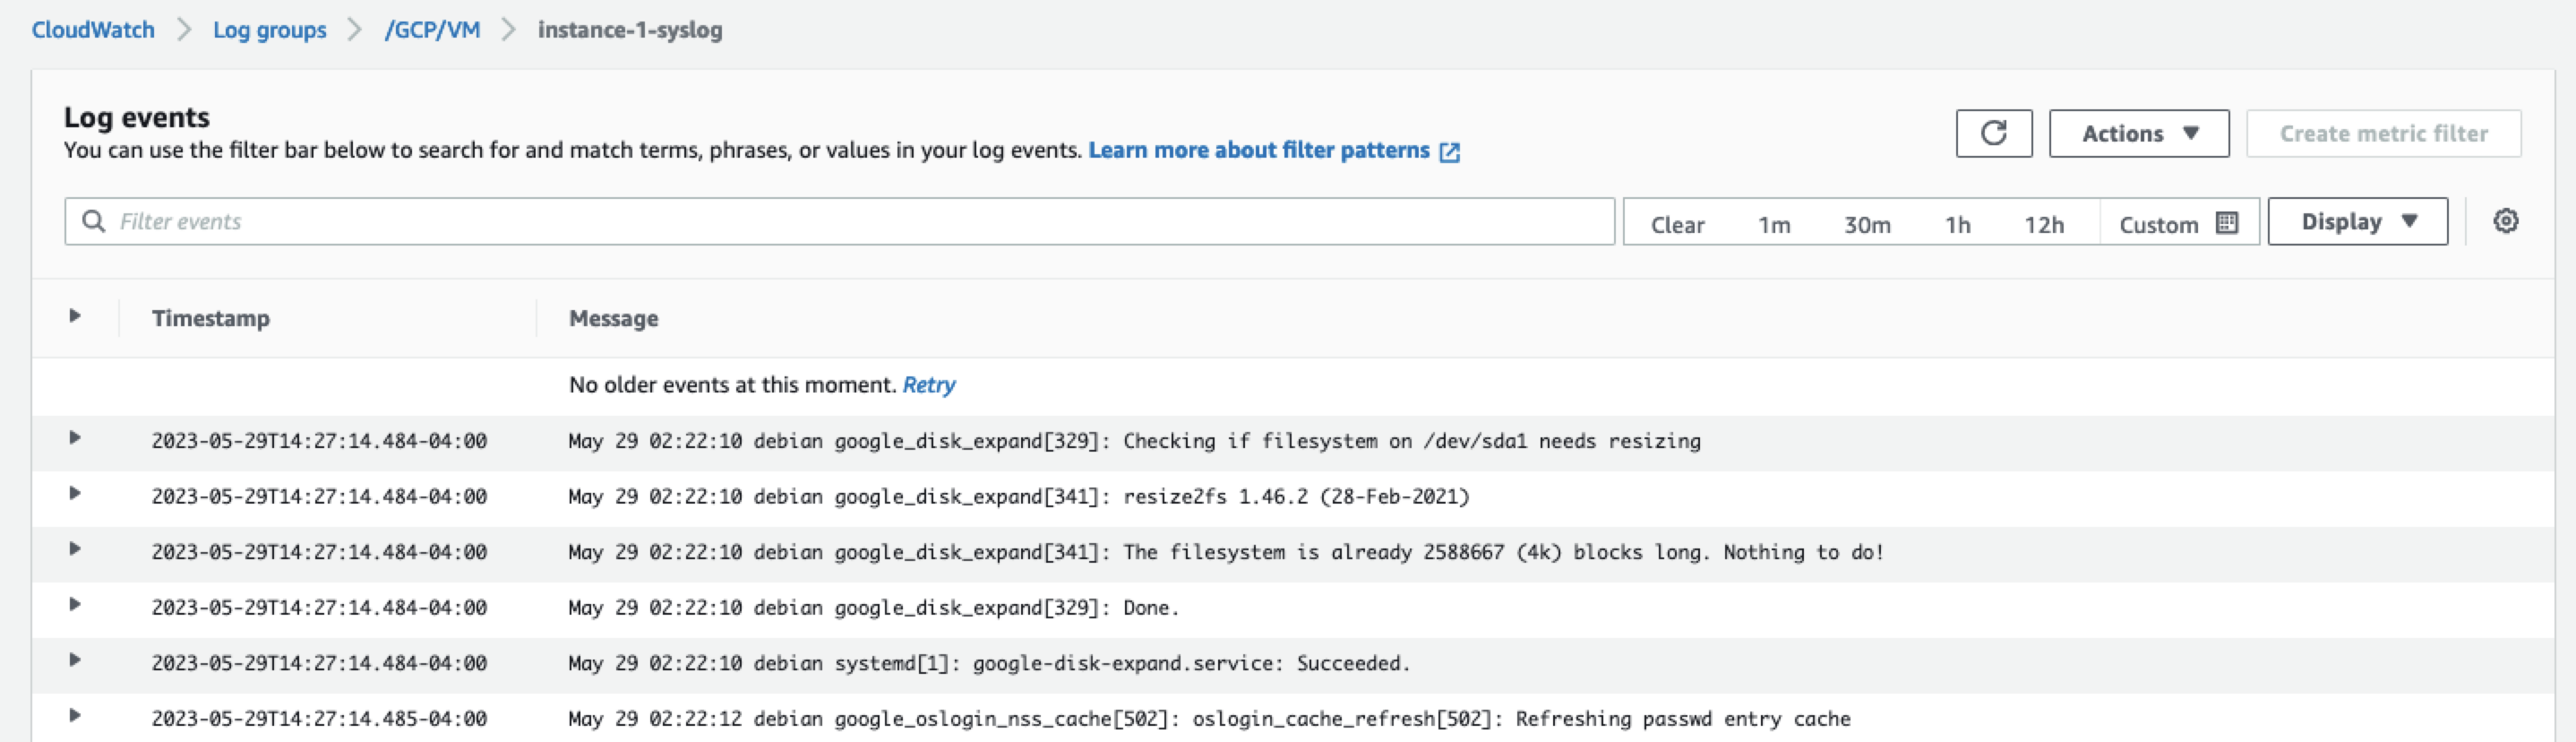
Figure 12 – Syslog from GCP VM
CloudWatch Dashboards
In Figure 13 below, you will find an example of single view that you can create for your multicloud environment using CloudWatch Dashboards. You use the same powerful high-performance SQL query engines, such as CloudWatch Metrics Insights and CloudWatch Logs Insights, for creating rich, customizable, and insightful dashboards for your managed instances across your multicloud environment. In the CloudWatch dashboard image below, we show you a visualization of relevant CPU/memory metrics and logs from our multicloud resources to help assess their performance. You can create dashboards from the AWS Console or using the AWS CLI or PutDashboard API operation.
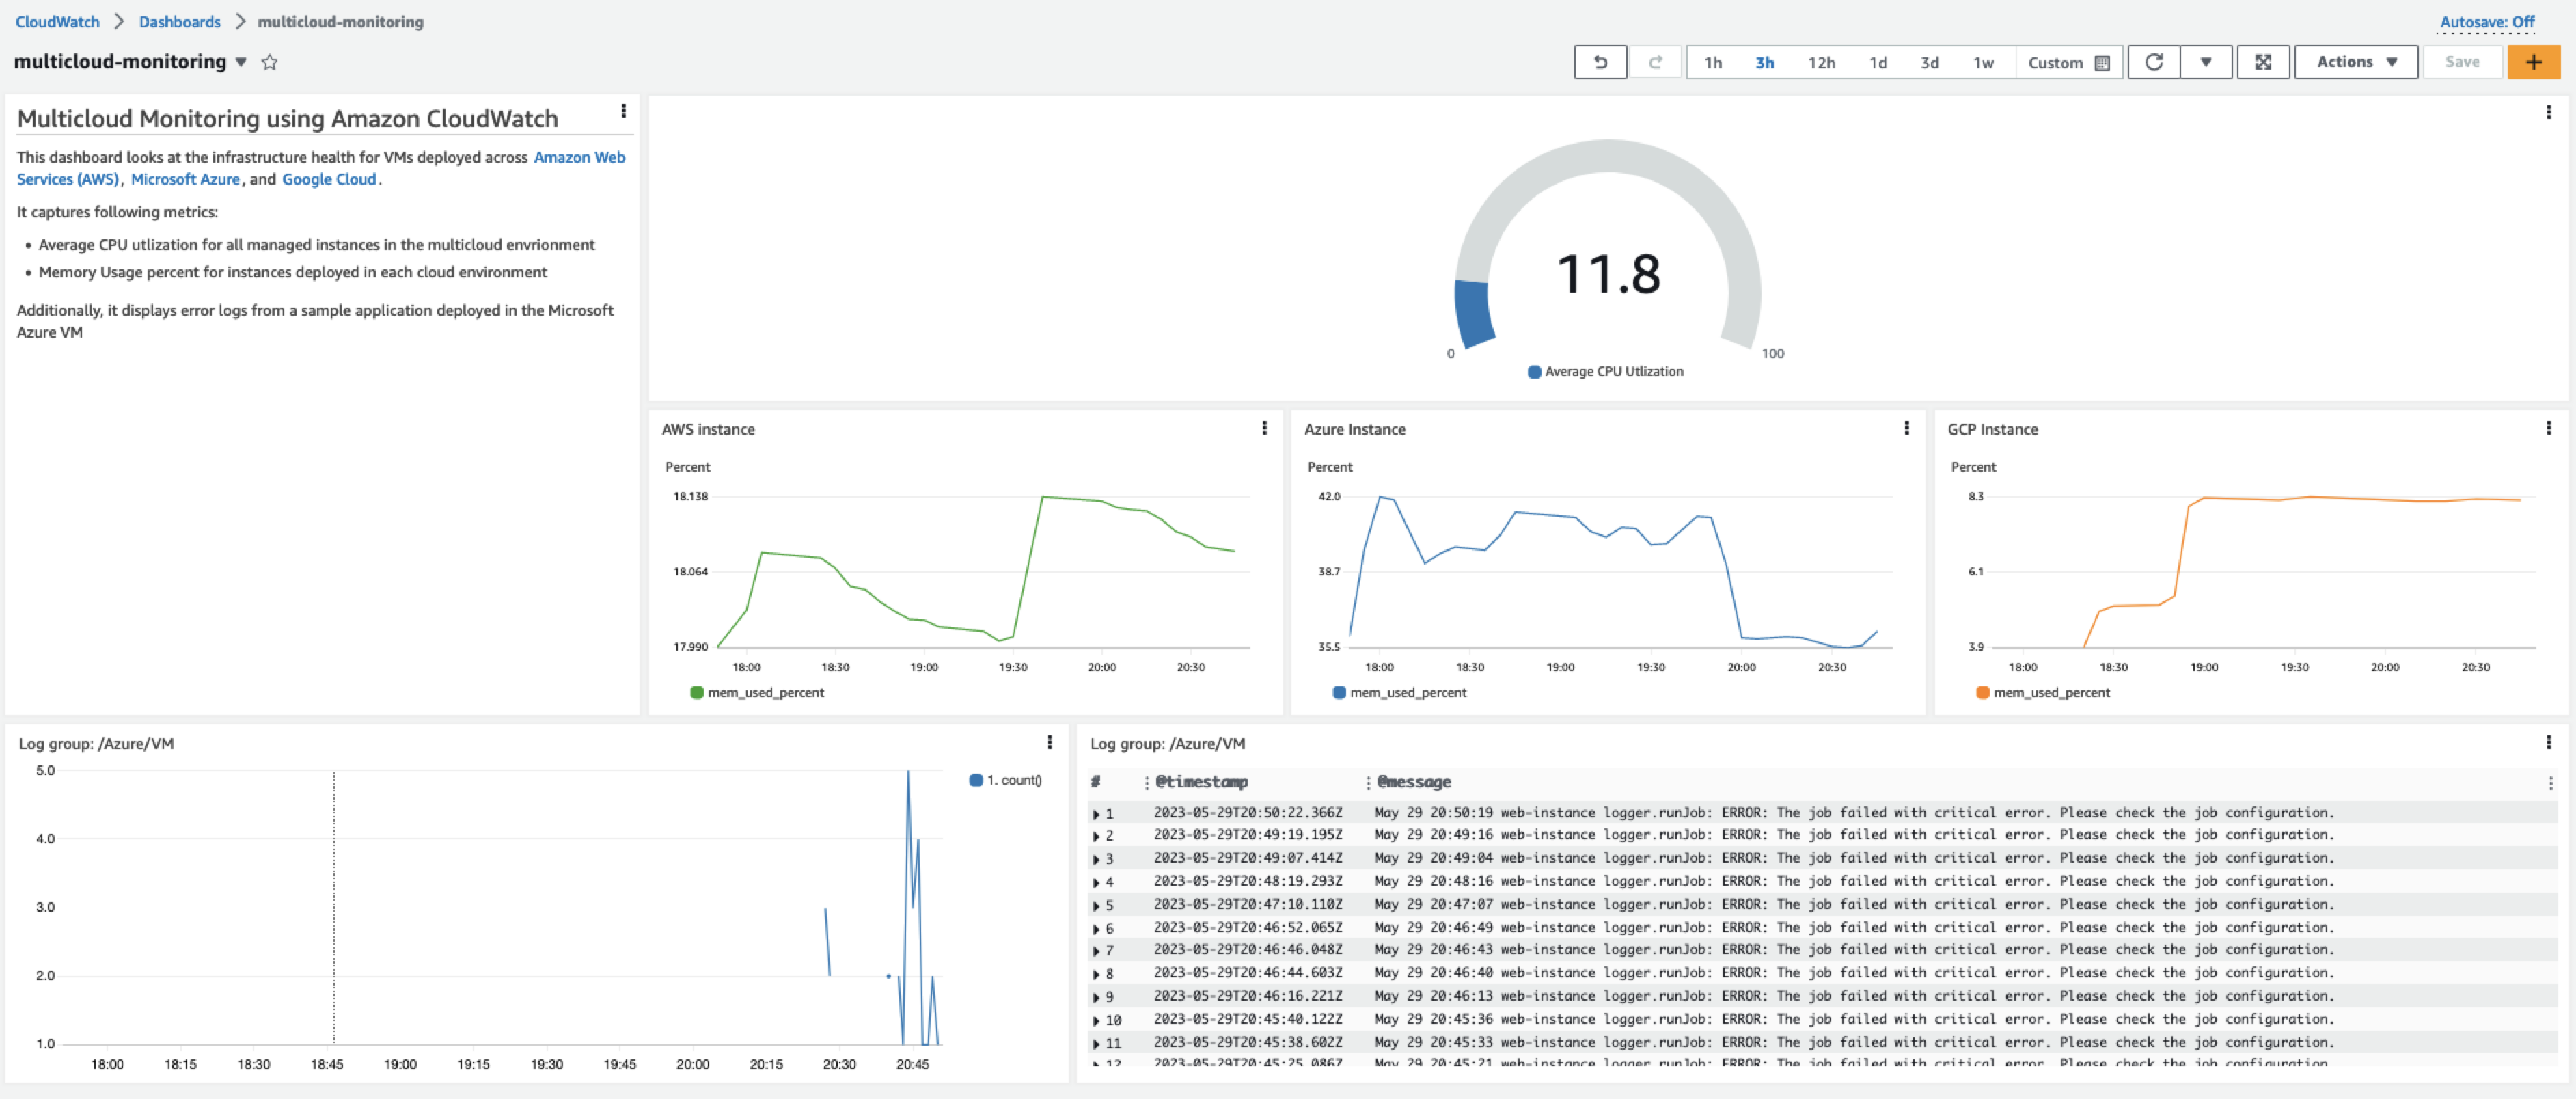
Figure 13 – CloudWatch Dashboard
Conclusion
In this post, we showed you how Systems Manager and CloudWatch can help organizations monitor hybrid and multicloud environments. We also showed how organizations can implement end-to-end monitoring in AWS for workloads deployed in other platforms such as Microsoft Azure and Google Cloud Platform. Finally, we covered the steps for setting up monitoring, showed how to monitor an application deployed in Azure and GCP along with building an observability dashboard.