AWS Cloud Operations Blog
Monitoring Generative AI applications using Amazon Bedrock and Amazon CloudWatch integration
Amazon Bedrock is an easy way to build and scale generative AI applications with foundation models (FMs). As a fully managed service, it offers a choice of high-performing FMs from leading AI companies including AI21 Labs, Anthropic, Cohere, Meta, Stability AI, and Amazon. It also offers a broad set of capabilities needed to build generative AI applications, simplifying development while maintaining privacy and security.
Bedrock is integrated with Amazon CloudWatch which helps you track usage metrics and build customized dashboards for audit purposes. You can use these metrics to understand usage such as model invocations and token count from one foundation model in a single account to all of your foundation models across multiple accounts. Bedrock also provides customers with model invocation logging, a feature which can be used to collect metadata, requests, and responses for all model invocations in your account. By default, this feature is disabled and must be enabled by the customer for Bedrock to start publishing invocation logs.
In this blog post we dive deeper into how you can use CloudWatch to monitor Bedrock in near real-time, with metrics and logs that can be used to trigger alarms and take actions when values exceed predefined thresholds. CloudWatch also has rich set of other features that you can take advantage of including cross-account observability, log and metric correlation, composite alarms, log analytics, and application performance monitoring.
Configuring model invocation logging
Model invocation logging is currently in preview so please keep in mind changes may be made to this feature. Enabling logging will collect metadata, requests and responses for all model invocations in your account.
To configure logging, navigate to the Settings page in the Bedrock console, from the left navigation bar. Then toggle the Model invocation logging button which will present you with several fields that will need to be filled out before logging can be enabled.
First, select the data types to include with logs. You can choose text, image and embedding.
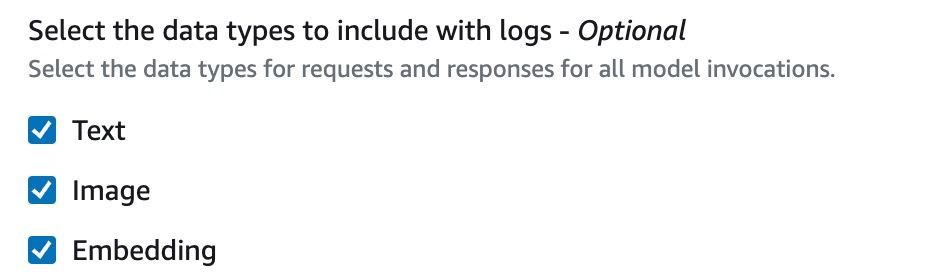
Figure 1: Multi-select control of data types to include with Logs (Text, Image, Embedding)
Next, select your logging destination, where you have three options. The first option is S3 Only which configures Bedrock to only send logs to a S3 bucket of your choice. The second option is CloudWatch Logs only, which sends the logs to CloudWatch and when model input or output data is larger than 100kb or in binary format it can be optionally delivered to S3. The last option is Both S3 & CloudWatch Logs where logs are sent to both S3 & CloudWatch and when model input or output data is larger than 100kb or in binary format data it will only be sent to S3. Whatever option you choose you remain in control of model inputs and outputs, including encryption with KMS and retention duration. In my case I have chosen the CloudWatch Logs only option.
In the CloudWatch Logs configuration section specify a Log group name (in this case I chose /aws/bedrock). Please note you will need to create this log group in CloudWatch first.
Next, select the Create and use a new role option and provide a name for your role. In this case I chose BedrockCloudWatchLogs
Lastly, go to S3 and create a S3 bucket, in my case I chose this format bedrock-logging-[ACCOUNTID]-[REGION] for my bucket name. Now go back to Bedrock Settings, select your newly created bucket in the S3 bucket for large data delivery field, and click Save Settings to complete the configuration.
Generating log data from Bedrock
Now that we have setup logging in Bedrock, let’s go generate some log data using the Chat playground.
Navigate to the Chat playground in Bedrock and select your model and provide a prompt. In this case, I’m asking for a brief overview of Amazon CloudWatch.
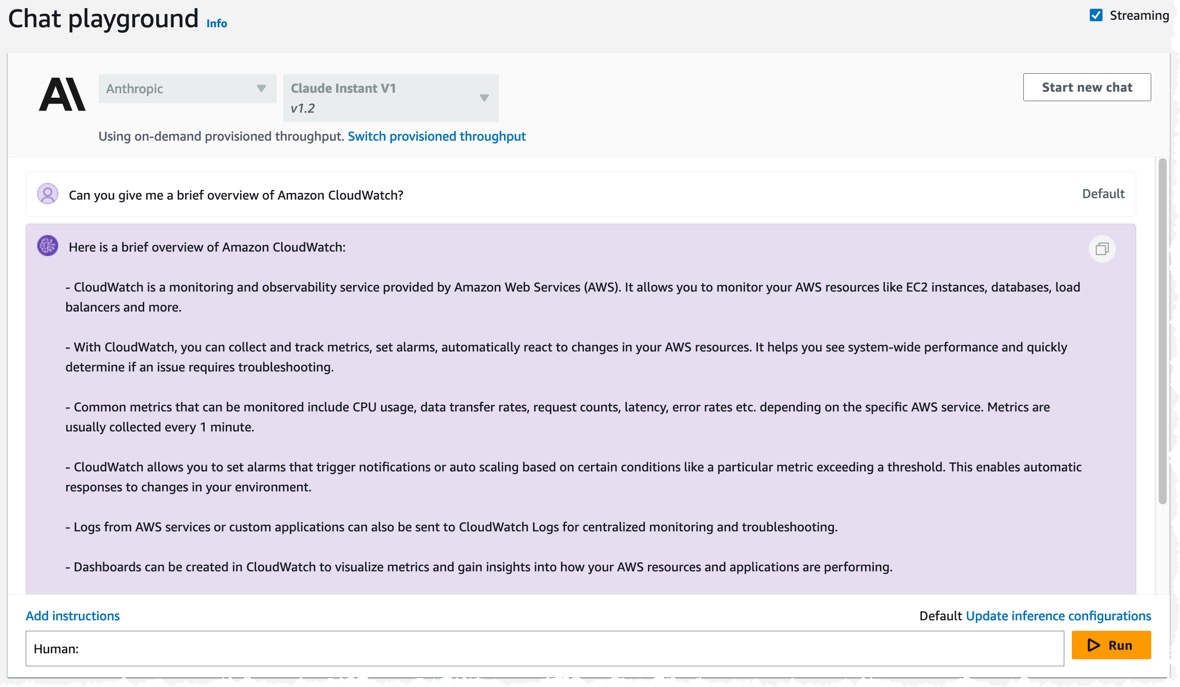
Figure 2: Bedrock Chat playground with Claude Instant V1.2 model selected and being asked to provide a brief overview of Amazon CloudWatch
In near real-time you should start to see logs in the newly created Log Group when you query the log group from Logs Insights.
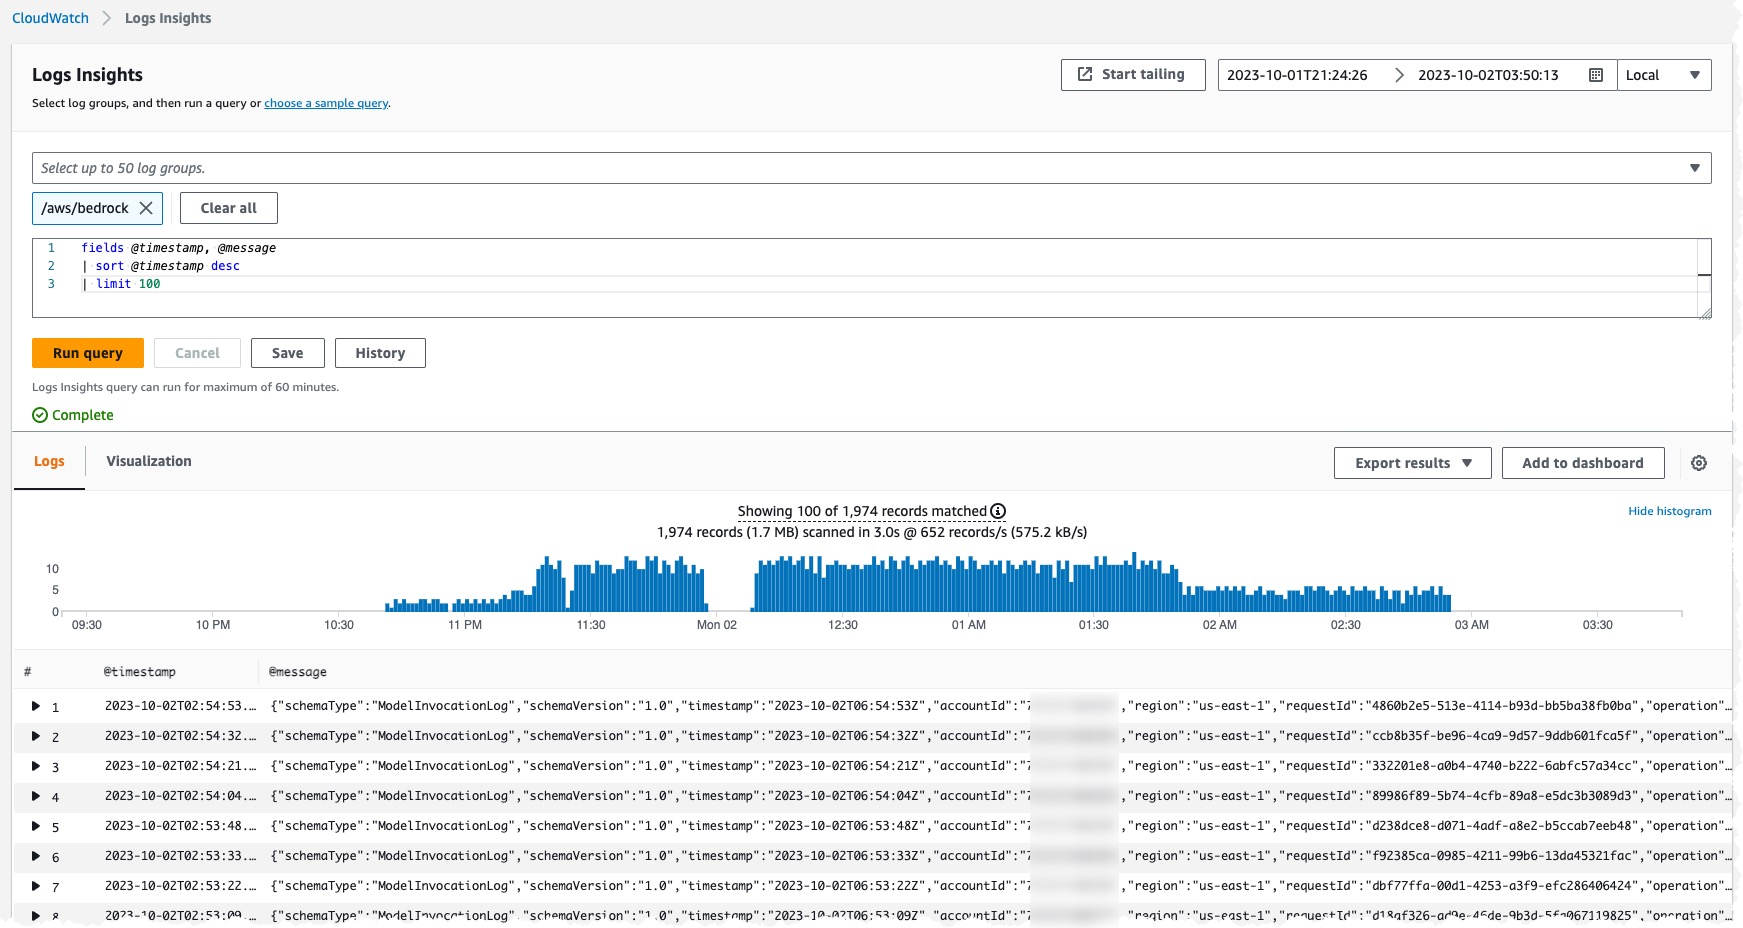
Figure 3: CloudWatch Log Insights query showing log events from newly created Log Group for Bedrock’s Model Invocation logging.
Once the model invocation logs are being delivered, you can use two features in CloudWatch to inspect your logs. The first is Live Tail and the second is Log Insights.
Streaming logs using Live Tail
Live Tail in CloudWatch Logs is a feature that provides an interactive log analytics experience that helps you view your logs interactively in near real-time as they’re ingested. Live Tail provides customers a rich out-of-the-box experience to view and detect issues in their incoming logs. Additionally, it provides fine-grained controls to filter, highlight attributes of interest, and pause/replay logs while troubleshooting issues
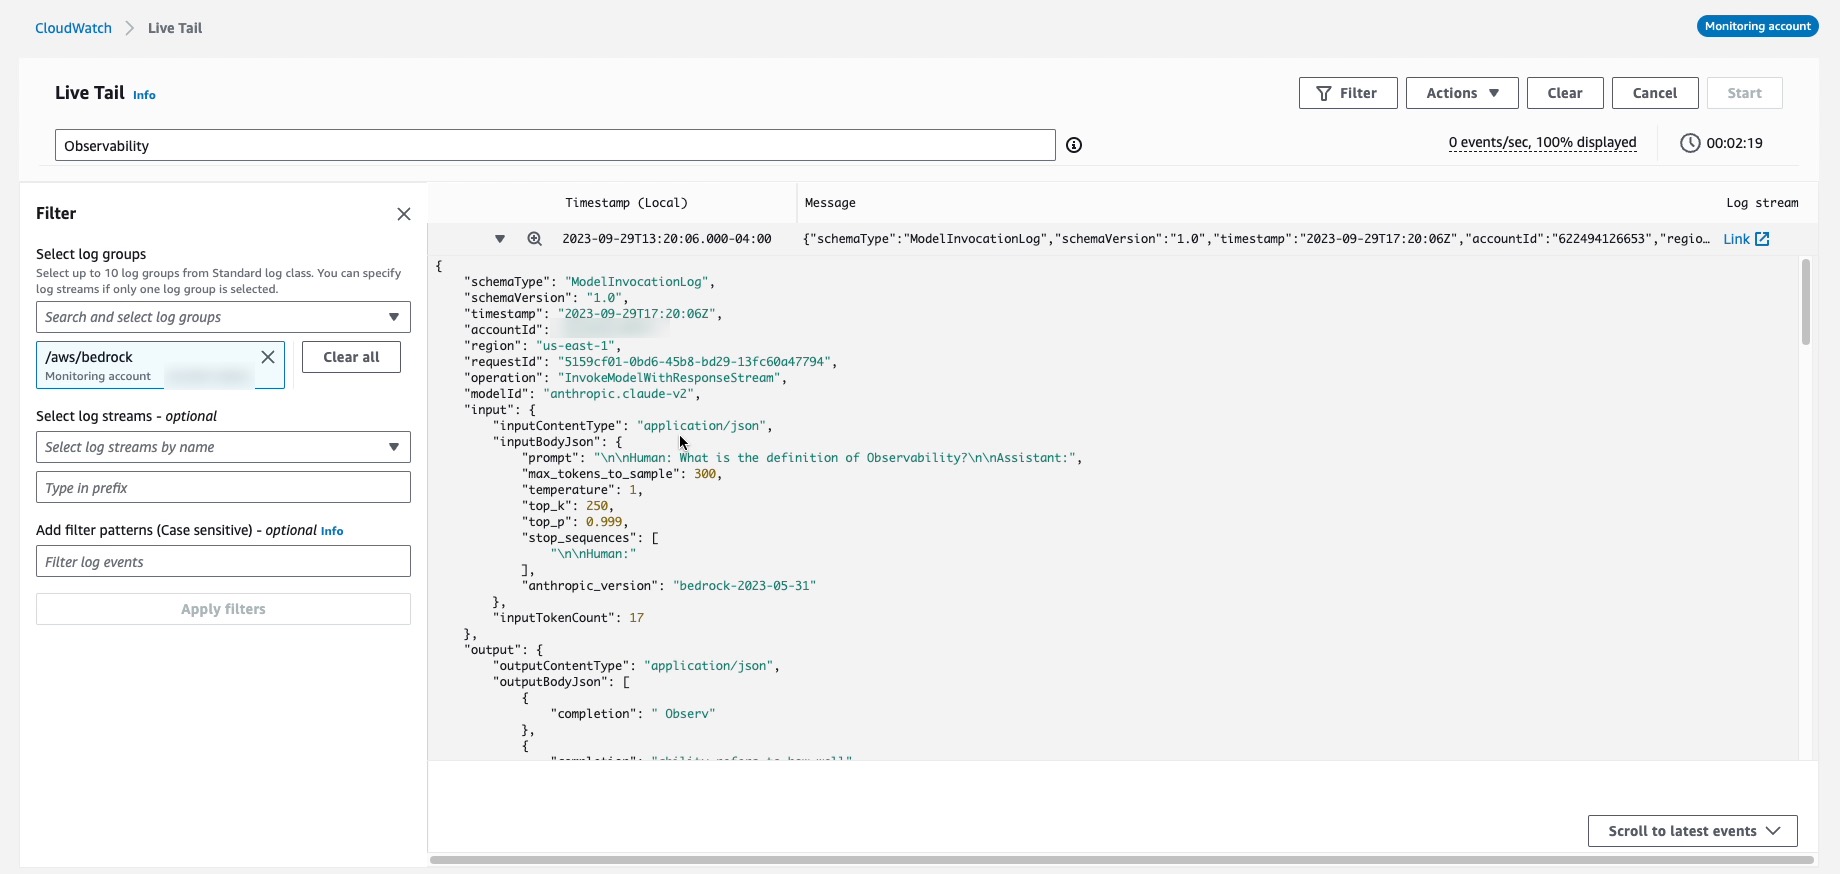
Figure 4: CloudWatch Logs Live Tail displaying log event from Bedrock Model Invocation Log generated by Bedrock Chat Playground.
Analyzing logs with Log Insights
CloudWatch Logs Insights enables you to interactively search and analyze your log data in CloudWatch Logs. You can perform queries to help you more efficiently and effectively respond to operational issues.
In the case of Bedrock we can use Log Insights to search and analyze the model invocation logs and search for specific keywords or simply the latest invocation logs. You can find a complete list of commands here.
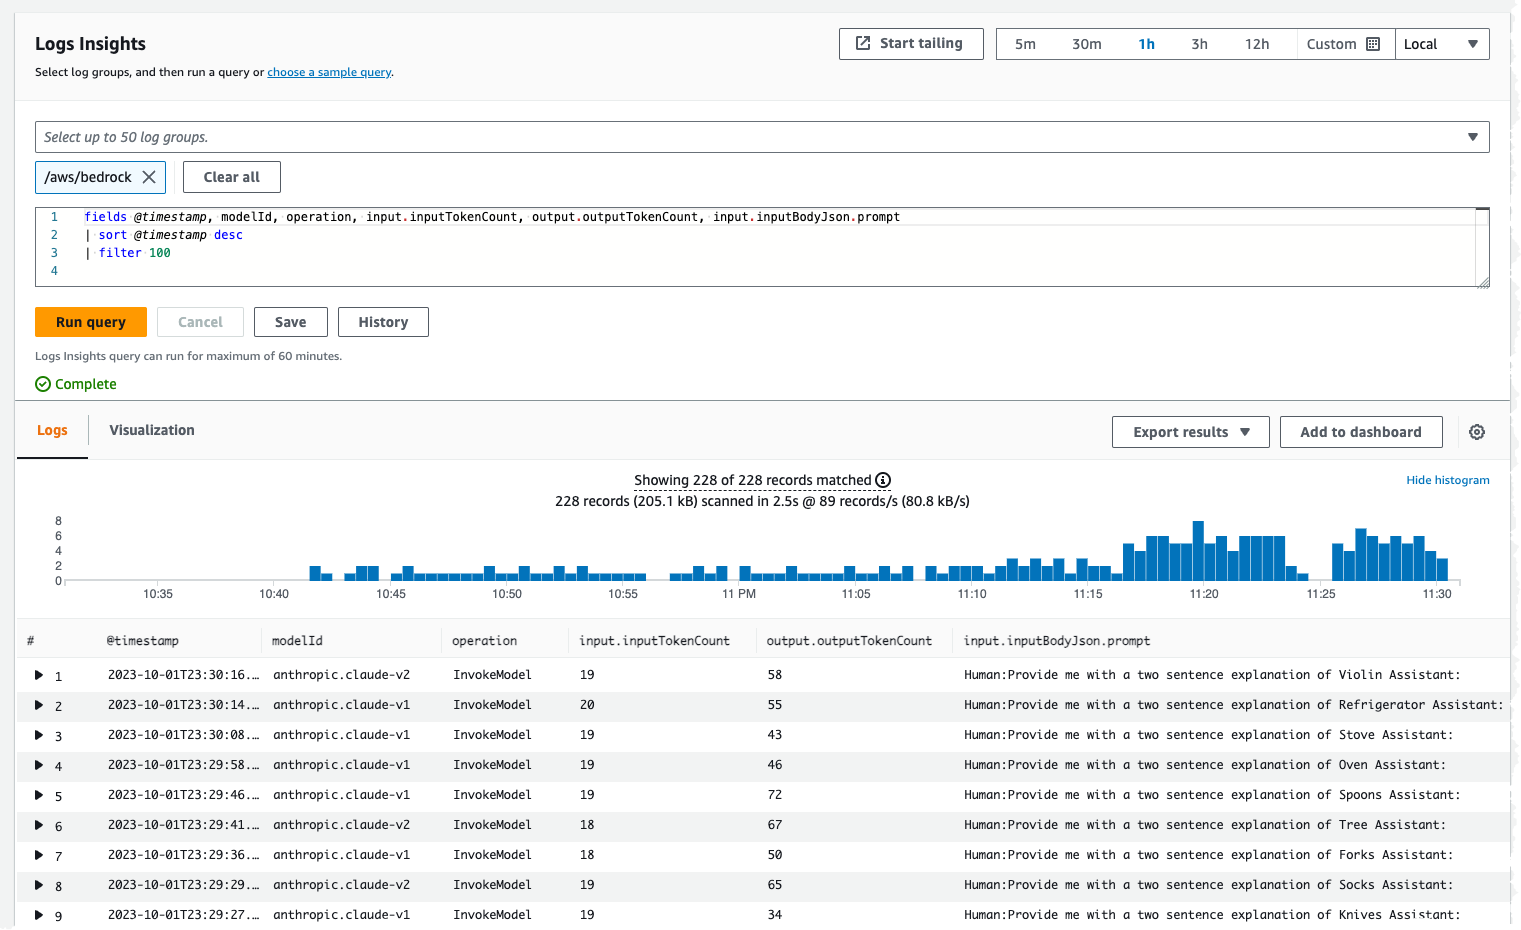
Figure 5: Log Insights query show the 100 latest log events with modelId, operation, input & output token count and prompt
Log Insights has also recently introduced a ML backed pattern query command which enables customers to more easily identify trends and patterns in their logs. The pattern command uses AWS Machine Learning algorithms to automatically recognize patterns in log data, aggregate related logs and summarize thousands of log lines into a few easy to visualize groupings.
In the example below we are using this new pattern command on the prompt field in the model invocation logs to recognize patterns in our prompts to Bedrock.
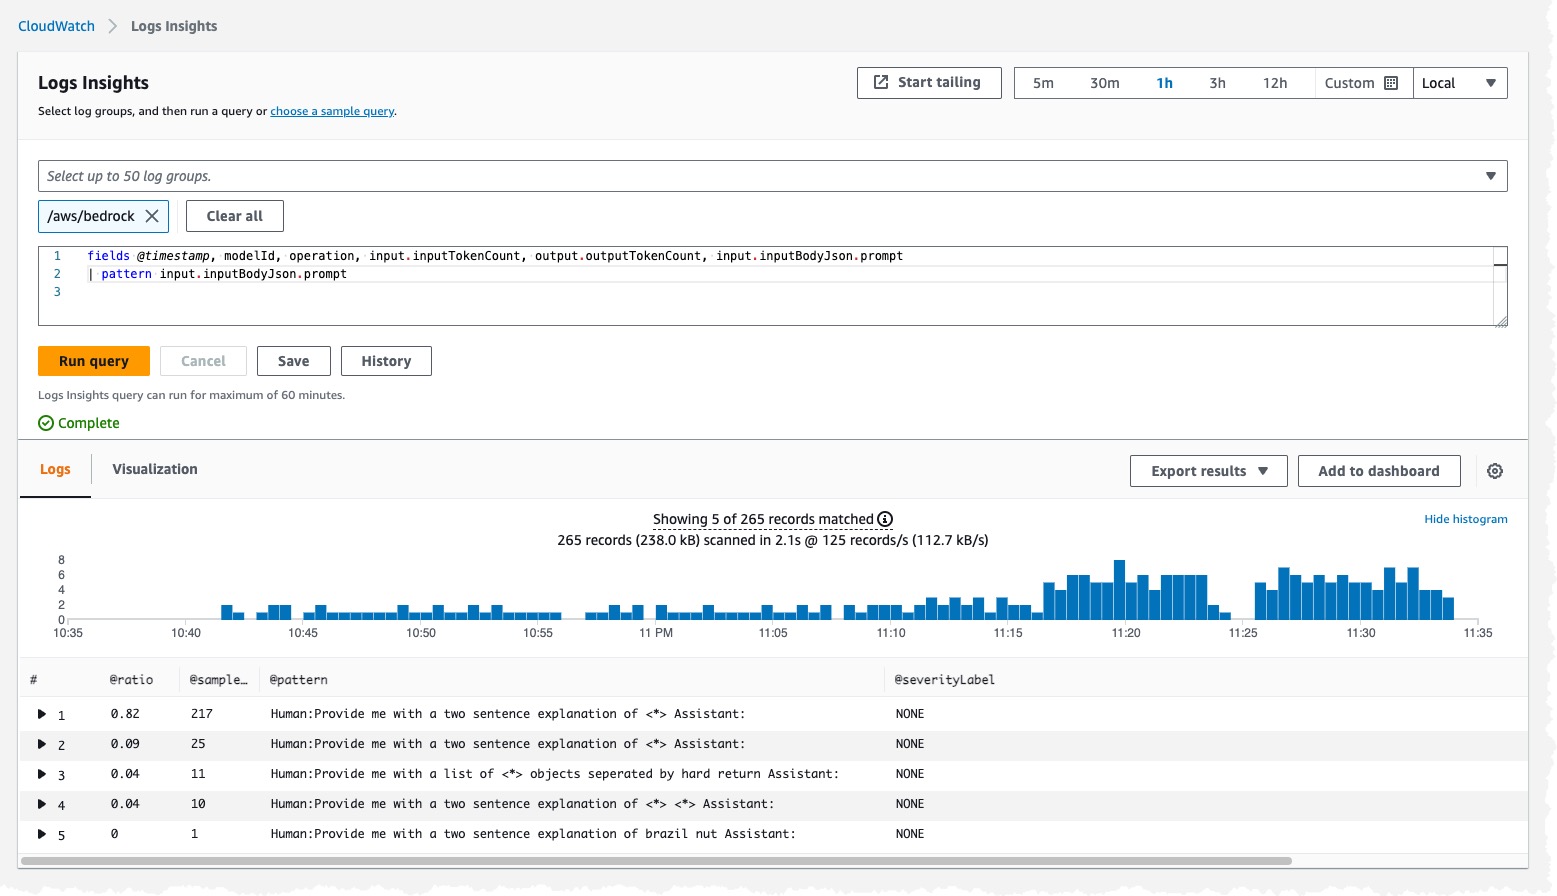
Figure 6: Log Insights query over a 1 hour period using the pattern command to summarize prompt text
Machine Learning Data Protection for CloudWatch Logs
CloudWatch also has a set of capabilities that leverage pattern matching and machine learning (ML) to detect and protect sensitive data in transit. You start with enabling a data protection policy on a Log Group. When you create the policy, you specify the data you want to protect. Then you can choose from over 100 managed identifiers.
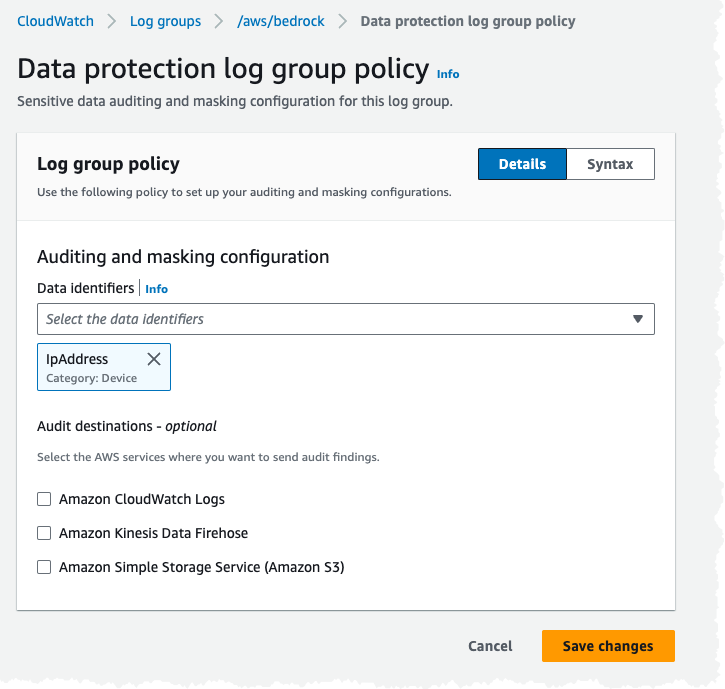
Figure 7: Configuration of a Data protection log group policy
In the example above I configured the Data Protection policy to look for IP addresses in my Log Group. When I asked Bedrock “What is 192.168.0.1”, it masks IP addresses it discovers in the model input & output log events.
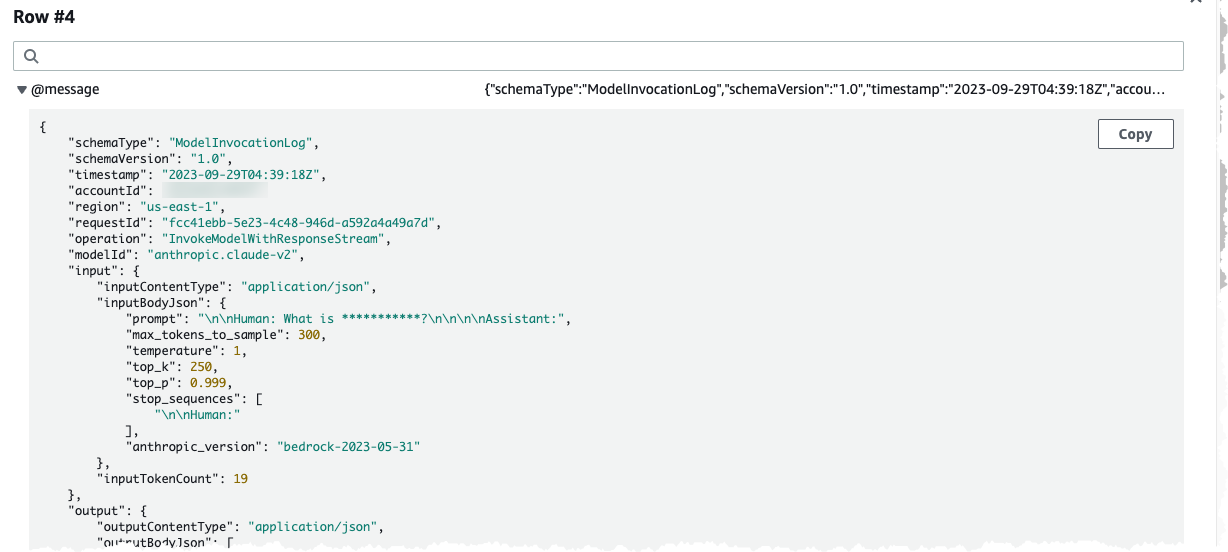
Figure 8: Log event for a single model invocation in JSON with the IP Address masked in the prompt field
Bedrock Runtime Metrics
Bedrock also sends near real-time metrics to CloudWatch, which can be used to set alarms that watch for certain thresholds, and then send notifications or take actions when values exceed those thresholds. You can also enable CloudWatch anomaly detection for metrics which applies statistical and machine learning algorithms that continuously analyze metrics, determine normal baselines, and surface anomalies with minimal user intervention.
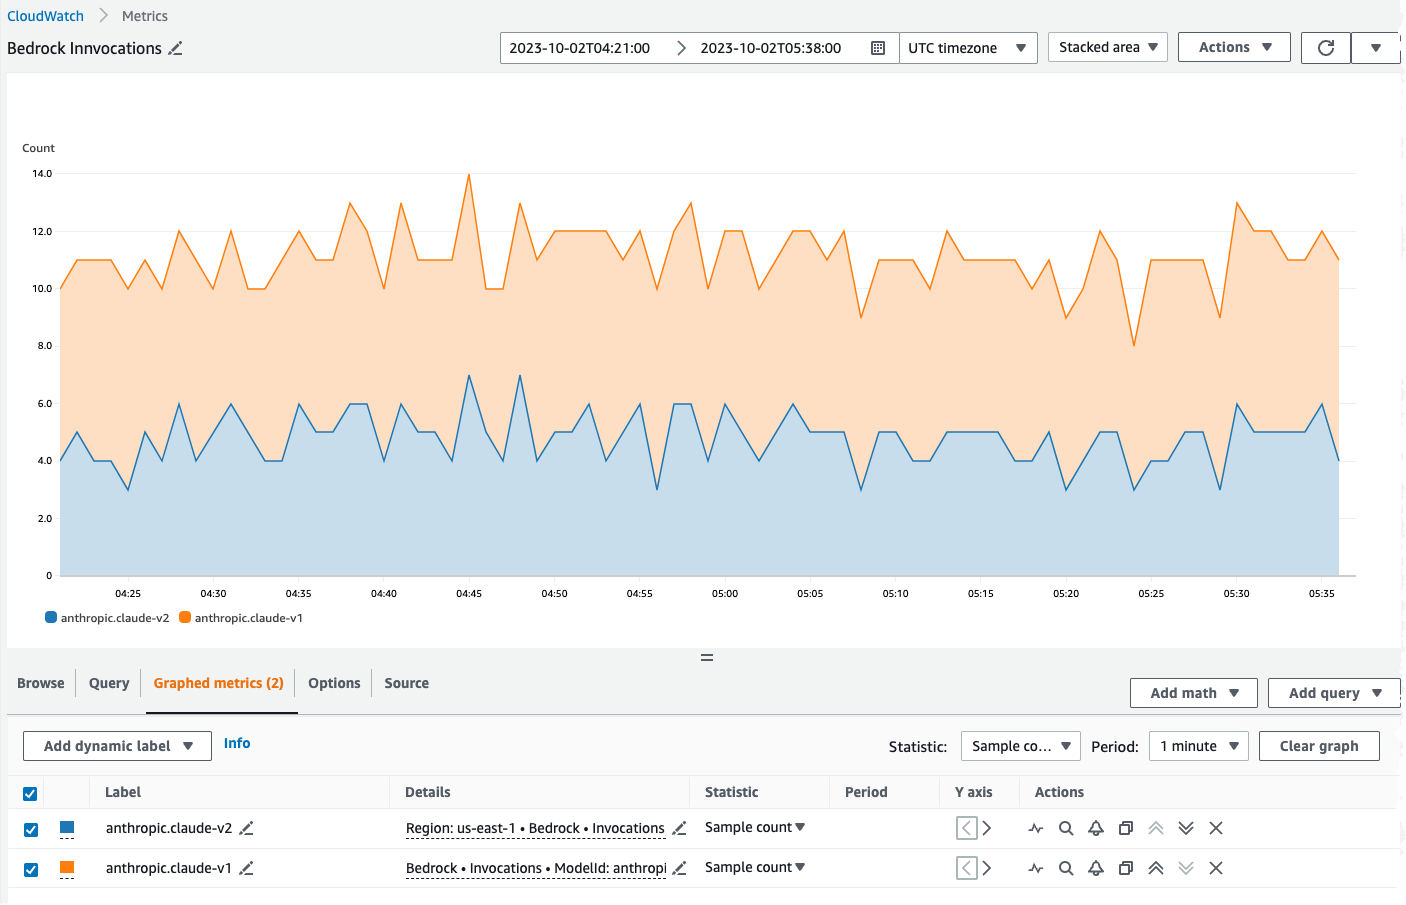
Figure 9: Visualization showing the number of invocations over a 15-minute period with a stacked area chart with Anthropic Claude v1 and Anthropic Claude v2 metrics in CloudWatch.
The runtime metrics provided by Bedrock are shown below and can also be found here:
| Metric Name | Unit | Description |
| Invocations | SampleCount | Number of requests to the InvokeModel or InvokeModelWithResponseStream API operations. |
| InvocationLatency | MilliSeconds | Latency of the invocations. |
| InvocationClientErrors | SampleCount | Number of invocations that result in client-side errors. |
| InvocationServerErrors | SampleCount | Number of invocations that result in AWS server-side errors. |
| InvocationThrottles | SampleCount | Number of invocations that the system throttled. |
| InputTokenCount | SampleCount | Number of tokens of text input. |
| OutputTokenCount | SampleCount | Number of tokens of text output. |
| ContentFilteredCount | SampleCount | Number of times the text output content was filtered. |
| OutputImageCount | SampleCount | Number of output images. |
These metrics can be used for a variety of use cases including:
- Comparing latency between different models using the InvocationLatency metric with ModelId dimension
- Measuring token count (input & output) to assist in purchasing provisioned throughput by analyzing the InputTokenCount and OutputTokenCount
- Detecting and alerting on throttling with an CloudWatch Alarm with the InvocationThrottles metric
For simplicity, the logs and metrics that Bedrock sends to CloudWatch can be presented as a single view using CloudWatch dashboards. If you have multiple AWS accounts, you can setup CloudWatch cross-account observability and then create rich cross-account dashboards in your monitoring accounts.
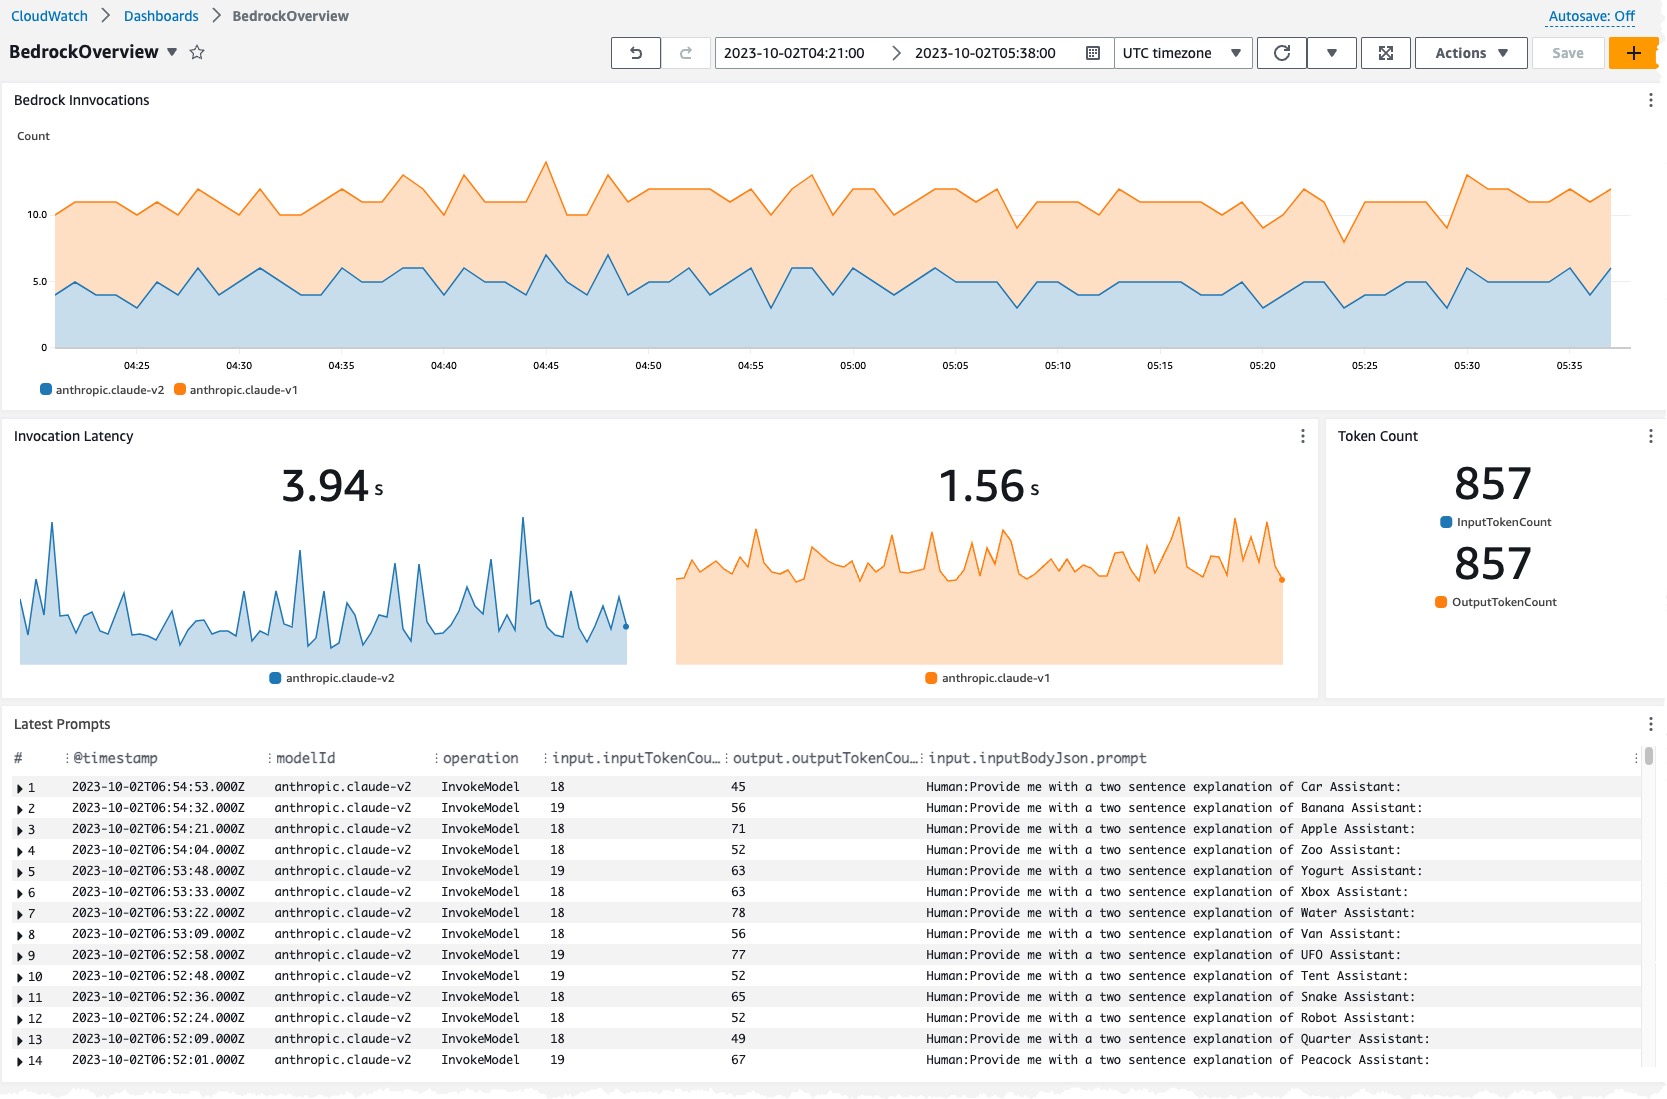
Figure 10: CloudWatch Dashboard showing the number of invocations over time by model, invocation latency by model, token count by input & output, and latest prompts from model invocation logs.
In dashboard above we are showing the following information:
- The number of invocations over time by model
- Invocation latency by model
- Token count by input and output tokens
- The latest prompts from the invocation logs showing the model, operation, input and output token count.
Conclusion
In this post, we’ve shown how to monitor Bedrock with CloudWatch and gain insight into your usage of foundation models and generative AI applications. Bedrock is a fully managed service that enables easy development and scaling of generative AI applications using foundation models from leading AI providers. It integrates with CloudWatch to provide near real-time monitoring, auditing, and usage analytics capabilities through metrics and logs. Bedrock simplifies building generative AI applications at scale while providing transparency and control through its integration with CloudWatch.