AWS Cloud Operations Blog
Troubleshooting AWS Glue ETL Jobs using Amazon CloudWatch Logs Insights enhanced queries
Introduction
In the realm of data integration and ETL (Extract, Transform, Load) processes, organizations often face challenges in ensuring efficiency and performance of the ETL jobs. Monitoring the efficiency of ETL jobs becomes crucial in maintaining seamless data workflows. This is where Amazon CloudWatch Logs Insights comes into play, offering powerful log analytics to unearth inefficiencies and bottlenecks. AWS Glue stands out for its serverless capabilities, simplifying data preparation, and loading tasks. In this post, we’ll explore how to leverage AWS Glue together with CloudWatch Logs Insights for enhanced log analytics, focusing on querying for cost inefficiencies and pinning down performance bottlenecks.
Background
You’ve noticed that your AWS Glue ETL jobs are running longer than expected, leading to increased costs and delayed data availability for downstream analytics. Your goal is to identify the root causes of these issues by analyzing AWS Glue job logs with CloudWatch Logs Insights.
Step 1: Setting Up Log Collection
By default, AWS Glue does not automatically send logs to CloudWatch Logs. To enable logging, you must explicitly configure your AWS Glue jobs to do so. This involves adjusting the job’s settings to specify that logs should be directed to CloudWatch.
* In the AWS Glue Console, find the job you want to enable logging for. Select the job and click on the “Action” button, then choose “Edit job”.
* Scroll down to the “Security configuration, script libraries, and job parameters (optional)” section. Look for the “Logging” options. You will see several checkboxes related to logging. Check “Enable logging” box to enable logging for your job. This is the primary step to send logs to CloudWatch.
Step 2: Querying for Inefficiencies
You want to identify jobs that are running longer than usual. Navigate to the CloudWatch service in the AWS Management Console, and select “Logs Insights”. Choose the log group associated with your AWS Glue jobs. Typically, this would be /aws-glue/jobs/output for job logs.
We aim to find jobs that have a higher-than-average runtime, which could indicate inefficiency. Jobs with a high AvgDuration or MaxDuration could be targets for optimization. Investigate these jobs further to understand why they’re taking longer than expected. Use the following query structure, which lists the number of jobs runs with an execution time for each job, as shown in screenshot below (Figure 1).
fields @timestamp, @message, @logStream as JobRun
| filter @message like /committed/
| parse @message /Job (?<jobNumber>\d+) finished:.*?, took (?<executionTime_inSeconds>\S+) s/
| parse @message /Write Job (?<jobId>[a-f0-9\-]+) committed\./
| display JobRun , jobId, jobNumber, executionTime_inSeconds
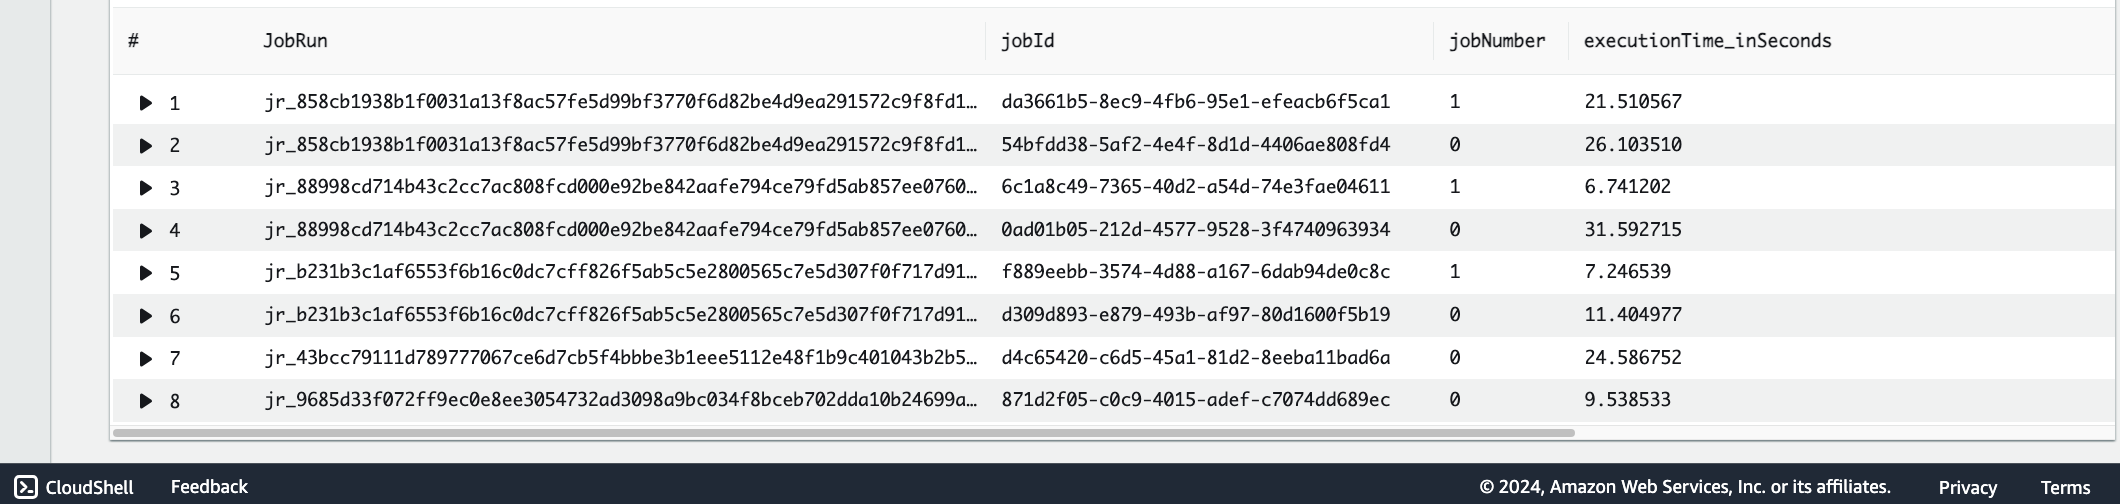
Figure 1: The CloudWatch Logs Insights console page displaying execution time for each JobRun.
As a next step, given that we have access to execution times, let’s calculate both the average and the maximum execution durations for each job, considering the total number of runs as shown in screenshot below (Figure 2). This approach will highlight the jobs that stand out as candidates for optimization based on their difference between AvgDuration and MaxDuration execution time.
fields @timestamp, @message, @logStream as JobRun
| filter @message like /committed/
| parse @message /Job (?<jobNumber>\d+) finished:.*?, took (?<executionTime_inSeconds>\S+) s/
| parse @message /Write Job (?<jobId>[a-f0-9\-]+) committed\./
| stats avg(executionTime_inSeconds) as AvgDuration, max(executionTime_inSeconds) as MaxDuration by JobRun
| fields MaxDuration – AvgDuration as difference
| sort difference desc
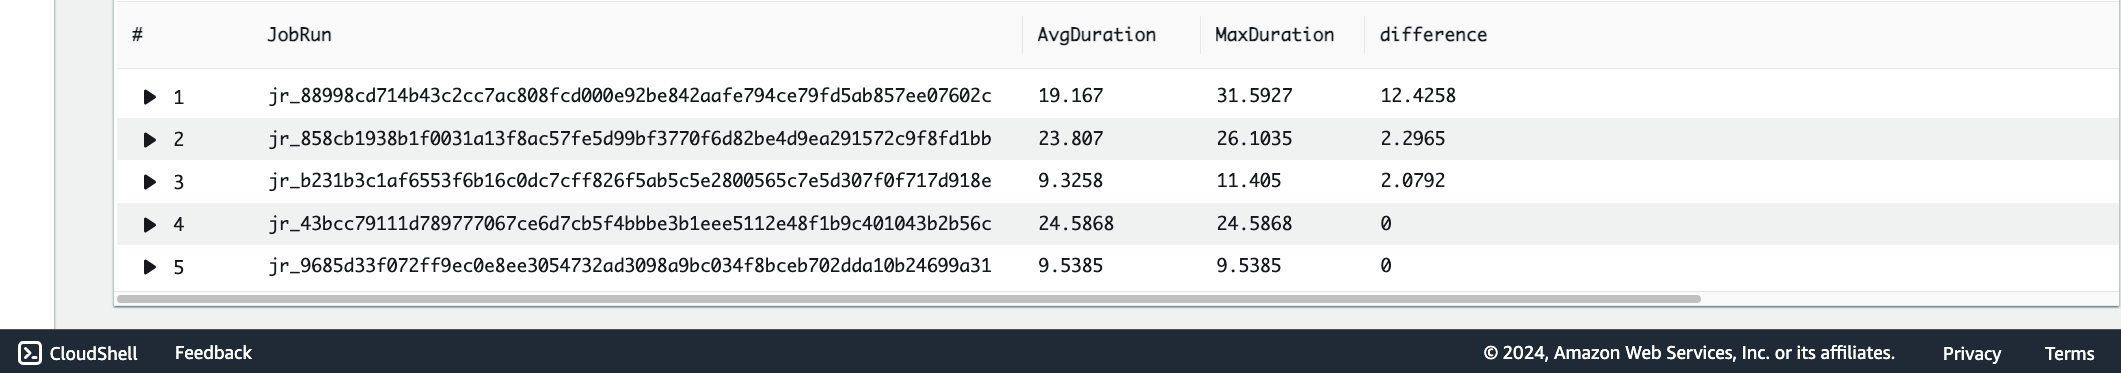
Figure 2: The Console page displaying Avg and Max execution time with their difference
Step 3: Pinning Down Performance Bottlenecks
To pinpoint stages that take the longest time, identifying the log messages that indicate the start and end of a job stage is essential. To Identify specific stages within your AWS Glue jobs that are causing delays, will pick a jobRun Id (ending in 602c) based on their high Job_Run_Difference from the query above as shown in Screenshot (Figure 2). Use a below query : This query extracts stages (Connection time, reading variable time, Code generation time) and their durations per stage, to identify which are the most time-consuming as shown in screenshot below (Figure 3). Stages with high durations are your bottlenecks. Review these stages in your AWS Glue scripts to optimize performance, such as by improving data partitioning or simplifying complex transformations.
fields @timestamp, @message, @logStream as JobRun
| filter @message like /jr_88998cd714b43c2cc7ac808fcd000e92be842aafe794ce79fd5ab857ee07602c/
| parse @message /.*after (?<Connection_time_in_ms>\d+) ms.*/
| parse @message /.*took (?<Reading_Variable_time_in_ms>\d+(\.\d+)?) ms.*/
| parse @message /.*Code generated in (?<Code_Generated_time_in_ms>\d+\.\d+) ms.*/
| filter ispresent(Connection_time_in_ms) or ispresent(Reading_Variable_time_in_ms)
| display @timestamp, @message, Connection_time_in_ms, Reading_Variable_time_in_ms, Code_Generated_time_in_ms

Figure 3: The Console page displaying different stages
Furthermore, we can leverage CloudWatch Logs Insights “Pattern” feature and construct a query for the same above jobRun Id to identify a Spark configuration, that would impact job’s performance as shown below.
filter @message like /WARN/
| filter @message like /jr_88998cd714b43c2cc7ac808fcd000e92be842aafe794ce79fd5ab857ee07602c/
| parse @message ‘spark.executor.instances less than *’ as cause
| pattern cause
| sort @sampleCount desc
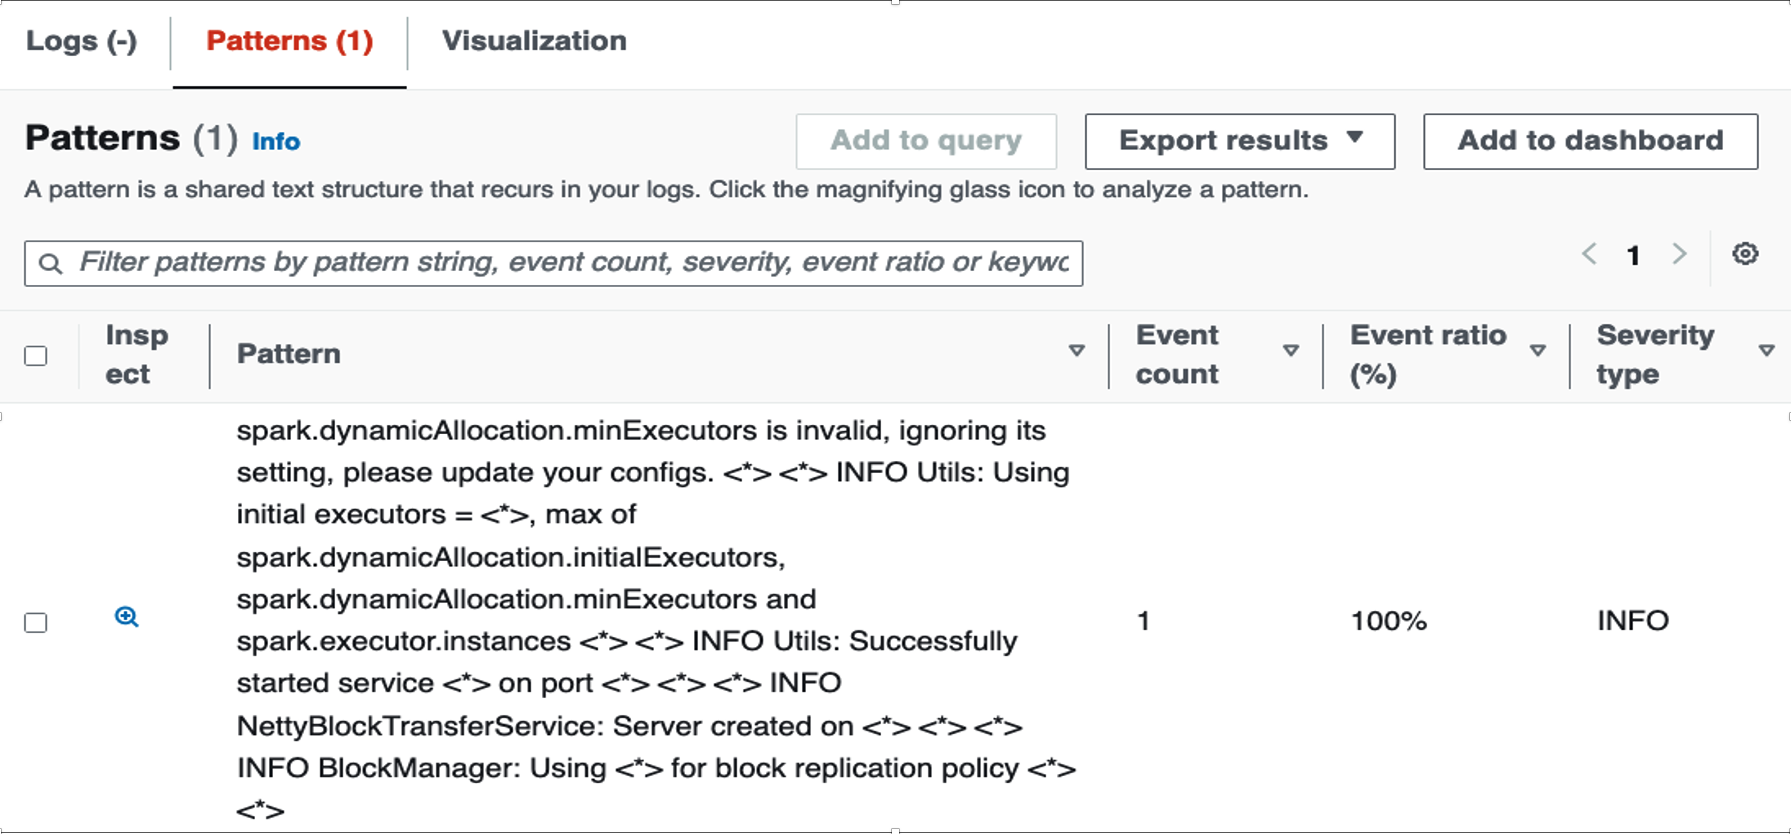
Figure 4: The Patterns page in the console displaying Event count
The error message from the pattern output in the screenshot shown above (Figure 4) implies that the setting provided for spark.dynamicAllocation.minExecutors in the AWS Glue job configuration is not recognized or is set to an invalid value. As a result, Spark’s dynamic allocation feature will ignore the specified minExecutors value and proceed with the default settings or other valid configurations provided. This missing setting can significantly impact AWS Glue resource allocation process. Without the intended minExecutors setting, the job might start with fewer executors than desired, potentially leading to slower job startup times and initial processing phases. By using pattern analysis, the users can capture valuable performance insights and job details, enabling them to identify and rectify misconfigurations.
Conclusion
By following these steps and utilizing Amazon CloudWatch Logs Insights for detailed log analysis, you can significantly improve the efficiency and performance of your AWS Glue ETL jobs. This not only reduces costs but also establish your data is processed and available for analytics in a timely manner. The key to effective troubleshooting lies in detailed monitoring and the ability to dive deep into log analytics.